Census 2011 – Country of birth, nationality and migration
Headlines
- The proportion of the population who were born outside the UK increased from 10.6% in 2001 to 14.2% in 2011
- South Africa and India are the most common non UK countries of birth
- 9.5% of the population were born outside the EU, but only 5.5% of the population hold passports from non EU countries suggesting that many have acquired British or other EU citizenship
- Nearly half (46.7%) of Surrey residents who were born overseas have arrived in the UK since 2000.
Country of birth
In 2011, 14.2% of Surreys population were born outside the UK. 4.8% were born in EU countries including the Republic of Ireland and 9.5% outside the EU. The borough with the highest proportion of the population born outside the UK was Woking (19.9%) and the lowest was Tandridge (8.7%)
Surrey has a slightly higher proportion of its population born outside the UK than England as a whole, where 4.4% were born in EU countries and 9.4% elsewhere.
Table 1: Country of birth 2011
| Born in UK | Republic of Ireland | Other EU Member countries in March 2001 |
EU Accession countries April 2001 to March 2011 |
Other Countries | |
| Surrey | 85.8% | 0.9% | 2.4% | 1.5% | 9.5% |
| Elmbridge | 81.7% | 1.1% | 3.1% | 1.7% | 12.4% |
| Epsom and Ewell | 83.7% | 1.1% | 2.5% | 1.3% | 11.3% |
| Guildford | 84.5% | 0.7% | 2.8% | 1.9% | 10.1% |
| Mole Valley | 90.1% | 0.7% | 1.7% | 1.1% | 6.4% |
| Reigate and Banstead | 87.9% | 0.9% | 1.9% | 1.4% | 8.0% |
| Runnymede | 83.1% | 1.0% | 3.0% | 1.8% | 11.1% |
| Spelthorne | 85.9% | 1.1% | 1.7% | 1.9% | 9.4% |
| Surrey Heath | 86.7% | 0.8% | 2.1% | 1.1% | 9.2% |
| Tandridge | 91.3% | 0.8% | 1.4% | 0.8% | 5.7% |
| Waverley | 89.4% | 0.7% | 2.2% | 1.2% | 6.6% |
| Woking | 80.1% | 0.9% | 3.3% | 2.0% | 13.7% |
| South East | 87.9% | 0.7% | 1.9% | 1.8% | 7.7% |
| England | 86.2% | 0.7% | 1.7% | 2.0% | 9.4% |
Source: Office for National Statistics
Figures may not sum to 100% due to rounding
Figure 1 Percentage of population born outside the UK 2011
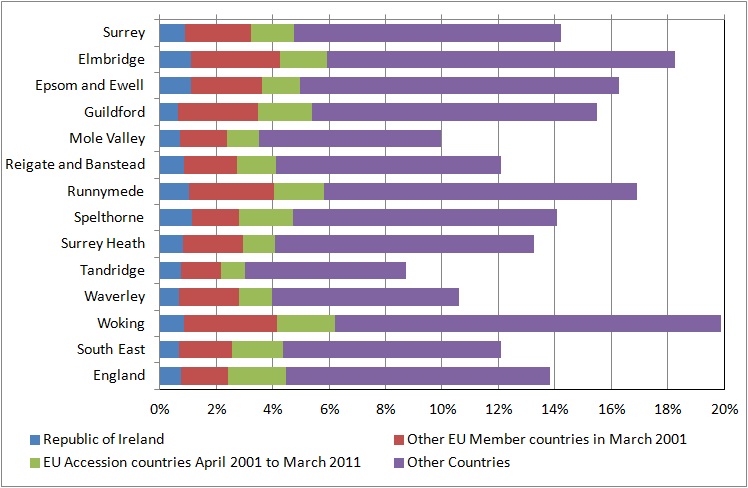
Source: Office for National Statistics
The proportion of Surrey residents born outside the UK has increased since 2001 when 10.6% were born outside the UK.
The percentage born in Republic of Ireland and countries in the EU in 2001 remains fairly similar, with the increase coming from other countries. Note that in the 2001 Census, people born in countries which have subsequently joined the EU would have been included in the other category.
Table 2: Country of birth of Surrey residents 2001 and 2011
| 2001 | 2011 | |
| Born in UK | 89.4% | 85.8% |
| Republic of Ireland | 1.0% | 0.9% |
| Other EU Member countries in March 2001 | 2.4% | 2.4% |
| EU Accession countries April 2001 to March 2011 | 1.5% | |
| Other Countries | 7.2% | 9.5% |
Source: Office for National Statistics
Table 3: Top 10 countries of birth of Surrey residents (excluding UK) 2011
| South Africa | 11,518 |
| India | 11,497 |
| Ireland | 9,970 |
| Poland | 7,581 |
| United States | 6,867 |
| Germany | 6,747 |
| Pakistan | 5,287 |
| Italy | 4,071 |
| Philippines | 4,054 |
| Australia | 3,835 |
Source: Office for National Statistics
Nationality
For the first time, the 2011 Census asked for information about passports held. Some people may hold two or more passports; these may be from non-EU countries, EU countries or a combination of both. Accordingly, the numbers of passports held by the resident population will exceed the number of passport holders.
82.3% of Surrey residents hold a UK passport. Tandridge has the highest proportion of UK passport holders (85.4%) and Runnymede the lowest (78.1%).
9.7% of the population do not have a passport, because they have never held one or their UK passport has expired. Spelthorne has the highest percentage with no passport (11.0%) and Elmbridge the lowest (7.3%).
5.5% of Surrey residents hold a non EU passport. This contrasts with the 9.5% of the population born outside the EU. This suggests that a large proportion of people who were born outside the EU have acquired British or other EU citizenship and hold a British or EU passport. However some people born abroad will be UK citizens because their parents were UK citizens overseas at the time of their birth.
4.7% of the population hold passports from EU countries. This is very close to the 4.8% of the population who were born in the EU. This may be because EU passport holders have rights to free movement and employment in the UK which non-EU nationals do not; thus there may be less need for EU passport holders resident in England and Wales to apply for a UK passport compared to non-EU nationals.
Surrey has a higher percentage of its population holding a UK passport than England as a whole. However a smaller percentage has no passport. Overall a higher proportion of Surrey residents (10.2%) hold a non UK passport than England as a whole (8.9%).
Table 4: Passports held 2011
| No passport | United Kingdom | Republic of Ireland | Other EU countries | Non EU countries | |
| Surrey | 9.7% | 82.3% | 1.0% | 3.7% | 5.5% |
| Elmbridge | 7.3% | 81.7% | 1.5% | 4.9% | 8.0% |
| Epsom and Ewell | 7.8% | 83.6% | 1.3% | 4.1% | 5.5% |
| Guildford | 10.2% | 80.3% | 0.7% | 4.4% | 6.6% |
| Mole Valley | 9.7% | 85.2% | 0.8% | 2.3% | 3.7% |
| Reigate and Banstead | 10.0% | 83.3% | 1.0% | 3.1% | 4.3% |
| Runnymede | 10.5% | 78.1% | 1.2% | 4.9% | 7.4% |
| Spelthorne | 11.0% | 80.9% | 1.2% | 3.6% | 4.9% |
| Surrey Heath | 9.0% | 84.5% | 0.9% | 2.6% | 4.8% |
| Tandridge | 10.3% | 85.4% | 0.9% | 1.9% | 3.0% |
| Waverley | 10.8% | 84.0% | 0.8% | 2.6% | 3.9% |
| Woking | 9.3% | 78.9% | 1.0% | 5.5% | 7.9% |
| South East | 14.1% | 79.0% | 0.7% | 3.3% | 4.2% |
| England | 16.5% | 75.8% | 0.8% | 3.6% | 4.5% |
Source: Office for National Statistics
Figures do not sum to 100% as people may hold two or more passports; thus the numbers of passports held by the resident population will exceed the number of passport holders.
Year of Arrival in the UK
For the first time, the 2011 Census asked for the year of arrival in the UK for residents who were born overseas.
46.7% of non UK born Surrey residents arrived in the UK since 2000. Runnymede (57.4%) and Guildford (56.1%) have the highest proportion of recent arrivals which may be due to foreign students studying at Royal Holloway College and the University of Surrey. The lowest proportion of recent arrivals is in Tandridge (35.6%).
The proportion of non UK born residents arriving since 2000 in England as a whole is slightly higher at 50.2%.
Table 5: Year of arrival in UK of non UK born residents
| arrived before 1991 | arrived 1991-2000 | arrived since 2000 | |
| Surrey | 36.8% | 16.5% | 46.7% |
| Elmbridge | 36.7% | 17.7% | 45.6% |
| Epsom and Ewell | 42.8% | 17.5% | 39.8% |
| Guildford | 28.6% | 15.3% | 56.1% |
| Mole Valley | 42.2% | 16.6% | 41.2% |
| Reigate and Banstead | 38.7% | 16.5% | 44.8% |
| Runnymede | 28.7% | 13.8% | 57.4% |
| Spelthorne | 38.0% | 16.5% | 45.5% |
| Surrey Heath | 39.7% | 17.4% | 42.9% |
| Tandridge | 47.6% | 16.8% | 35.6% |
| Waverley | 44.1% | 16.3% | 39.6% |
| Woking | 32.6% | 16.8% | 50.6% |
| South East | 34.3% | 15.5% | 50.1% |
| England | 33.2% | 16.6% | 50.2% |
Source: Office for National Statistics
Figure 2: Year of arrival in UK of non UK born residents
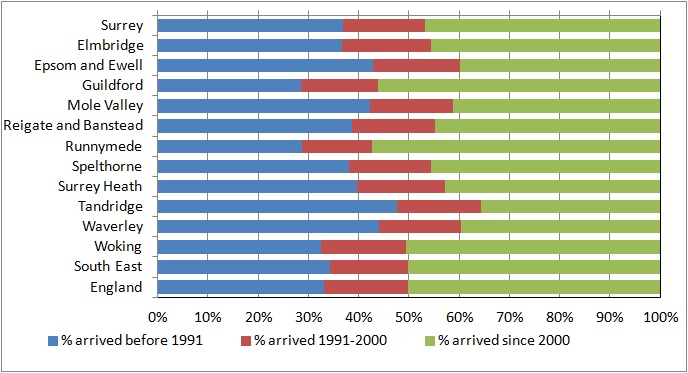
Source: Office for National Statistics