2021 Census: First results
Population and Household estimates from the 2021 Census
Headlines
- Surrey population has increased to 1,203,108 – 6.2% increase on 2011 Census. This growth rate is lightly lower than England as a whole (6.6%).
- All borough / district councils exhibited population growth varying from 2.4% (Mole Valley) to 9.4% (Reigate and Banstead).
- Population density across Surrey is 724 usual residents per square kilometre. This varies between borough / district councils from a low of 338 (Mole Valley) to a high of 2,375 (Epsom and Ewell).
- Surrey saw population decreases for the under 4s (-8.0%), those aged 35-49 (-3.1%), and amongst those aged 60-64 (-0.7%) but an increase in all other 5-year age bands.
- Large percentage increases were seen in our older population: 34.0% growth in those aged 70-74, 18.2% growth in those aged 75-79, and 14.5% growth in those aged 80 and above.
- Total population has grown faster than the number of households, so average household size has increased. Across Surrey there were 481,818 households – a growth of 5.7% relative to the 2011 Census.
- All borough / district councils exhibited an increase in households varying from 3.3% (Guildford) to 8.0% (Reigate and Banstead).
The raw data from this Census release has been processed by the Population Insight Team and is available here.
Contents
Total population
The usually resident population of Surrey, counted by the 2021 Census, was 1,203,108. This represents an increase of 70,718 (6.2%) since 2011. All borough / district councils showed growth since 2011, with the highest growth seen in Reigate and Banstead (9.4%) and the lowest in Mole Valley (2.4%).
Table 1: Population change by local authority
| Area name | All persons – 2021 | All persons – 2011 | Change from 2011 to 2021: All persons |
Percentage change from 2011 to 2021: All persons |
|---|---|---|---|---|
| England | 56,490,048 | 53,012,456 | 3,477,592 | 6.6% |
| South East | 9,278,065 | 8,634,750 | 643,315 | 7.5% |
| Surrey | 1,203,108 | 1,132,390 | 70,718 | 6.2% |
| Elmbridge | 138,754 | 130,875 | 7,879 | 6.0% |
| Epsom and Ewell | 80,938 | 75,102 | 5,836 | 7.8% |
| Guildford | 143,649 | 137,183 | 6,466 | 4.7% |
| Mole Valley | 87,386 | 85,375 | 2,011 | 2.4% |
| Reigate and Banstead | 150,846 | 137,835 | 13,011 | 9.4% |
| Runnymede | 88,079 | 80,510 | 7,569 | 9.4% |
| Spelthorne | 102,956 | 95,598 | 7,358 | 7.7% |
| Surrey Heath | 90,453 | 86,144 | 4,309 | 5.0% |
| Tandridge | 87,874 | 82,998 | 4,876 | 5.9% |
| Waverley | 128,229 | 121,572 | 6,657 | 5.5% |
| Woking | 103,943 | 99,198 | 4,745 | 4.8% |
Age
The largest 5 year cohort across Surrey are those aged 50-54 years, with a population of 87,327.
The fastest growing cohort compared to previous Census are those aged 70-74, with a growth of 34.1% (an additional 14,869 persons). This group reflects the post-WWII baby boom. Other older age groups have also increased: those aged 75-79 by 18.1%, and those aged 80 or older by 14.6%. At a local authority level, the largest increases in older people are: 43.6% increase in the 70-74 age group in Reigate and Banstead; 29.3% increase in 75-79 year olds in Tandridge; and, 39.0% increase in those aged 80 or above in Surrey Heath.
The amount of the Surrey population aged 4 or below has decreased by 8.0% since the previous Census. A similar level decrease (-7.3%) was observed across England, indicating that birth rates have fallen since 2016/17. This age group has fallen in all areas other than Tandridge (1.8% increase), Epsom and Ewell (0.0% change), and Spelthorne (-0.1% change). The largest decrease was observed in Guildford, which saw a 17.6% reduction in the number of preschool children across the past decade.
Table 2: Surrey population by 5 year age group
| Age | 2021 Census | 2011 Census | change | % change |
|---|---|---|---|---|
| All persons | 1,203,110 | 1,132,390 | 70,720 | 6.2% |
| Aged 4 years and under | 65,635 | 71,306 | -5,671 | -8.0% |
| Aged 5 to 9 years | 74,063 | 65,841 | 8,222 | 12.5% |
| Aged 10 to 14 years | 76,526 | 67,566 | 8,960 | 13.3% |
| Aged 15 to 19 years | 69,799 | 67,676 | 2,123 | 3.1% |
| Aged 20 to 24 years | 63,507 | 61,519 | 1,988 | 3.2% |
| Aged 25 to 29 years | 62,861 | 62,154 | 707 | 1.1% |
| Aged 30 to 34 years | 72,679 | 71,859 | 820 | 1.1% |
| Aged 35 to 39 years | 79,137 | 81,033 | -1,896 | -2.3% |
| Aged 40 to 44 years | 84,652 | 87,659 | -3,007 | -3.4% |
| Aged 45 to 49 years | 86,589 | 89,727 | -3,138 | -3.5% |
| Aged 50 to 54 years | 87,327 | 76,646 | 10,681 | 13.9% |
| Aged 55 to 59 years | 84,258 | 65,559 | 18,699 | 28.5% |
| Aged 60 to 64 years | 68,889 | 69,379 | -490 | -0.7% |
| Aged 65 to 69 years | 56,695 | 54,273 | 2,422 | 4.5% |
| Aged 70 to 74 years | 58,435 | 43,566 | 14,869 | 34.1% |
| Aged 75 to 79 years | 44,459 | 37,650 | 6,809 | 18.1% |
| Aged 80 and over | 67,599 | 58,977 | 8,622 | 14.6% |
The Office for National Statistics has produced interactive maps for the 2021 Census results. The maps below show the age distribution of residents.
Hover over the map to see each of the area names and values. Zoom in and out of these maps to see the data at smaller geographical areas.
Gender
Overall, 51.3% of Surrey’s population is female. This is slightly above the national position for England of 51.0%, reflecting our older population structure. Tandridge (at 51.8% female) has the largest female population proportion, and Woking (at 50.3%) the lowest female proportion amongst our borough and district councils.
The proportion of residents who are female generally increases with age: 48.7% of those aged 4 or under are female, compared to two thirds (67.6%) of those aged 90 or older.
Figure 1: Proportion of Surrey population who are female, by 5 year age group
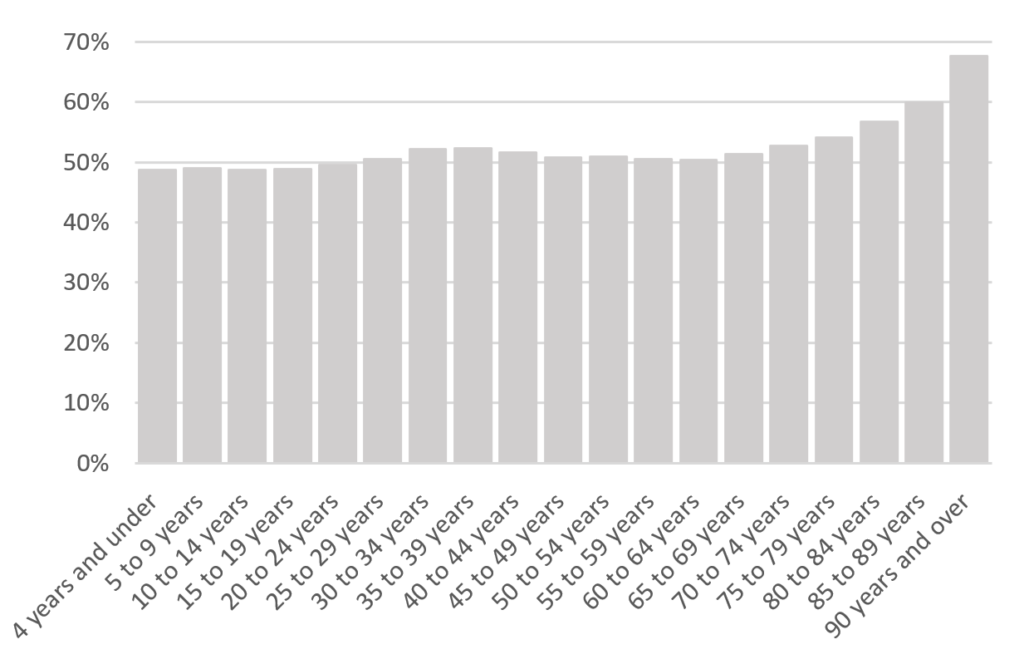
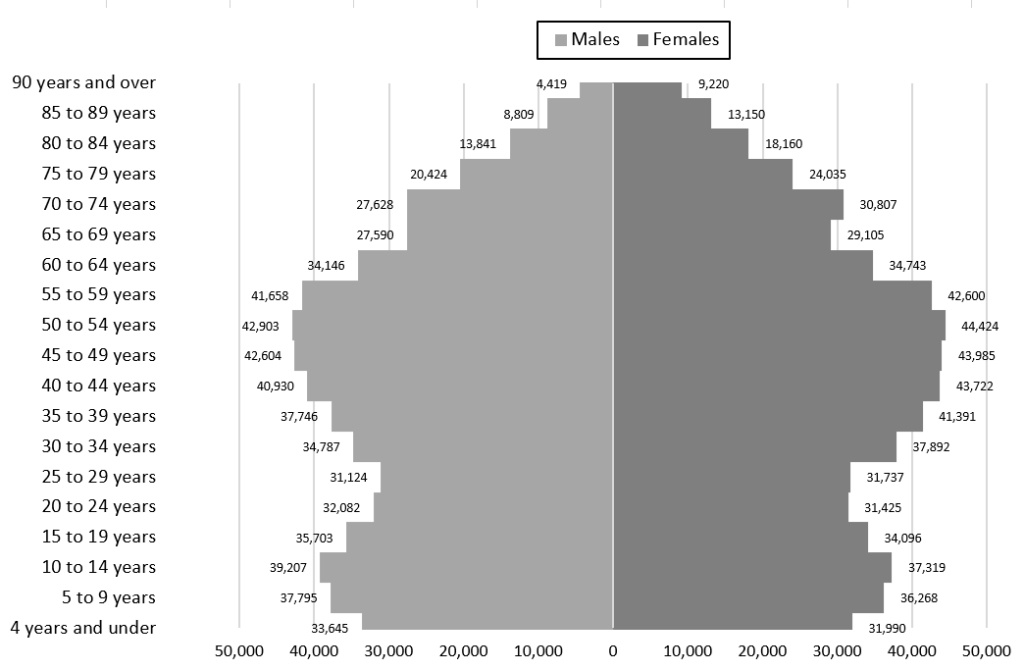
Figure 2: Surrey population by 5 year age group and sex (‘population pyramid’)
Key Age groups
Across Surrey, fewer than a quarter of residents were aged 19 or under (23.8%), with roughly 6 in 10 of ‘working age’ (20-64 years, 57.3%), and just under a fifth (18.9%) being ‘older people’ (aged 65 or above).
Amongst borough and districts, Elmbridge had the highest proportion of younger residents (at 25.6%), and Mole Valley the lowest (21.4%).
Woking had the highest proportion of ‘working age’ residents (59.3%) and Waverley the lowest (54.1%).
Mole Valley had the highest proportion of ‘older people’ at 23.8%; Woking had the lowest (16.6%).
Table 3: Proportion of population by broad age, for each local authority
| Area name | Total population | ‘Children’ (aged 0-19 years) | ‘Working age’ (aged 20-64 years) | ‘Older people’ (aged 65 or above) | % ‘Children’ 0-19 years | % ‘Working age’ | % ‘Older people’ | Children (0-17 years) | %Children (0-17 years) | Working age (18-64 years) | %Working age (18-64 years) | |
|---|---|---|---|---|---|---|---|---|---|---|---|---|
| England | 56,490,045 | 13,057,875 | 33,030,870 | 10,401,300 | 23.1% | 58.5% | 18.4% | . | 11,132,551 | 19.7% | 34,314,154 | 60.7% |
| South East | 9,278,063 | 2,140,587 | 5,333,217 | 1,804,259 | 23.1% | 57.5% | 19.4% | . | 1,830,995 | 19.7% | 5,535,748 | 59.7% |
| Surrey | 1,203,111 | 286,022 | 689,896 | 227,193 | 23.8% | 57.3% | 18.9% | . | 245,202 | 20.4% | 715,901 | 59.5% |
| Elmbridge | 138,757 | 35,581 | 78,356 | 24,820 | 25.6% | 56.5% | 17.9% | . | 31,793 | 22.9% | 80,386 | 57.9% |
| Epsom and Ewell | 80,939 | 19,911 | 46,415 | 14,613 | 24.6% | 57.3% | 18.1% | . | 17,370 | 21.5% | 47,936 | 59.2% |
| Guildford | 143,646 | 33,531 | 84,960 | 25,155 | 23.3% | 59.1% | 17.5% | . | 25,936 | 18.1% | 90,755 | 63.2% |
| Mole Valley | 87,386 | 18,673 | 47,951 | 20,762 | 21.4% | 54.9% | 23.8% | . | 16,122 | 18.4% | 49,393 | 56.5% |
| Reigate and Banstead | 150,852 | 36,605 | 87,526 | 26,721 | 24.3% | 58.0% | 17.7% | . | 32,393 | 21.5% | 89,952 | 59.6% |
| Runnymede | 88,085 | 20,983 | 51,939 | 15,163 | 23.8% | 59.0% | 17.2% | . | 16,263 | 18.5% | 55,778 | 63.3% |
| Spelthorne | 102,953 | 23,587 | 60,776 | 18,590 | 22.9% | 59.0% | 18.1% | . | 20,731 | 20.1% | 62,501 | 60.7% |
| Surrey Heath | 90,460 | 20,452 | 52,192 | 17,816 | 22.6% | 57.7% | 19.7% | . | 17,808 | 19.7% | 53,691 | 59.4% |
| Tandridge | 87,878 | 20,789 | 48,744 | 18,345 | 23.7% | 55.5% | 20.9% | . | 18,217 | 20.7% | 50,240 | 57.2% |
| Waverley | 128,231 | 30,856 | 69,369 | 28,006 | 24.1% | 54.1% | 21.8% | . | 26,393 | 20.6% | 71,868 | 56.0% |
| Woking | 103,940 | 25,061 | 61,671 | 17,208 | 24.1% | 59.3% | 16.6% | . | 22,178 | 21.3% | 63,384 | 61.0% |
Households and Household size
The total number of households in Surrey, established by the 2021 Census, was 481,818. This is an increase of 26,027 (5.7%) since the previous Census.
The imputed average Household size (mean average of residents per household) was 2.50 for Surrey – a higher value than for England as a whole. Amongst borough and district councils, average Household size varies from 2.35 in Mole Valley to 2.58 (Epsom and Ewell).
Surrey as a whole, and all local authorities, saw an increase in average Household size compared to the previous Census.
Table 4: Household numbers and average household size
| Area name | All usual residents 2021 | Number of households with at least one usual resident (2021) | Average Household size (people per household) |
| England | 56,490,045 | 23,436,085 | 2.41 |
| South East | 9,278,063 | 3,807,966 | 2.44 |
| Surrey | 1,203,111 | 481,818 | 2.50 |
| Elmbridge | 138,757 | 55,590 | 2.50 |
| Epsom and Ewell | 80,939 | 31,321 | 2.58 |
| Guildford | 143,646 | 55,760 | 2.58 |
| Mole Valley | 87,386 | 37,139 | 2.35 |
| Reigate and Banstead | 150,852 | 59,849 | 2.52 |
| Runnymede | 88,085 | 34,838 | 2.53 |
| Spelthorne | 102,953 | 41,805 | 2.46 |
| Surrey Heath | 90,460 | 36,008 | 2.51 |
| Tandridge | 87,878 | 35,623 | 2.47 |
| Waverley | 128,231 | 52,448 | 2.44 |
| Woking | 103,940 | 41,437 | 2.51 |
The raw data from this Census release has been processed by the Population Insight Team and is available here.