2011 Census – Housing
Headlines
- There has been a growth in households living in private rented accommodation since 2001 with a decrease in the proportion owning their own homes
- There has been an increase in the proportion of households living in flats, apartments and maisonettes since 2001 and a decrease in the proportion living in detached houses
- 29% of Surrey households live in homes with 4 or more bedrooms
- Overcrowding is more prevalent than in 2001 – nearly 7% of households have fewer rooms than they need
- Nearly all households now have central heating – less than 2% do not
Dwellings and household spaces
The 2011 Census recorded 473,154 dwellings in Surrey. Taking into account shared dwellings, this provided accommodation for 473,760 households. 3.8% of household spaces had no usual residents on Census night. This may be because there were only short term residents or visitors present, the household space is used as a second or holiday home or was vacant. The borough with the highest proportion of household spaces with no usual residents was Elmbridge (5.1%) and the lowest Epsom & Ewell (2.6%). The proportion was lower in Surrey than England as a whole, where 4.3% of household spaces had no usual residents.
Table 1: Dwellings and household spaces 2011
| All dwellings | All household spaces | With at least one usual resident | With no usual residents | % with no usual residents | |
| Surrey | 473,154 | 473,760 | 455,791 | 17,969 | 3.8% |
| Elmbridge | 55,731 | 55,774 | 52,922 | 2,852 | 5.1% |
| Epsom and Ewell | 30,538 | 30,580 | 29,784 | 796 | 2.6% |
| Guildford | 56,080 | 56,220 | 53,973 | 2,247 | 4.0% |
| Mole Valley | 36,971 | 36,989 | 35,828 | 1,161 | 3.1% |
| Reigate and Banstead | 57,053 | 57,150 | 55,423 | 1,727 | 3.0% |
| Runnymede | 34,246 | 34,316 | 32,714 | 1,602 | 4.7% |
| Spelthorne | 40,887 | 40,945 | 39,512 | 1,433 | 3.5% |
| Surrey Heath | 34,733 | 34,757 | 33,546 | 1,211 | 3.5% |
| Tandridge | 34,718 | 34,741 | 33,342 | 1,399 | 4.0% |
| Waverley | 51,545 | 51,597 | 49,280 | 2,317 | 4.5% |
| Woking | 40,652 | 40,691 | 39,467 | 1,224 | 3.0% |
| South East | 3,694,388 | 3,704,173 | 3,555,463 | 148,710 | 4.0% |
| England | 22,976,066 | 23,044,097 | 22,063,368 | 980,729 | 4.3% |
Source: Office for National Statistics
Tenure
The Census asked for information about the tenure of a household’s accommodation and if rented, information about the landlord.
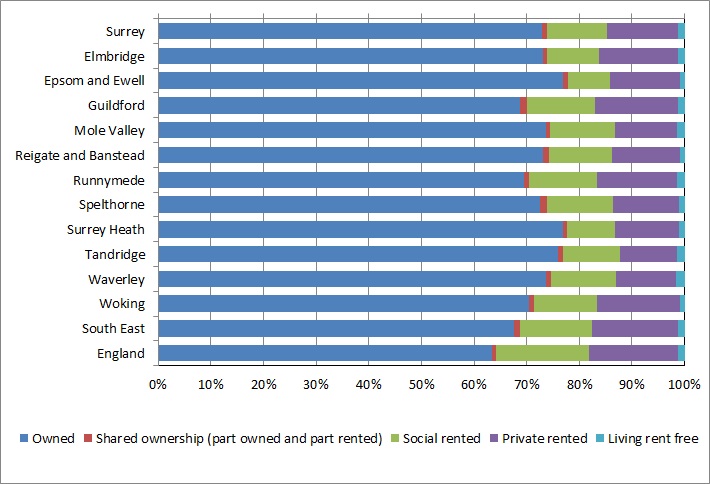
A large majority of Surrey households (73%) own their own home. More than a third (35%) own their home outright and a further 38% have a mortgage. The boroughs with the highest proportion of owner occupiers are Epsom & Ewell and Tandridge (77%) and the lowest are Runnymede and Guildford (69%). The proportion of owner occupiers in Surrey is greater than in England as whole where 63% of households own their own home.
13.5% of households live in private rented accommodation, including those renting from employers, relatives or friends. The boroughs with the highest proportion renting privately are Guildford (15.8%) and Woking (15.7%) and the lowest are Tandridge (11.0%) and Waverley (11.3%). The proportion of households renting privately in Surrey is lower than in England as a whole where 16.8% rent from a private landlord.
11.4% of households live in social rented accommodation (4.9% renting from the council and 6.5% from other social landlords such as a Housing Association). Note that individuals responding to the Census will report their understanding of their landlord and this may not reflect the actual management arrangements in all cases. The boroughs with the highest proportion in social rented accommodation Runnymede (12.9%) and Guildford (12.8%) and the lowest is Epsom & Ewell (8.0%). The proportion of households in social rented accommodation in Surrey is lower than in England as a whole where 17.7% rent from a social landlord.
A small number (1.0%) have shared ownership (part owned and part rented) and 1.2% of household live rent free.
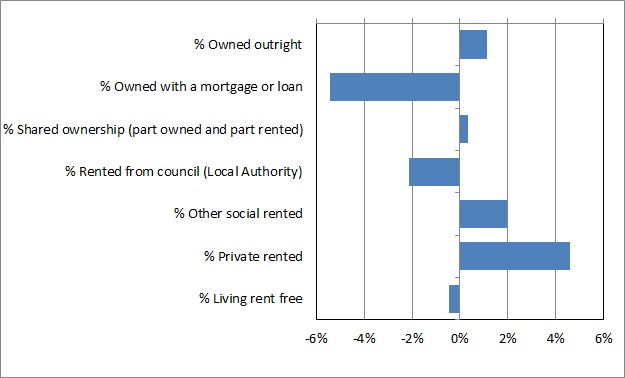
There has been a shift from owner occupation to private rented accommodation since 2001. In 2001, 77.2% of households were owner occupiers and 8.9% renting privately, compared with 72.9% and 13.5% in 2011. There was little change in the proportion of households in social rented accommodation, but there was a shift from renting from the council to other social landlords as local authorities transferred their housing stock to Private Registered Providers.
Table 2: Tenure of Surrey households, 2001 and 2011
| 2001 Census | 2011 Census | |
| Owned outright | 33.7% | 34.8% |
| Owned with a mortgage or loan | 43.5% | 38.1% |
| Shared ownership (part owned and part rented) | 0.7% | 1.0% |
| Rented from council (Local Authority) | 7.1% | 4.9% |
| Other social rented | 4.5% | 6.5% |
| Private rented | 8.9% | 13.5% |
| Living rent free | 1.7% | 1.2% |
Source: Office for National Statistics
Figure 1: Percentage point changes in tenure of Surrey households – 2001 to 2011
Source: Office for National Statistics
Table 3: Tenure by Local Authority 2011
| Owned outright | Owned with a mortgage or loan |
Shared ownership (part owned and part rented) |
Rented from council (Local Authority) |
Other social rented | Private rented | Living rent free | |
| Surrey | 34.8% | 38.1% | 1.0% | 4.9% | 6.5% | 13.5% | 1.2% |
| Elmbridge | 34.2% | 38.8% | 0.7% | 2.1% | 7.7% | 15.1% | 1.2% |
| Epsom and Ewell | 36.8% | 40.2% | 0.9% | 0.6% | 7.5% | 13.3% | 0.8% |
| Guildford | 33.7% | 35.1% | 1.3% | 9.1% | 3.7% | 15.8% | 1.3% |
| Mole Valley | 39.1% | 34.5% | 0.9% | 1.5% | 10.7% | 11.9% | 1.4% |
| Reigate and Banstead | 33.2% | 39.9% | 1.2% | 2.4% | 9.5% | 12.9% | 0.9% |
| Runnymede | 33.1% | 36.4% | 1.0% | 8.9% | 4.0% | 15.2% | 1.4% |
| Spelthorne | 33.9% | 38.6% | 1.4% | 1.6% | 10.8% | 12.7% | 1.0% |
| Surrey Heath | 34.8% | 42.0% | 0.8% | 1.2% | 8.0% | 12.1% | 1.0% |
| Tandridge | 36.2% | 39.7% | 0.9% | 7.7% | 3.1% | 11.0% | 1.4% |
| Waverley | 37.7% | 36.0% | 1.0% | 9.5% | 2.9% | 11.3% | 1.7% |
| Woking | 31.6% | 38.9% | 0.9% | 8.4% | 3.5% | 15.7% | 1.0% |
| South East | 32.5% | 35.1% | 1.1% | 5.8% | 7.9% | 16.3% | 1.3% |
| England | 30.6% | 32.8% | 0.8% | 9.4% | 8.3% | 16.8% | 1.3% |
Source: Office for National Statistics
Figure 2: Tenure by Local Authority 2011
Source: Office for National Statistics
Accommodation type
The Census asked what type of accommodation the household lives in.
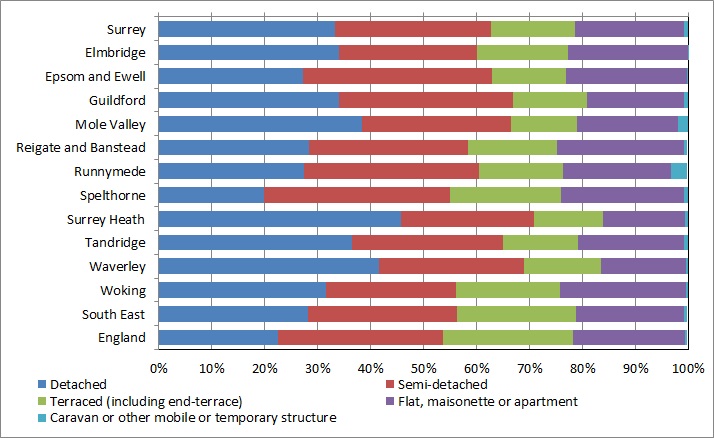
One third (33%) of Surrey households live in a detached house, 30% in a semi detached house and 16% in a terraced house. The borough with the highest proportion of detached houses is Surrey Heath (46%) and the lowest is Spelthorne (20%). The proportion of detached houses in Surrey is higher than in England as a whole where 22% of households live in a detached house. The proportion of households living in detached houses in Surrey has fallen since 2001 when 35% lived in this type of accommodation. The proportion of households living in semi-detached and terraced houses is unchanged since 2001.
More than one in five Surrey households (21%) lives in a flat, apartment or maisonette. This includes purpose built blocks of flats, converted or shared houses or accommodation in a commercial building for example, over a shop). The boroughs with the highest proportion of households living in a flat, apartment or maisonette are Reigate & Banstead and Woking (24%) and the lowest is Surrey Heath (15%). The proportion in Surrey is similar to England as a whole. The proportion of households living in a flat, apartment or maisonette has increased since 2001 when 18% lived in this type of accommodation.
A small number of Surrey’s households (1%) live in a caravan or other mobile or temporary structure.
Table 4: Accommodation type of Surrey households, 2001 and 2011
| 2001 Census | 2011 Census | |
| Detached | 35% | 33% |
| Semi-detached | 30% | 30% |
| Terraced (including end-terrace) | 16% | 16% |
| Flat, maisonette or apartment | 18% | 21% |
| Caravan or other mobile or temporary structure | 1% | 1% |
Source: Office for National Statistics
Table 5: Accommodation type by Local Authority 2011
| Detached | Semi-detached | Terraced (including end-terrace) |
Flat, maisonette or apartment |
Caravan or other mobile or temporary structure |
|
| Surrey | 33% | 30% | 16% | 21% | 1% |
| Elmbridge | 34% | 26% | 17% | 23% | 0% |
| Epsom and Ewell | 27% | 36% | 14% | 23% | 0% |
| Guildford | 34% | 33% | 14% | 18% | 1% |
| Mole Valley | 38% | 28% | 12% | 19% | 2% |
| Reigate and Banstead | 28% | 30% | 17% | 24% | 1% |
| Runnymede | 27% | 33% | 16% | 20% | 3% |
| Spelthorne | 20% | 35% | 21% | 23% | 1% |
| Surrey Heath | 46% | 25% | 13% | 15% | 1% |
| Tandridge | 36% | 28% | 14% | 20% | 1% |
| Waverley | 42% | 27% | 15% | 16% | 0% |
| Woking | 32% | 25% | 20% | 24% | 0% |
| South East | 28% | 28% | 23% | 20% | 1% |
| England | 22% | 31% | 24% | 21% | 0% |
Source: Office for National Statistics
Figure 3: Accommodation by Local Authority 2011
Source: Office for National Statistics
Bedrooms
For the first time, the census asked households to state how many bedrooms were available in their accommodation. This included all rooms built or converted for use as bedrooms, even if they are not currently used as bedrooms.
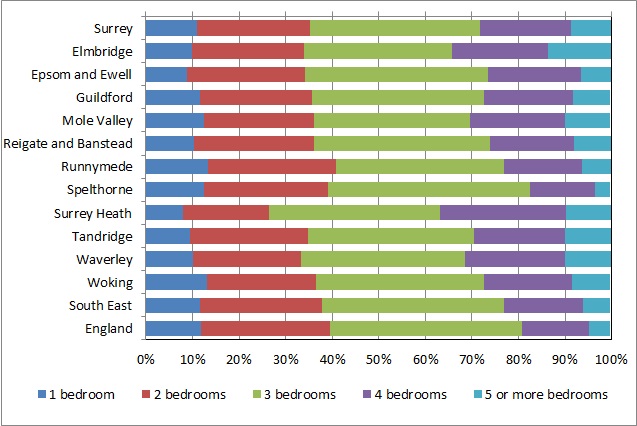
More than a third of Surrey households (36%) live in a 3 bedroom home, 20% have 4 bedrooms and 9% have 5 or more bedrooms. The borough with the highest proportion of 5+ bedroom homes is Elmbridge (14%) and the lowest is Spelthorne (3%).The proportion of households living in larger homes is higher in Surrey than England as a whole where 19% have 4 or more bedrooms compared with the Surrey figure of 29%.
Nearly a quarter of households (24%) live in a 2 bedroom home and 11% have only one bedroom. The borough with the highest proportion of smaller homes is Runnymede where 13% have one bedroom and 27% have 2 bedrooms and the lowest is Surrey Heath (8% one bedroom and 27% two bedroom). The proportion of smaller homes is lower in Surrey than in England as a whole where 40% have one or two bedrooms, compared with 35% in Surrey.
Table 6: Number of bedrooms by Local Authority 2011
| 1 bedroom | 2 bedrooms | 3 bedrooms | 4 bedrooms | 5 or more bedrooms | |
| Surrey | 11% | 24% | 36% | 20% | 9% |
| Elmbridge | 10% | 24% | 32% | 21% | 14% |
| Epsom and Ewell | 9% | 25% | 39% | 20% | 6% |
| Guildford | 12% | 24% | 37% | 19% | 8% |
| Mole Valley | 13% | 23% | 34% | 20% | 10% |
| Reigate and Banstead | 10% | 26% | 38% | 18% | 8% |
| Runnymede | 13% | 27% | 36% | 17% | 6% |
| Spelthorne | 12% | 27% | 43% | 14% | 3% |
| Surrey Heath | 8% | 19% | 37% | 27% | 10% |
| Tandridge | 10% | 25% | 36% | 20% | 10% |
| Waverley | 10% | 23% | 35% | 21% | 10% |
| Woking | 13% | 24% | 36% | 19% | 8% |
| South East | 12% | 26% | 39% | 17% | 6% |
| England | 12% | 28% | 41% | 14% | 5% |
Source: Office for National Statistics
Figure 4: Number of bedrooms by Local Authority 2011
Source: Office for National Statistics
Occupancy and overcrowding
Occupancy rating provides a measure of whether a household’s accommodation is overcrowded or under occupied. The ages of the household members and their relationships to each other are used to derive the number of rooms they require, based on a standard formula. The number of rooms required is subtracted from the number of rooms in the household’s accommodation to obtain the occupancy rating. An occupancy rating of -1 implies that a household has one fewer room than required and is thus overcrowded, whereas +1 implies that they have one more room than the standard requirement.
Most households in Surrey have an adequate number of rooms for their needs. 57% have at least 2 rooms more than they require and 20% have one room more than they require. 16% have exactly the required number of rooms. However 5.3% have one room too few and 1.4% have at least 2 rooms too few. The boroughs with the highest proportion of households living in overcrowded conditions are Spelthorne (9%) and Woking (8.9%) and the lowest is Waverley (4.7%). The proportion of households living in overcrowded conditions is lower in Surrey than in England as a whole where 8.7% of households have at least one room too few for their needs.
The proportion of households living in overcrowded conditions has increased since 2001 when 5.5% of Surrey households had one or more rooms too few. There has been an increase in all districts and boroughs in Surrey, notably Woking , Runnymede and Spelthorne where there has been an increase of more than 2 percentage points.
Table 7: Occupancy rating by Local Authority 2011
| +2 or more | +1 | 0 | -1 | -2 or less | |
| Surrey | 57% | 20% | 16% | 5.3% | 1.4% |
| Elmbridge | 60% | 19% | 15% | 4.9% | 1.2% |
| Epsom and Ewell | 57% | 21% | 16% | 5.3% | 1.5% |
| Guildford | 56% | 19% | 17% | 5.6% | 1.5% |
| Mole Valley | 60% | 18% | 15% | 5.2% | 1.4% |
| Reigate and Banstead | 56% | 21% | 17% | 5.3% | 1.3% |
| Runnymede | 51% | 22% | 19% | 6.5% | 1.8% |
| Spelthorne | 48% | 24% | 19% | 6.9% | 2.1% |
| Surrey Heath | 65% | 17% | 13% | 4.1% | 1.0% |
| Tandridge | 60% | 19% | 15% | 4.5% | 1.0% |
| Waverley | 63% | 18% | 14% | 3.7% | 1.0% |
| Woking | 52% | 20% | 19% | 6.8% | 2.1% |
| South East | 53% | 22% | 18% | 5.8% | 1.7% |
| England | 50% | 23% | 19% | 6.4% | 2.3% |
Source: Office for National Statistics
Table 8: Households with occupancy rating of -1 or less, 2001 and 2011 by Local Authority
| 2001 Census | 2011 Census | |
| Surrey | 5.5% | 6.8% |
| Elmbridge | 5.0% | 6.0% |
| Epsom and Ewell | 5.2% | 6.8% |
| Guildford | 6.2% | 7.2% |
| Mole Valley | 5.4% | 6.6% |
| Reigate and Banstead | 5.5% | 6.6% |
| Runnymede | 6.1% | 8.3% |
| Spelthorne | 6.5% | 9.0% |
| Surrey Heath | 3.9% | 5.0% |
| Tandridge | 4.7% | 5.5% |
| Waverley | 4.6% | 4.7% |
| Woking | 6.8% | 8.9% |
| South East | 5.9% | 7.5% |
| England | 7.1% | 8.7% |
Source: Office for National Statistics
Figure 5: Surrey Households with occupancy rating of -1 or less, 2001 and 2011 by Local Authority
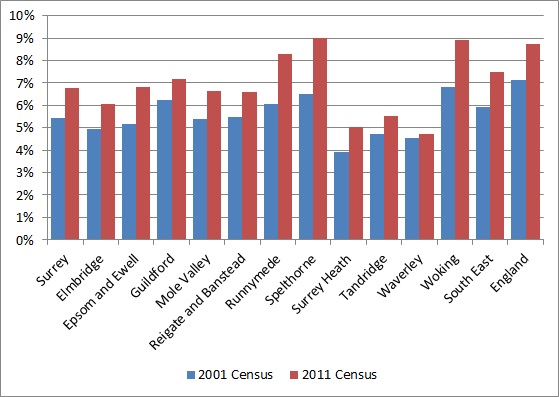
Source: Office for National Statistics
Central Heating
By 2011 only 1.6% of Surrey households had no central heating. This is a decrease since 2001 when 3.8% had no central heating. In all boroughs except Woking the proportion of households without central heating had at least halved since 2001. The borough with the highest proportion of households with no central heating is Woking (2.3%) and the lowest is Surrey Heath (1.0%). The proportion of households with no central heating is lower in Surrey than in England as a whole where 2.7% are without central heating.
Table 9: Households with no central heating, 2001 and 2011 by Local Authority
| 2001 Census | 2011 Census | |
| Surrey | 3.8% | 1.6% |
| Elmbridge | 3.2% | 1.4% |
| Epsom and Ewell | 4.0% | 1.7% |
| Guildford | 3.6% | 1.7% |
| Mole Valley | 4.2% | 1.8% |
| Reigate and Banstead | 3.5% | 1.4% |
| Runnymede | 6.4% | 2.0% |
| Spelthorne | 4.2% | 2.0% |
| Surrey Heath | 2.5% | 1.0% |
| Tandridge | 4.3% | 1.7% |
| Waverley | 2.8% | 1.2% |
| Woking | 3.7% | 2.3% |
| South East | 6.1% | 2.4% |
| England | 8.5% | 2.7% |
Source: Office for National Statistics
Figure 6: Households with no central heating, 2001 and 2011 by Local Authority
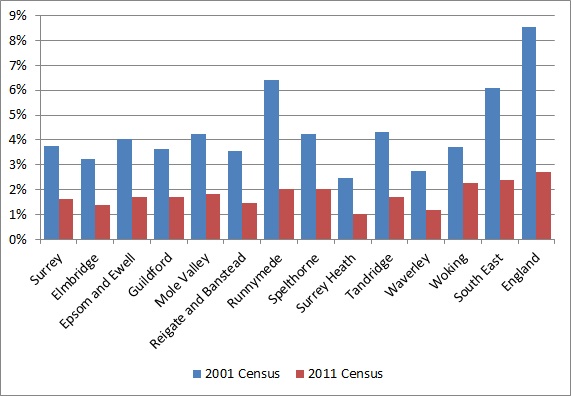
Source: Office for National Statistics