Census 2021: Country of Birth, Nationality, and Migration
Estimates of Country of Birth, Nationality, and Migration from the 2021 Census
Headlines
- In 2021, 17.9 per cent of Surrey residents were born outside of the UK (an increase of 26% since 2011).
- India, South Africa, and Poland were the places of birth for the greatest number of Surrey residents in 2021 who were born outside of the UK.
- Over one in twenty (6.2%) of Surrey residents held an EU passport, including those from the Republic of Ireland.
- Over a third of Surrey residents born outside of the UK arrived in the UK between 2011 and 2021 (37.9%).
The raw data from this Census release has been processed by the Population Insight Team and is also available on Surrey-i.
Contents
Country of birth
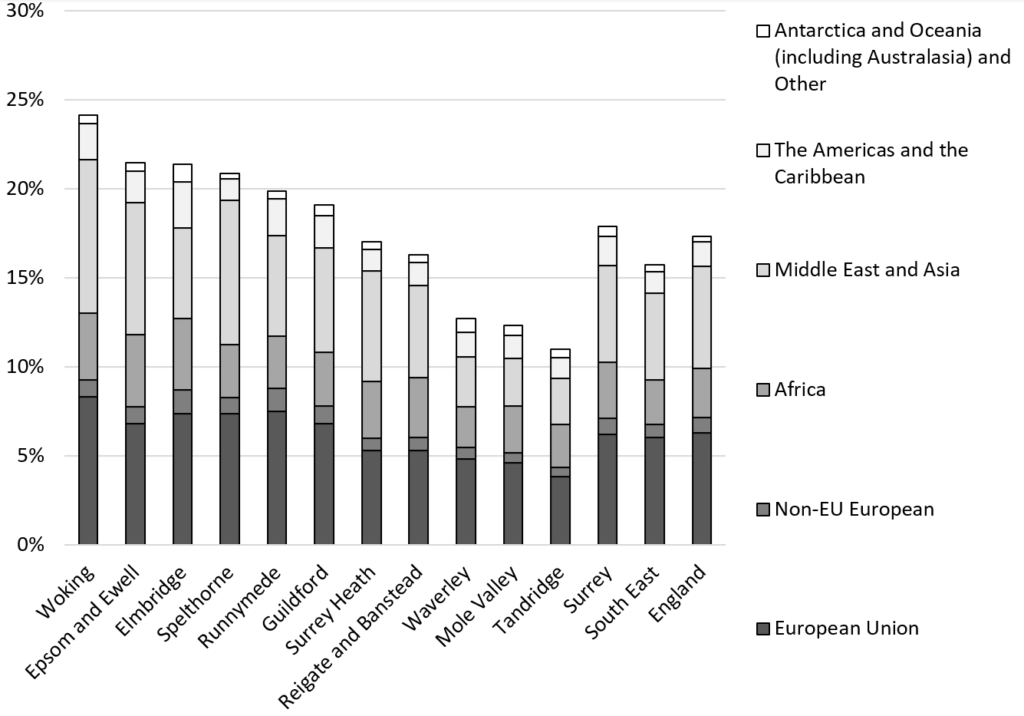
In 2021, 17.9 per cent of Surrey residents were born outside of the UK. This represents a 26 per cent increase since 2011 when 14.2 per cent of Surrey residents were born outside of the UK. Residents born in the European Union made up 6.2 per cent of the Surrey population in 2021 (4.8% in 2011). Surrey residents born in the Middle East and Asia made up the second largest non-UK born group at 5.4 per cent of the population. Residents who were born in Africa made up the third largest non-UK born group at 3.2 per cent of Surrey residents.
Surrey had a slightly larger proportion of residents born outside of the UK compared to the South East (15.8%) but a similar proportion to England as a whole (17.4%).
Country of birth, 2021
| Local authority | United Kingdom | Republic of Ireland | EU (minus ROI) | Non-EU European | Africa | Middle East and Asia | The Americas and the Caribbean | Antarctica and Oceania (including Australasia) and Other |
|---|---|---|---|---|---|---|---|---|
| Surrey | 82.1% | 0.7% | 5.5% | 0.9% | 3.2% | 5.4% | 1.6% | 0.6% |
| Elmbridge | 78.6% | 1.0% | 6.3% | 1.3% | 4.0% | 5.1% | 2.6% | 1.0% |
| Epsom and Ewell | 78.5% | 0.9% | 5.9% | 1.0% | 4.1% | 7.4% | 1.8% | 0.5% |
| Guildford | 80.9% | 0.6% | 6.3% | 1.0% | 3.0% | 5.9% | 1.8% | 0.6% |
| Mole Valley | 87.6% | 0.7% | 3.9% | 0.6% | 2.6% | 2.7% | 1.3% | 0.6% |
| Reigate and Banstead | 83.7% | 0.7% | 4.6% | 0.7% | 3.3% | 5.2% | 1.3% | 0.4% |
| Runnymede | 80.1% | 0.8% | 6.7% | 1.3% | 2.9% | 5.7% | 2.1% | 0.4% |
| Spelthorne | 79.1% | 0.9% | 6.5% | 0.9% | 3.0% | 8.1% | 1.2% | 0.3% |
| Surrey Heath | 82.9% | 0.7% | 4.6% | 0.7% | 3.2% | 6.2% | 1.2% | 0.4% |
| Tandridge | 89.0% | 0.7% | 3.1% | 0.6% | 2.4% | 2.6% | 1.2% | 0.5% |
| Waverley | 87.3% | 0.6% | 4.2% | 0.7% | 2.3% | 2.8% | 1.4% | 0.8% |
| Woking | 75.8% | 0.7% | 7.6% | 1.0% | 3.7% | 8.6% | 2.0% | 0.5% |
| South East | 84.2% | 0.6% | 5.5% | 0.7% | 2.5% | 4.9% | 1.2% | 0.4% |
| England | 82.6% | 0.6% | 5.7% | 0.9% | 2.8% | 5.7% | 1.4% | 0.3% |
Of the districts and boroughs in Surrey, Woking had the highest proportion of non-UK born residents in 2021 at 24.2 percent; 8.6 per cent of Woking residents were born in the Middle East and Asia, 8.3 per cent were born in the European Union, and 3.7 per cent were born in Africa. Tandridge had the lowest proportion of non-UK born residents at 11.0 per cent.
The distribution of residents by country of birth, 2021
The percentage of Surrey residents born outside of the UK has continued to grow from 10.6 per cent in 2001, 14.3 per cent in 2011, to 17.9 per cent in 2021.
Country of birth of Surrey residents 2001, 2011, and 2021
| Birth location | 2001 | 2011 | 2021 |
|---|---|---|---|
| Born in UK | 89.4% | 85.8% | 82.1% |
| Republic of Ireland | 1.0% | 0.9% | 0.7% |
| EU Member countries (excl. ROI) | 2.4% | 3.9% | 5.5% |
| Other Countries | 7.2% | 9.5% | 11.7% |
India was the place of birth for the greatest number of Surrey residents in 2021 who were born outside of the UK in (17,607 residents). Of the top ten countries of birth for non-UK born Surrey residents, nine of the ten countries were in the top ten for both 2011 and 2021. Romania is the only country which was in the top ten in 2021 (5th highest at 8,082 residents) but was not in the top ten in 2011, suggesting more recent settlements of Romanian-born residents.
Top 10 countries of birth of Surrey residents (excluding UK), 2021
| Rank (2021) | Country | Percent % | Count | Rank (2011) |
|---|---|---|---|---|
| 1 | India | 1.5% | 17,607 | 2 |
| 2 | South Africa | 1.4% | 16,382 | 1 |
| 3 | Poland | 0.9% | 11,225 | 4 |
| 4 | Republic of Ireland | 0.7% | 8,942 | 3 |
| 5 | Romania | 0.7% | 8,082 | 23 |
| 6 | Pakistan | 0.6% | 7,687 | 7 |
| 7 | United States | 0.6% | 6,638 | 5 |
| 8 | Germany | 0.5% | 6,333 | 6 |
| 9 | Italy | 0.5% | 5,831 | 8 |
| 10 | Philippines | 0.4% | 5,117 | 9 |
Age of arrival in the UK
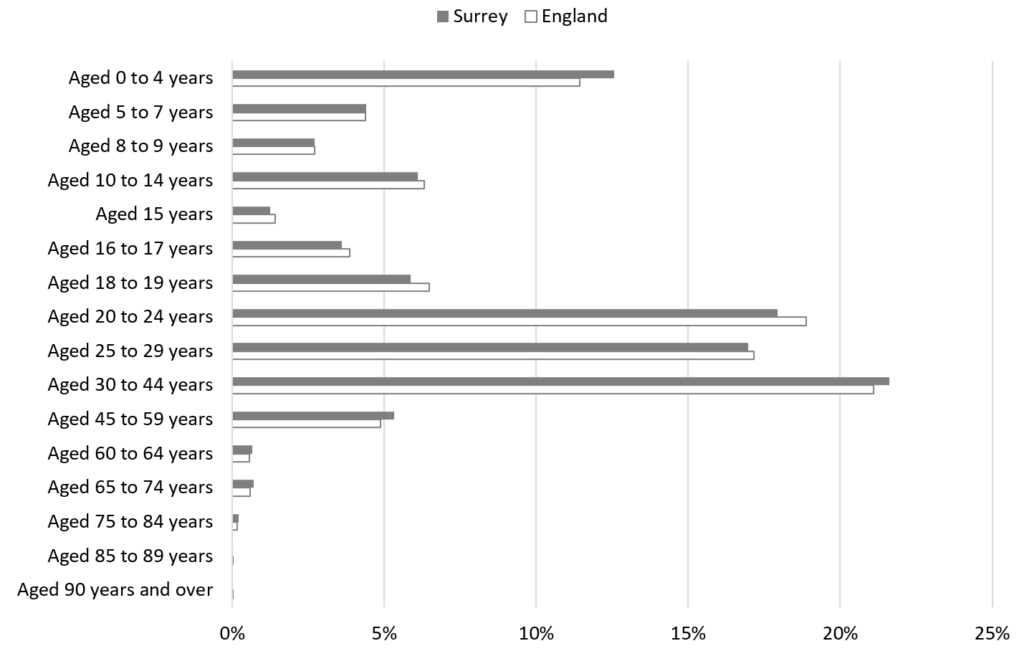
The majority of non-UK born residents (57%) arrived between the ages of 20 and 44 in both Surrey and England. However, in Surrey, non-UK born residents are slightly more likely to have arrived in the UK over the age of 29 or between the ages of 0 and 4 than in England as a whole.
Age of arrival in the UK in Surrey and England
Nationality
The 2021 Census asked for information about passports held. Some people may hold two or more passports; these may be from non-EU countries, EU countries or a combination of both. Accordingly, the numbers of passports held by the resident population will exceed the number of passport holders.
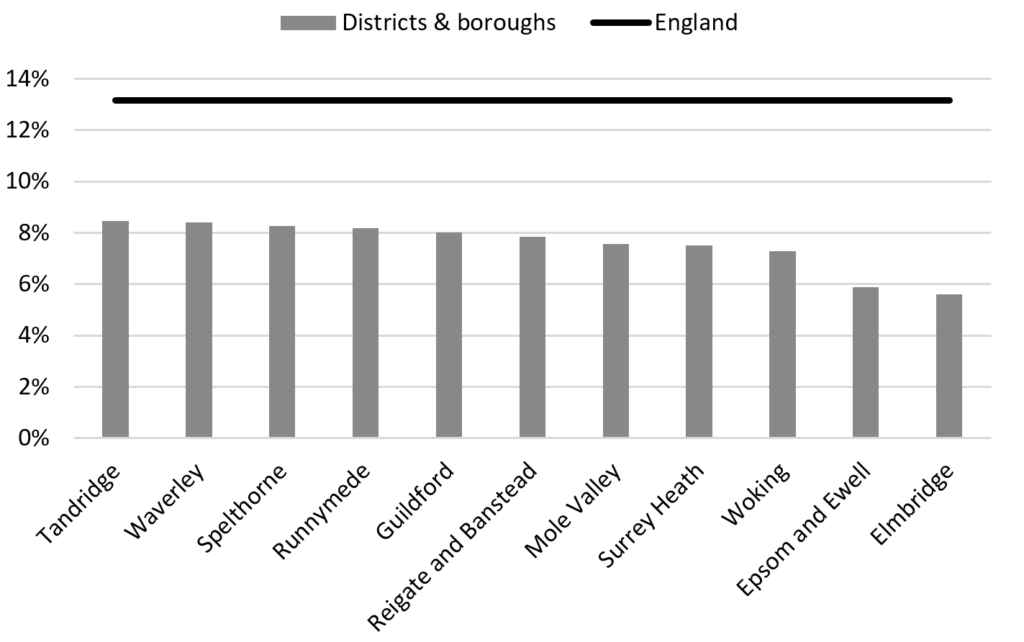
Before looking into the types of passports held, it is important to note that 7.5 per cent of Surrey residents did not have a passport on the 2021 Census Day. This may be because they have never held one or their UK passport has expired. Every Surrey district and borough had a lower proportion of residents without a passport than the England average of 13.2 per cent. Elmbridge had the highest percentage of residents with a passport on Census Day at 94.4 per cent and Tandridge had the lowest at 91.5 per cent.
The percentage of Surrey residents without a passport at the time of the 2021 Census
Of Surrey residents, 3.6 per cent held a non-UK or -EU passport which is much lower than the 11.7 per cent of residents who were born outside of the UK and the European Union. This suggests that a large proportion of people who were born outside the EU acquired British or other EU citizenship and hold a British or EU passport. However, some people born abroad will be UK citizens because their parents were UK citizens overseas at the time of their birth.
Over one in twenty (6.2%) of Surrey residents held an EU passport, including those from the Republic of Ireland, which corresponds to 6.2 per cent of Surrey residents who were born in a country now part of the European Union.
Passports held by Surrey residents in 2021
| Local authority | No passport | United Kingdom | Republic of Ireland | EU countries (excl. ROI) | Non-EU countries |
|---|---|---|---|---|---|
| Surrey | 7.5% | 82.7% | 0.9% | 5.3% | 3.6% |
| Elmbridge | 5.6% | 82.8% | 1.4% | 6.1% | 4.2% |
| Epsom and Ewell | 5.9% | 83.1% | 1.1% | 6.2% | 3.8% |
| Guildford | 8.0% | 80.7% | 0.7% | 6.0% | 4.6% |
| Mole Valley | 7.6% | 86.2% | 0.8% | 3.5% | 1.9% |
| Reigate and Banstead | 7.9% | 83.2% | 0.9% | 4.4% | 3.6% |
| Runnymede | 8.2% | 79.3% | 0.9% | 6.8% | 4.7% |
| Spelthorne | 8.3% | 79.7% | 1.0% | 6.9% | 4.1% |
| Surrey Heath | 7.5% | 84.5% | 0.7% | 4.1% | 3.2% |
| Tandridge | 8.5% | 86.4% | 0.8% | 2.6% | 1.7% |
| Waverley | 8.4% | 85.2% | 0.7% | 3.5% | 2.2% |
| Woking | 7.3% | 78.9% | 0.8% | 8.1% | 5.0% |
| South East | – | 79.6% | 0.6% | 5.3% | 3.2% |
| England | 13.2% | 76.6% | 0.6% | 6.1% | 3.5% |
Year of arrival in the UK
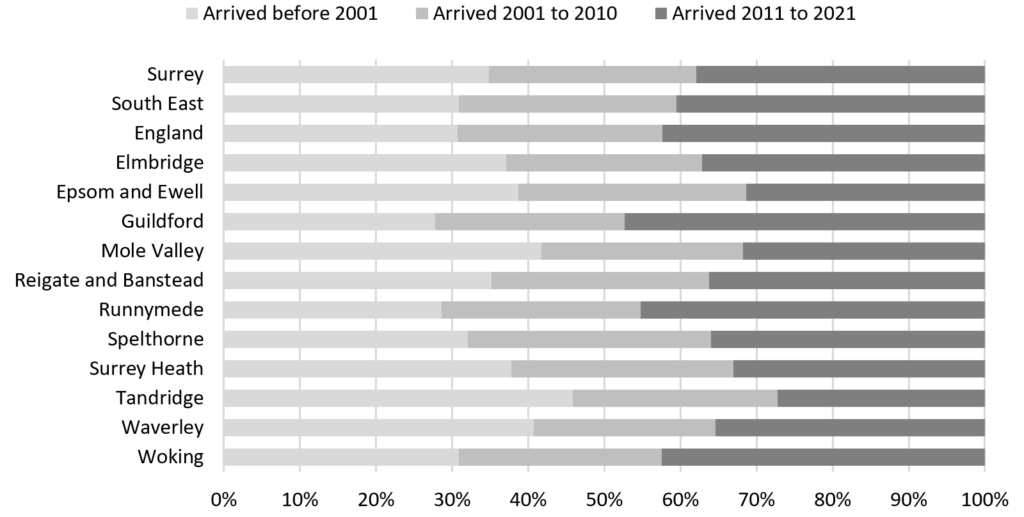
Of Surrey residents born outside of the UK, over a third arrived in the UK between 2011 and 2021 (37.9%), which represented 81,732 residents. A lower proportion of non-UK born Surrey residents arrived in the last ten years compared to within the South East (40.5%) and England (42.4%).
Guildford had the highest proportion of non-UK born residents who arrived between 2011 and 2021 at 47.4 per cent, compared to Tandridge which had the lowest proportion in Surrey at 27.3 per cent.
Year of arrival in the UK of non-UK born residents of Surrey, 2021
| Local authority | Arrived before 1991 | Arrived 1991 to 2000 | Arrived 2001 to 2010 | Arrived 2011 to 2021 |
|---|---|---|---|---|
| Surrey | 22.9% | 11.9% | 27.3% | 37.9% |
| Elmbridge | 23.7% | 13.4% | 25.7% | 37.2% |
| Epsom and Ewell | 25.4% | 13.3% | 29.9% | 31.4% |
| Guildford | 17.4% | 10.4% | 24.8% | 47.4% |
| Mole Valley | 28.7% | 13.0% | 26.5% | 31.8% |
| Reigate and Banstead | 22.9% | 12.2% | 28.6% | 36.3% |
| Runnymede | 18.6% | 10.0% | 26.2% | 45.2% |
| Spelthorne | 20.7% | 11.4% | 32.0% | 36.0% |
| Surrey Heath | 25.2% | 12.6% | 29.3% | 33.0% |
| Tandridge | 31.9% | 14.0% | 26.9% | 27.3% |
| Waverley | 29.0% | 11.7% | 23.9% | 35.4% |
| Woking | 19.9% | 10.9% | 26.7% | 42.4% |
| South East | 20.5% | 10.4% | 28.6% | 40.5% |
| England | 19.8% | 10.9% | 26.9% | 42.4% |
The distribution of the year of arrival in the UK of non-UK born residents of Surrey, 2011