2011 Census – Car availability
Headlines
- There are 687,000 cars available to Surrey’s households – an average of more than 1.5 per household
- 13% of households living in Surrey have no car
- The level of car ownership in Surrey is much higher than nationally where more than a quarter of households have no car
- Car ownership levels in Surrey have increased since 2001.
The census asked households to state how many cars or vans are available for use by members of the household, including company cars which are available for private use. Cars owned by people living in communal establishments are not counted by the census and are therefore not included in this analysis.
Car availability 2011
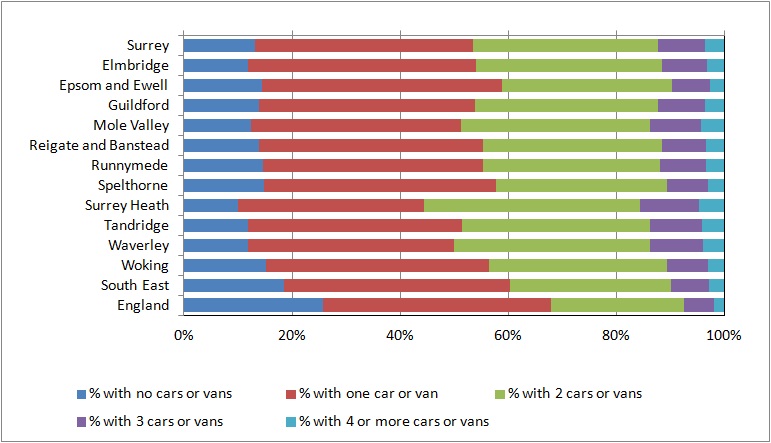
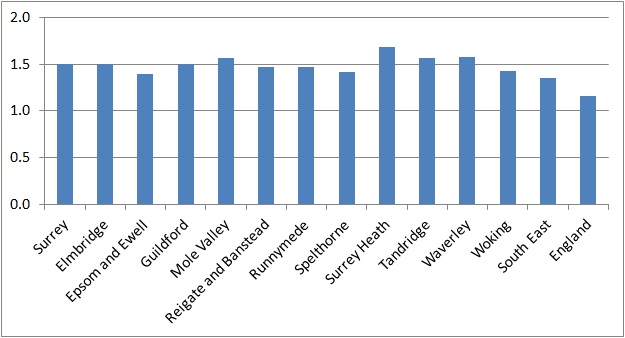
There are 687,000 cars available to Surrey households. 13% of households have no car available to them while 46.4% have 2 or more cars. There is an average of 1.51 cars per household. The borough with the highest levels of car ownership is Surrey Heath where there are 1.68 cars per household and only 10% of households have no car while 55.6% have 2 or more. Epsom and Ewell has the lowest average number of cars per household (1.40) and the lowest proportion of households with 2 or more cars (41.2%) and Woking has the highest proportion of households with no car (15.2%)
Car ownership levels in Surrey are considerably higher than in England as a whole, where 25.8% of households have no car available to them and only 32% have 2 or more. Nationally there is an average of 1.16 cars per household.
Table 1: Car availability 2011
| % of households with no cars or vans | % of households with one car or van | % of households with 2 or more cars or vans | Average number of cars per household | |
| Surrey | 13.1% | 40.4% | 46.4% | 1.51 |
| Elmbridge | 11.8% | 42.4% | 45.9% | 1.50 |
| Epsom and Ewell | 14.4% | 44.4% | 41.2% | 1.40 |
| Guildford | 13.9% | 40.0% | 46.2% | 1.50 |
| Mole Valley | 12.3% | 39.0% | 48.7% | 1.57 |
| Reigate and Banstead | 13.8% | 41.5% | 44.7% | 1.47 |
| Runnymede | 14.7% | 40.7% | 44.6% | 1.47 |
| Spelthorne | 14.8% | 42.9% | 42.3% | 1.42 |
| Surrey Heath | 10.0% | 34.5% | 55.6% | 1.68 |
| Tandridge | 11.8% | 39.7% | 48.5% | 1.57 |
| Waverley | 11.9% | 38.1% | 50.0% | 1.58 |
| Woking | 15.2% | 41.2% | 43.6% | 1.43 |
| South East | 18.6% | 41.7% | 39.7% | 1.35 |
| England | 25.8% | 42.2% | 32.0% | 1.16 |
Source: Office for National Statistics
Figure 1: Car availability 2011 – households
Source: Office for National Statistics
Figure 2: Average cars per household 2011
Source: Office for National Statistics
Changes since 2001
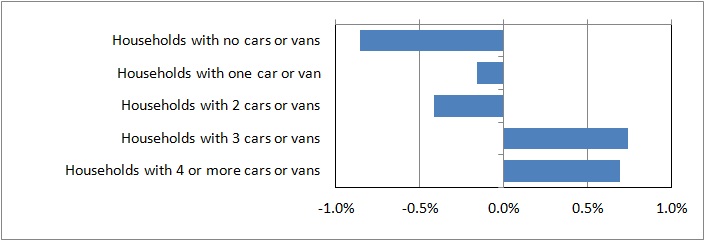
Car ownership levels in Surrey have risen since the 2001 Census. The number of cars available to Surrey households has increased by 53,330 (8.4%). The proportion of households without a car or with 1 or 2 cars has fallen, while the proportion with 3 cars or 4 or more has increased. The average number of cars per household has increased from 1.46 to 1.51
Table 2: Car availability 2001 and 2011
| 2001 Census | 2011 Census | |
| Households with no cars or vans | 14.0% | 13.1% |
| Households with one car or van | 40.6% | 40.4% |
| Households with 2 cars or vans | 34.6% | 34.2% |
| Households with 3 cars or vans | 8.0% | 8.7% |
| Households with 4 or more cars or vans | 2.9% | 3.5% |
| Average number of cars per household | 1.46 | 1.51 |
Source: Office for National Statistics
Figure 3: Percentage point change in car availability since 2001
Source: Office for National Statistics