2011 Census – Economic activity
Headlines
- Economic activity rates have increased since 2001, especially for women (68% in 2011 compared with 63% in 2001)
- 39% of women in employment work part time compared with 9% of men
- More than 100,000 Surrey residents are self employed
- Unemployment rates are lower than the national average (2.8% of people aged 16-74 compared with 4.4%)
Economically Active
The total number of economically active people aged 16-74 (employees, the self employed, the unemployed and working students) in Surrey in 2011 was 601,791, compared with 547,635 in 2001. This is an increase of 54,156 or 9.9% since 2001. Economic activity rates for men in Surrey at 79.8% remained almost unchanged compared with 2001 (79.4%). Whereas the 67.7% rate for the women was higher than in 2001 (63.3%).
Surrey economic activity rates were higher than in England (75.2% of men and 64.7% of women) and higher than rates for the South East region (77.6% and 66.7% respectively).The boroughs with the highest percentage of economically active people were the same as in 2001, all showing in 2011 a small increase: Spelthorne (75.5%), Woking (75.4%), Reigate & Banstead (75.2%) and Surrey Heath (75.1%).
The greatest numerical increase in the resident workforce between 2001 and 2011 were in Reigate & Banstead (+8,740), Elmbridge (+6,928) and Woking (+6,480). The largest percentage increase was in Epsom and Ewell (16.5%). The number of economically active residents increased in all the Surrey boroughs.
Table 1: Economic activity rates for population aged 16-74
| % economically active | Males – % economically active |
Females – % economically active |
|
| Surrey | 73.6 | 79.8 | 67.7 |
| Elmbridge | 73.4 | 81.4 | 65.9 |
| Epsom and Ewell | 73.6 | 79.6 | 67.9 |
| Guildford | 72.2 | 77.8 | 66.6 |
| Mole Valley | 72.7 | 78.7 | 66.8 |
| Reigate and Banstead | 75.2 | 80.7 | 69.9 |
| Runnymede | 71.6 | 77.3 | 66.2 |
| Spelthorne | 75.5 | 80.6 | 70.4 |
| Surrey Heath | 75.2 | 80.6 | 69.6 |
| Tandridge | 73.5 | 79.3 | 67.9 |
| Waverley | 72.0 | 78.7 | 65.6 |
| Woking | 75.4 | 82.3 | 68.4 |
| South East | 72.1 | 77.6 | 66.7 |
| England | 69.9 | 75.2 | 64.7 |
Source: Census – Office for National Statistics
Figure 1: Percentage of people aged 16-74 economically active – 2001 and 2011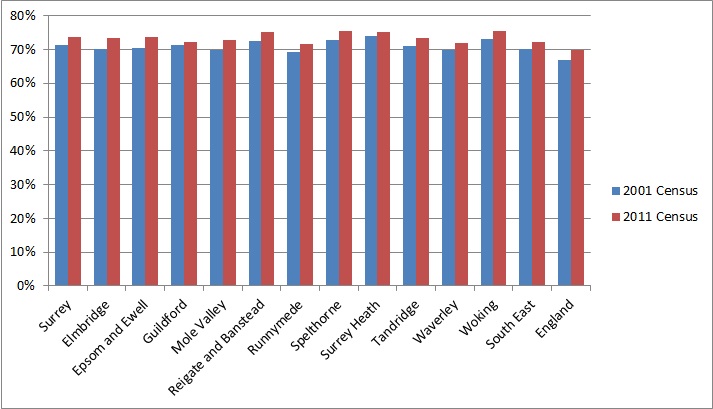
Source: Office for National Statistics
Figure 2: Percentage of people aged 16-74 economically active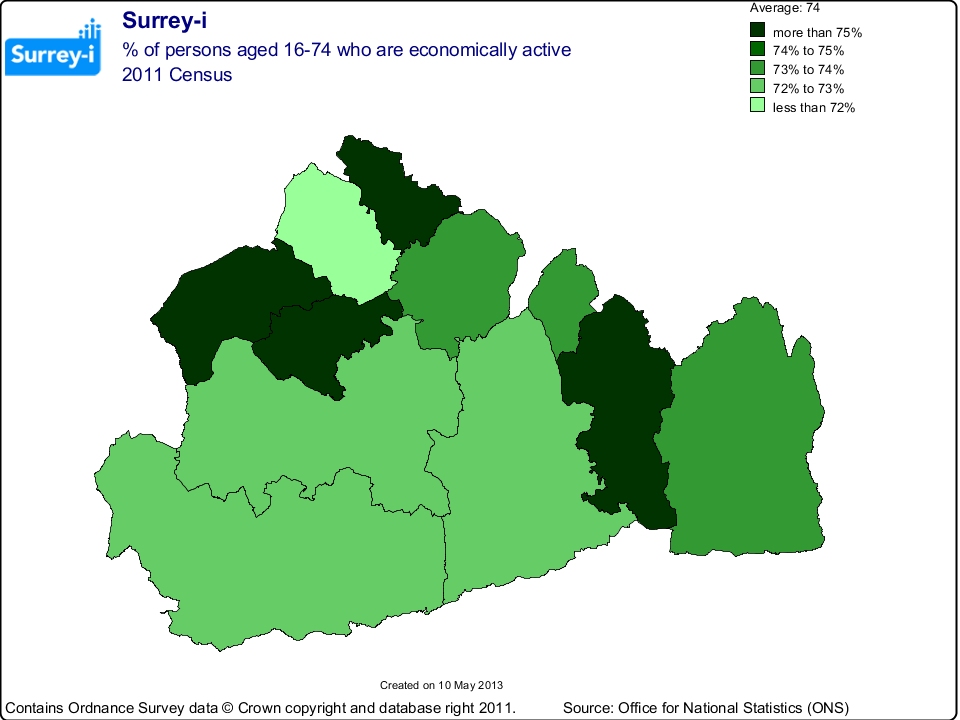
Figure 3: Economically active population by economic status 2011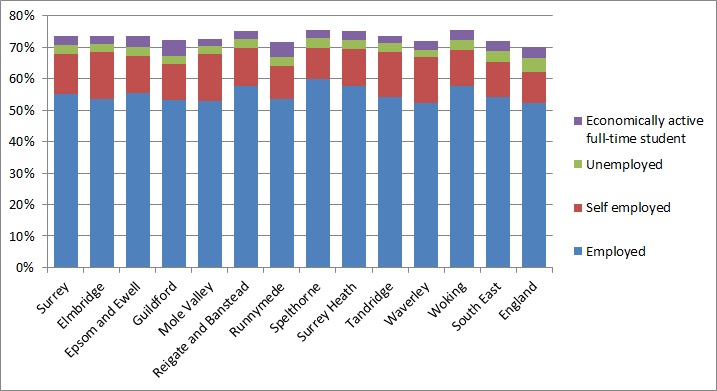
Source: Office for National Statistics
Full time and part time employment
42.2% of Surrey residents aged 16-74 (344,923 people) were in full time employment in 2011, compared with 341,270 or 44.4% in 2001. This level of full time working was higher than the England average of 38.6% of residents. There were particular concentrations of full time working among residents living in the Boroughs of Spelthorne (46.5%) and Woking (45%).
The proportion of Surrey residents aged 16-74 who were working part time was 13%. This is very similar to the England and South East rates of part time workers and higher than the 2001 rate of 11.6%
39% of the women in employment worked part time, while only 9% of the male worked part time
Table 2: Percentage of males and females aged 16-74 in full time and part time employment
| Females – % Employed part-time |
Females – % Employed full-time |
Males – % Employed part-time |
Males – % Employed full-time |
|
| Surrey | 21.0 | 33.1 | 4.8 | 51.6 |
| Elmbridge | 19.0 | 32.2 | 4.3 | 52.0 |
| Epsom and Ewell | 21.7 | 33.2 | 5.2 | 51.1 |
| Guildford | 19.8 | 31.7 | 4.5 | 50.5 |
| Mole Valley | 22.6 | 30.1 | 4.9 | 48.5 |
| Reigate and Banstead | 21.9 | 35.6 | 5.0 | 52.5 |
| Runnymede | 19.1 | 33.1 | 4.8 | 49.9 |
| Spelthorne | 21.4 | 37.7 | 5.0 | 55.3 |
| Surrey Heath | 22.1 | 34.4 | 5.1 | 53.9 |
| Tandridge | 21.8 | 32.6 | 4.9 | 49.2 |
| Waverley | 22.1 | 28.4 | 4.8 | 49.1 |
| Woking | 20.1 | 35.4 | 5.0 | 54.7 |
| South East | 22.0 | 31.6 | 5.5 | 49.5 |
| England | 21.2 | 30.6 | 6.1 | 46.8 |
Source: Census – Office for National Statistics
Figure 4: Percentage of male and female in employment working full-time and part-time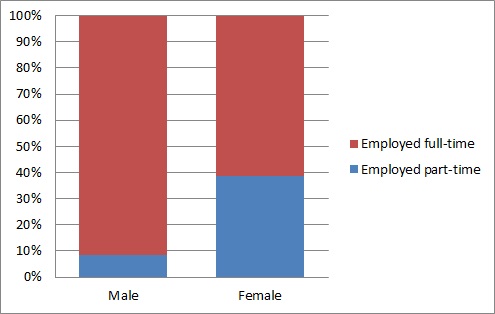
Source: Office for National Statistics
Figure 5: Percentage of people aged 16-74 employed full-time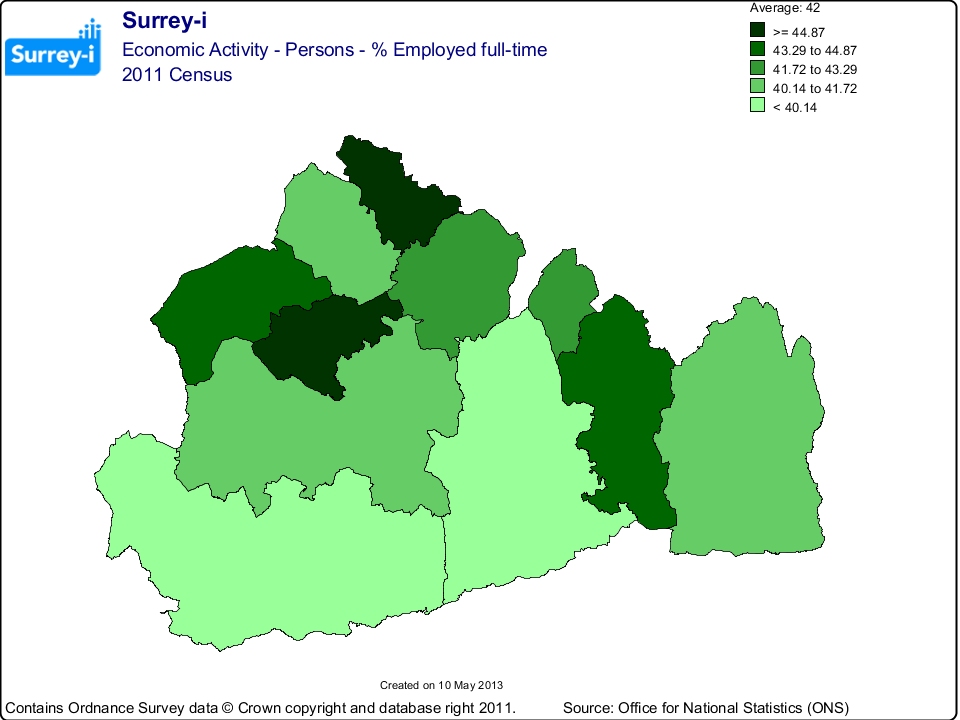
The self employed
Surrey has a relatively large proportion of self employed residents (102,486 or 12.5% of all aged 16-74) compared with 9.8% in England and 11% in the S.E. Region. This was 17,936 (21.2%) more self employed in Surrey than in 2001.
There were particular concentrations of self employed in the districts of Elmbridge and Mole Valley (both 14.7%) and Waverley (14.5%).
Table 3: Percentage of people aged 16-74 who are self employed
| Persons – % self employed |
Males – % self employed |
Females – % self employed |
|
| Surrey | 12.5 | 17.2 | 8.0 |
| Elmbridge | 14.7 | 19.6 | 10.2 |
| Epsom and Ewell | 11.7 | 17.1 | 6.7 |
| Guildford | 11.3 | 15.0 | 7.6 |
| Mole Valley | 14.7 | 20.0 | 9.5 |
| Reigate and Banstead | 12.3 | 17.4 | 7.2 |
| Runnymede | 10.7 | 15.4 | 6.1 |
| Spelthorne | 10.0 | 14.4 | 5.8 |
| Surrey Heath | 11.8 | 15.8 | 7.7 |
| Tandridge | 14.3 | 20.1 | 8.7 |
| Waverley | 14.5 | 19.2 | 10.0 |
| Woking | 11.5 | 16.0 | 7.1 |
| South East | 11.0 | 15.4 | 6.7 |
| England | 9.8 | 13.9 | 5.7 |
Source: Office for National Statistics
Figure 6: Percentage of residents aged 16-74 who are self employed – 2001 and 2011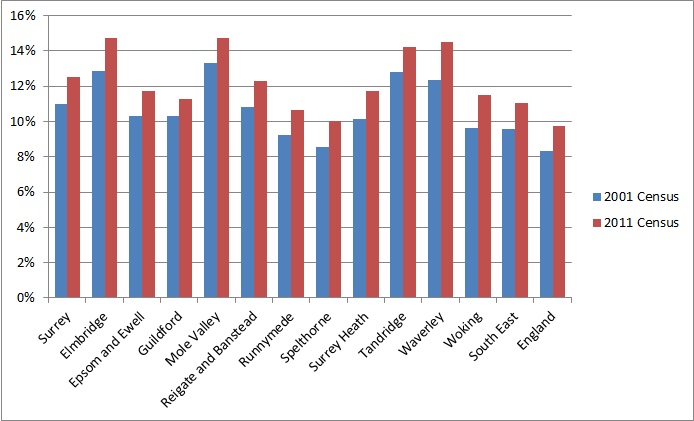
Source: Office for National Statistics
The unemployed
2.8% of Surrey residents aged 16-74 considered themselves to be unemployed in 2011. This was lower than the rate for England (4.4%) and higher than the rate in 2001 (1.7%).
Table 4: Percentage of people aged 16-74 who are unemployed
| Persons – % unemployed |
Males – % unemployed |
Females – % unemployed |
|
| Surrey | 2.8 | 3.3 | 2.3 |
| Elmbridge | 2.7 | 3.2 | 2.2 |
| Epsom and Ewell | 2.7 | 3.2 | 2.3 |
| Guildford | 2.7 | 3.1 | 2.3 |
| Mole Valley | 2.5 | 3.1 | 1.9 |
| Reigate and Banstead | 2.9 | 3.4 | 2.5 |
| Runnymede | 2.7 | 3.2 | 2.2 |
| Spelthorne | 3.3 | 3.7 | 2.8 |
| Surrey Heath | 2.8 | 3.1 | 2.4 |
| Tandridge | 2.8 | 3.3 | 2.3 |
| Waverley | 2.4 | 2.9 | 2.0 |
| Woking | 3.2 | 3.7 | 2.7 |
| South East | 3.5 | 4.1 | 2.8 |
| England | 4.4 | 5.3 | 3.5 |
Source: Office for National Statistics
Figure 7: Percentage of people aged 16-74 unemployed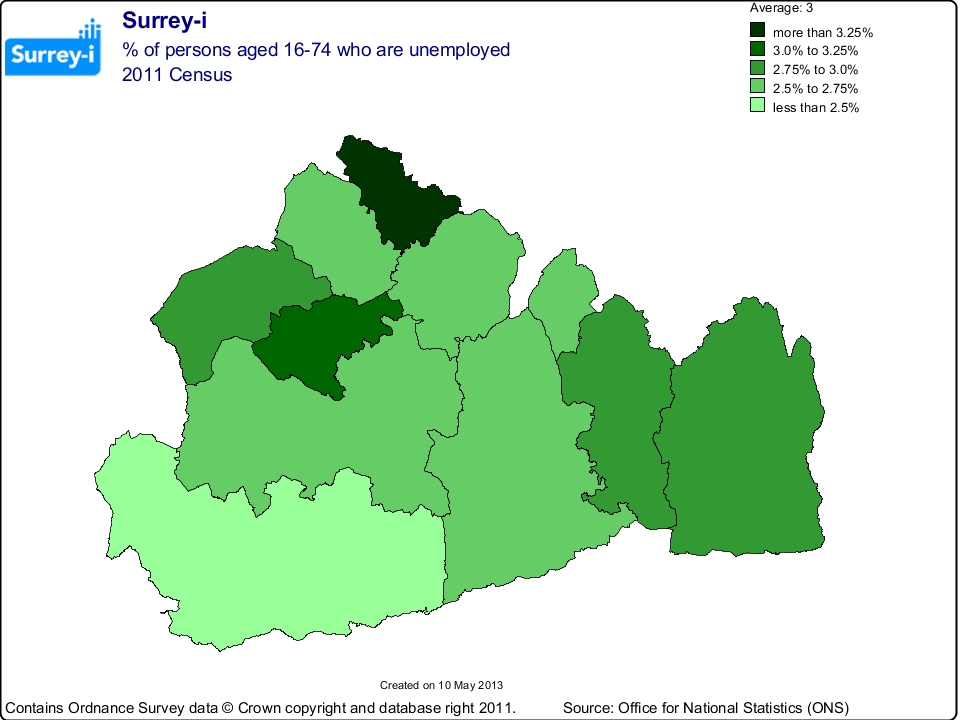
Students
The total number of students aged 16-74 in Surrey in 2011 was 66,224, which represents an increase of 31% since 2001. The boroughs with the highest percentage of economically active students were Guilford (4.9% of the residents aged 16-74) and Runnymede (4.8%), reflecting the presence of the Royal Holloway and Surrey university campuses.
Table 5: Students aged 16-74 by economic status
| Economically active: Full-time student |
% economically active full-time student |
Economically inactive: Student (including full-time students) |
% economically inactive students |
|
| Surrey | 25,327 | 3.1 | 40,897 | 5.0 |
| Elmbridge | 2,123 | 2.3 | 4,136 | 4.5 |
| Epsom and Ewell | 1,915 | 3.5 | 2,785 | 5.1 |
| Guildford | 4,999 | 4.9 | 8,681 | 8.5 |
| Mole Valley | 1,472 | 2.4 | 2,324 | 3.8 |
| Reigate and Banstead | 2,491 | 2.5 | 3,508 | 3.5 |
| Runnymede | 2,865 | 4.8 | 5,476 | 9.2 |
| Spelthorne | 1,725 | 2.5 | 2,260 | 3.2 |
| Surrey Heath | 1,785 | 2.9 | 2,185 | 3.5 |
| Tandridge | 1,325 | 2.2 | 2,581 | 4.3 |
| Waverley | 2,464 | 2.9 | 4,402 | 5.1 |
| Woking | 2,163 | 3.0 | 2,559 | 3.6 |
| South East | 209,620 | 3.3 | 324,649 | 5.2 |
| England | 1,336,823 | 3.4 | 2,255,831 | 5.8 |
Source: Office for National Statistics
Figure 8: Students in Surrey and economic activity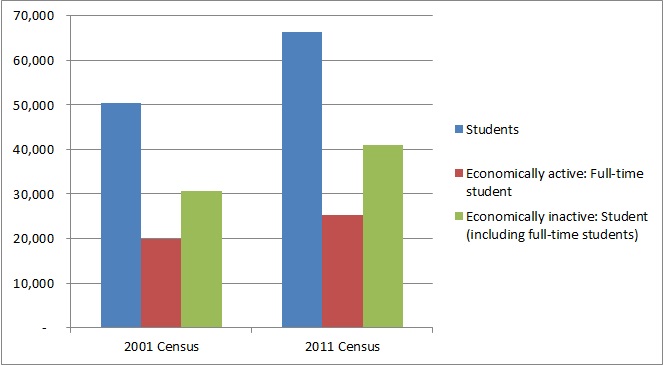
Source: Office for National Statistics
Figure 9: Percentage of economically active full time students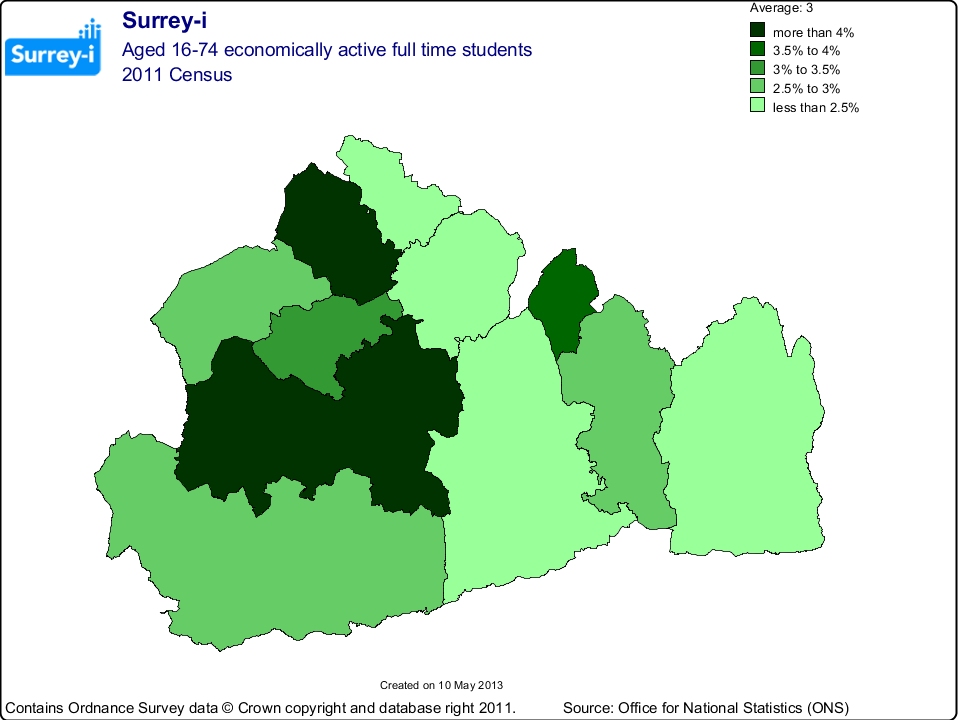
Retired people
12.9% of Surrey residents aged 16-74 were retired (105,585 people). This was slightly lower than the S.E. Region and England rates of 13.7% and lower than in 2001 (113,757 people).
Table 6: People aged 16-74 economically inactive – Retired
| Persons – % retired |
Males – % retired |
Females – % retired |
|
| Surrey | 12.9 | 11.0 | 14.8 |
| Elmbridge | 12.2 | 10.3 | 14.0 |
| Epsom and Ewell | 13.4 | 11.6 | 15.2 |
| Guildford | 11.3 | 9.6 | 13.1 |
| Mole Valley | 15.7 | 13.5 | 17.8 |
| Reigate and Banstead | 12.4 | 10.4 | 14.4 |
| Runnymede | 11.9 | 10.3 | 13.4 |
| Spelthorne | 13.3 | 11.7 | 14.9 |
| Surrey Heath | 13.5 | 11.5 | 15.5 |
| Tandridge | 14.1 | 11.9 | 16.2 |
| Waverley | 14.3 | 12.1 | 16.5 |
| Woking | 11.5 | 9.8 | 13.2 |
| South East | 13.7 | 11.7 | 15.6 |
| England | 13.7 | 11.8 | 15.6 |
Source: Office for National Statistics
Looking after home or family
4.7% of Surrey residents aged 16-74 (38,200 people) did not work because they were looking after the home or family. This proportion is very similar to the South East and England rates of 4.4% and lower than the rate in 2001 (6.9%).
Table 7: People aged 16-74 economically inactive – Looking after home or family
| Persons – % looking after home or family |
Males – % looking after home or family |
Females – % looking after home or family |
|
| Surrey | 4.7 | 0.5 | 8.7 |
| Elmbridge | 6.4 | 0.6 | 11.8 |
| Epsom and Ewell | 4.2 | 0.4 | 7.8 |
| Guildford | 4.4 | 0.5 | 8.3 |
| Mole Valley | 4.4 | 0.5 | 8.2 |
| Reigate and Banstead | 4.4 | 0.6 | 8.2 |
| Runnymede | 3.9 | 0.5 | 7.2 |
| Spelthorne | 3.9 | 0.5 | 7.2 |
| Surrey Heath | 4.4 | 0.5 | 8.3 |
| Tandridge | 4.3 | 0.5 | 7.9 |
| Waverley | 5.0 | 0.4 | 9.3 |
| Woking | 5.5 | 0.5 | 10.5 |
| South East | 4.4 | 0.7 | 8.0 |
| England | 4.4 | 0.8 | 7.9 |
Source: Office for National Statistics
Figure 10: Percentage of population aged 16-74 who are looking after home or family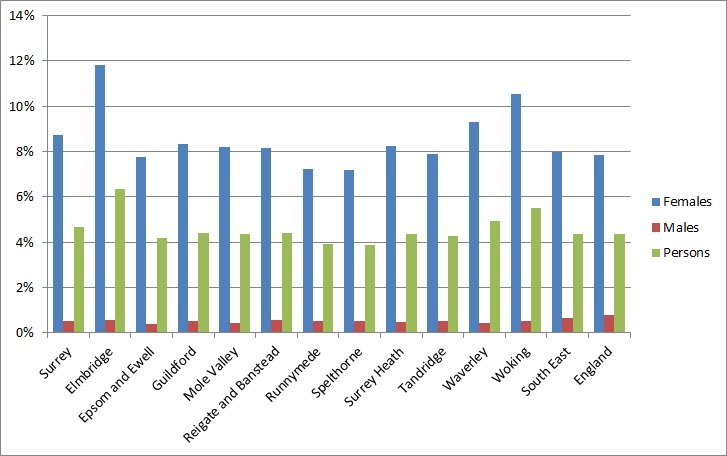
Source: Office for National Statistics
Long-term sick or disabled
The percentage of Surrey residents aged 16-74 who were not working in 2011 because they were permanently sick or disabled was 2.1%, half of the England rate of 4.1%. This was 16,744 people compared to 18,661 in 2001.
Table 8: People aged 16-74 economically inactive – Long-term sick or disabled
| Region | Persons – % long-term sick or disabled |
Males – % long-term sick or disabled |
Females – % long-term sick or disabled |
| Surrey | 2.1 | 2.1 | 2.0 |
| Elmbridge | 1.8 | 1.8 | 1.8 |
| Epsom and Ewell | 2.1 | 2.1 | 2.0 |
| Guildford | 1.9 | 1.9 | 1.9 |
| Mole Valley | 2.1 | 2.2 | 2.0 |
| Reigate and Banstead | 2.3 | 2.5 | 2.1 |
| Runnymede | 1.9 | 2.0 | 1.8 |
| Spelthorne | 2.3 | 2.4 | 2.2 |
| Surrey Heath | 1.7 | 1.7 | 1.7 |
| Tandridge | 2.2 | 2.3 | 2.1 |
| Waverley | 2.1 | 2.1 | 2.0 |
| Woking | 2.3 | 2.3 | 2.3 |
| South East | 2.9 | 3.0 | 2.8 |
| England | 4.1 | 4.3 | 3.8 |
Source: Office for National Statistics