2011 Census – Method of travel to work
Headlines
- Nearly 60% of Surrey residents in employment drive a car or van to work
- Nearly 17% use public transport
- Nearly 11% walk or cycle to work
- Home working and public transport use have increased since 2001, but car use, walking and cycling have decreased
Method of travel to work
The Census asks people who are in employment how they usually travel to work. They could tick one box only to indicate the longest part by distance of their usual journey to work.
In this analysis methods of travel to work have been divided into 3 categories:
- “Private motor transport” which includes driving a car or van; a passenger in a car or van; riding a motor cycle, scooter or moped; and travelling by taxi.
- “Public transport” which includes train; bus, minibus or coach; and underground, metro, light rail or tram.
- Walking and cycling.
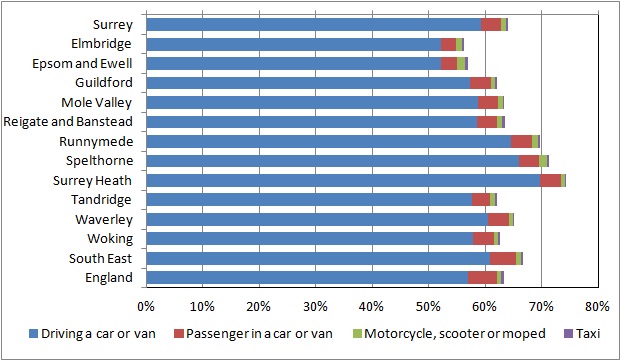
Commuting by private motor transport
59.3% of Surrey’s population in employment drive a car or van to work. The borough with the highest proportion driving a car is Surrey Heath (69.7%) and the lowest are Elmbridge (52.2%) and Epsom and Ewell (52.1%).
3.5% of the workforce travel as a passenger in a car or van, 0.9% travel by motorcycle, scooter or moped and 0.3% travel by taxi.
Altogether 64.0% of the workforce travel by private motor transport. The proportion is slightly higher in Surrey than England as a whole, but nationally more people travel as a passenger in a car or van and by taxi than in Surrey, with fewer driving a car.
Table 1: Commuting by private motor transport 2011
| Driving a car or van |
Passenger in a car or van |
Motorcycle, scooter or moped |
Travel by Taxi |
All private motor transport |
|
| Surrey | 59.3% | 3.5% | 0.9% | 0.3% | 64.0% |
| Elmbridge | 52.2% | 2.6% | 1.2% | 0.3% | 56.3% |
| Epsom and Ewell | 52.1% | 2.9% | 1.3% | 0.6% | 57.0% |
| Guildford | 57.3% | 3.7% | 0.8% | 0.2% | 62.0% |
| Mole Valley | 58.7% | 3.5% | 0.9% | 0.2% | 63.3% |
| Reigate and Banstead | 58.5% | 3.7% | 0.9% | 0.5% | 63.5% |
| Runnymede | 64.5% | 3.8% | 1.1% | 0.3% | 69.6% |
| Spelthorne | 65.9% | 3.7% | 1.4% | 0.2% | 71.2% |
| Surrey Heath | 69.7% | 3.7% | 0.7% | 0.2% | 74.3% |
| Tandridge | 57.6% | 3.2% | 0.9% | 0.3% | 62.0% |
| Waverley | 60.5% | 3.8% | 0.7% | 0.1% | 65.1% |
| Woking | 57.8% | 3.8% | 0.8% | 0.4% | 62.7% |
| South East | 60.8% | 4.7% | 0.9% | 0.4% | 66.8% |
| England | 57.0% | 5.0% | 0.8% | 0.5% | 63.4% |
Figure 1: Commuting by private motor transport 2011
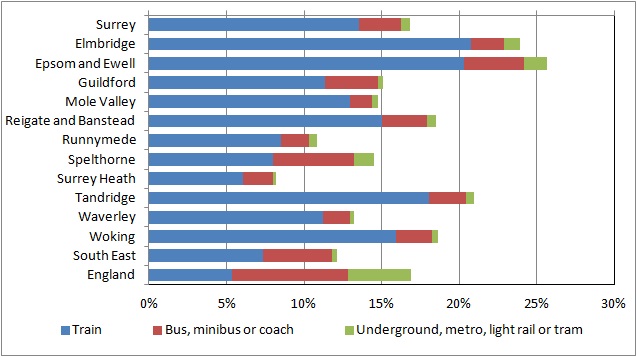
Commuting by public transport
13.6% of Surrey’s population in employment travel to work by train. The boroughs with the highest proportion travelling by train are Elmbridge (20.8%) and Epsom and Ewell (20.3%) and the lowest is Surrey Heath (6.1%).
2.7% of the workforce travel by bus. The borough with the highest proportion travelling by bus is Spelthorne (5.2%) and the lowest is Mole Valley (1.4%).
A small number (0.6%) say they travel by underground, metro, light rail or tram, mostly in boroughs adjacent to London.
Altogether 16.8% of the workforce travel by public transport. The proportion is very similar in Surrey and England as a whole, but nationally more people travel by bus (7.5%) and underground, metro, light rail or tram (4.1%) than in Surrey, with fewer taking the train (5.3%).
Table 2: Commuting by public transport 2011
| Train | Bus, minibus or coach |
Underground, metro, light rail or tram |
All public transport |
|
| Surrey | 13.6% | 2.7% | 0.6% | 16.8% |
| Elmbridge | 20.8% | 2.1% | 1.0% | 23.9% |
| Epsom and Ewell | 20.3% | 3.9% | 1.5% | 25.7% |
| Guildford | 11.3% | 3.4% | 0.3% | 15.1% |
| Mole Valley | 12.9% | 1.4% | 0.4% | 14.7% |
| Reigate and Banstead | 15.0% | 2.9% | 0.5% | 18.5% |
| Runnymede | 8.5% | 1.9% | 0.5% | 10.8% |
| Spelthorne | 8.0% | 5.2% | 1.3% | 14.5% |
| Surrey Heath | 6.1% | 1.9% | 0.2% | 8.2% |
| Tandridge | 18.1% | 2.4% | 0.5% | 20.9% |
| Waverley | 11.2% | 1.7% | 0.3% | 13.2% |
| Woking | 15.9% | 2.3% | 0.4% | 18.6% |
| South East | 7.3% | 4.5% | 0.4% | 12.1% |
| England | 5.3% | 7.5% | 4.1% | 16.9% |
Figure 2: Commuting by public transport 2011
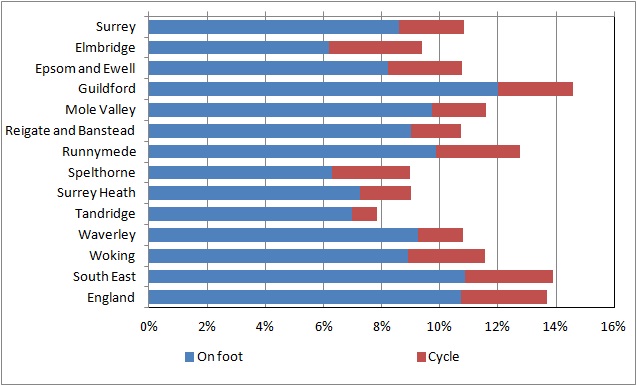
Walking and cycling
8.6% of Surrey’s population in employment walk to work and 2.2% cycle. The highest proportion of walkers is in Guildford (12.0%) and lowest in Elmbridge (6.2%). This highest proportion of cyclists is in Elmbridge (3.2%) and the lowest in Tandridge (0.9%).
A small number of people (0.6%) travel by another method.
The proportion of the workforce walking and cycling to work is lower in Surrey than England as a whole where 10.7% walk and 3.0% cycle
Table 3: Commuting on foot, by cycle and other methods 2011
| On foot | Cycle | Other method | |
| Surrey | 8.6% | 2.2% | 0.6% |
| Elmbridge | 6.2% | 3.2% | 0.7% |
| Epsom and Ewell | 8.2% | 2.5% | 0.6% |
| Guildford | 12.0% | 2.6% | 0.6% |
| Mole Valley | 9.7% | 1.9% | 0.7% |
| Reigate and Banstead | 9.0% | 1.7% | 0.5% |
| Runnymede | 9.9% | 2.9% | 0.7% |
| Spelthorne | 6.3% | 2.7% | 0.5% |
| Surrey Heath | 7.3% | 1.7% | 0.8% |
| Tandridge | 7.0% | 0.9% | 0.7% |
| Waverley | 9.2% | 1.5% | 0.7% |
| Woking | 8.9% | 2.7% | 0.5% |
| South East | 10.9% | 3.0% | 0.7% |
| England | 10.7% | 3.0% | 0.6% |
Figure 3: Commuting on foot or cycling 2011
Working mainly at or from home
The Census asked people who were in employment to give the address of their workplace, including a tick box option for “work mainly at or from home”. “Work mainly at or from home” was also an option in the travel to work question. In 2001, people who recorded their place of work as working mainly at or from home were considered to have their mode of travel to work as working mainly at or from home. In 2011, people working mainly at or from home could record, for example, that they travelled to work as a driver in a car or van, despite being based at home. This extra information is useful for transport planning however it means that the 2011 data is not comparable with 2001.
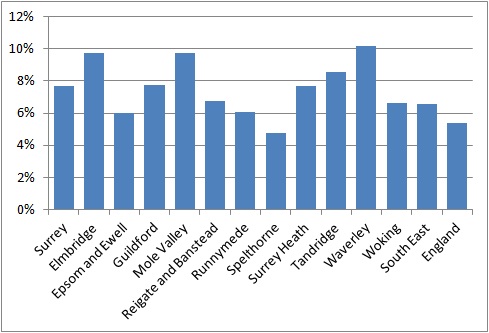
7.7% of Surrey residents ticked “work mainly at or from home” in the travel to work question. The borough with the highest proportion of home workers is Waverley (10.2%) and the lowest is Spelthorne (4.8%).
Surrey has a higher proportion of home workers than England as a whole where 5.4% chose this option.
Table 4: People working mainly at or from home 2011 (based on to travel to work question)
| % working at home | |
| Surrey | 7.7% |
| Elmbridge | 9.7% |
| Epsom and Ewell | 6.0% |
| Guildford | 7.8% |
| Mole Valley | 9.7% |
| Reigate and Banstead | 6.7% |
| Runnymede | 6.1% |
| Spelthorne | 4.8% |
| Surrey Heath | 7.7% |
| Tandridge | 8.6% |
| Waverley | 10.2% |
| Woking | 6.6% |
| South East | 6.6% |
| England | 5.4% |
Figure 4: People working mainly at or from home 2011(based on to travel to work question)
Of the 79,000 people who were classified as home workers using the 2001 definition (ie defined by their response to the workplace address question), more than half (56.2%) also selected ‘working mainly at or from home’ in the method of travel to work question. The breakdown of methods of travel used by homeworkers is shown in table 5. The ‘other method of travel to work’ category (1.5%) had a larger share of travel to work for the home workers than for all workers (0.6%). This may reflect the above average number of agricultural workers who stated that they worked from home in the workplace address question. Such workers may be referring to the use of tractors and other agricultural machinery as their method of travel to work.
Table 5: Method of travel to work for home workers in Surrey, 2011(as defined by workplace address)
| Work mainly at or from home | 56.2% |
| Underground metro light rail tram | 0.4% |
| Train | 3.7% |
| Bus minibus or coach | 0.5% |
| Taxi | 0.2% |
| Motorcycle scooter or moped | 0.3% |
| Driving a car or van | 27.1% |
| Passenger in a car or van | 0.9% |
| Bicycle | 0.6% |
| On foot | 8.7% |
| Other method of travel to work | 1.5% |
Change since 2001
Although the standard 2011 census outputs for travel to work analysed above are not comparable with 2001 (as explained earlier), the Office for National Statistics has released supplementary data using the 2001 method of processing this topic (ie by deriving home workers using the responses to the workplace address question) so that comparisons can be made.
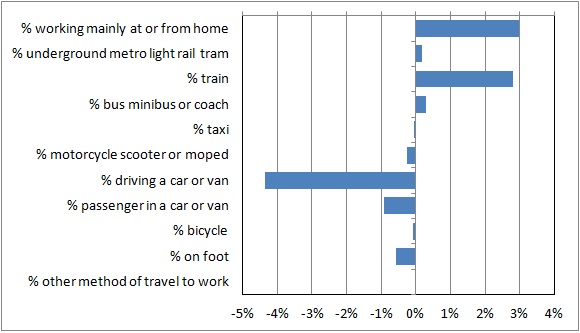
This analysis shows that the proportion of home workers in Surrey has increased since 2001. There has also been an increase in all types of public transport and a decrease in all other methods.
Table 6: Method of travel to work (2001 definition) 2001 and 2011 – Surrey
| 2001 Census | 2011 Census | |
| Working mainly at or from home | 10.7% | 13.7% |
| Underground metro light rail tram | 0.4% | 0.6% |
| Train | 10.3% | 13.0% |
| Bus minibus or coach | 2.3% | 2.6% |
| Taxi | 0.3% | 0.3% |
| Motorcycle scooter or moped | 1.2% | 0.9% |
| Driving a car or van | 59.9% | 55.5% |
| Passenger in a car or van | 4.3% | 3.4% |
| Bicycle | 2.2% | 2.2% |
| On foot | 8.0% | 7.4% |
| Other method of travel to work | 0.5% | 0.4% |
Figure 5: Percentage point changes in method of travel to work of Surrey residents in employment – 2001 to 2011 (using 2001 definition)