2011 Census – Religion
Headlines
- The majority of the population in Surrey is Christian (62.8%).
- Muslim is the next biggest religious group (2.2%).
- The proportion of Christians in Surrey fell from 74.6% in 2001 to 62.8% in 2011.
- The percentage of people that reported to have no religion has increased to a quarter of the population.
- Younger age groups are more likely to have no religion than older people
Religion in Surrey
The Census asks people to state their religion. The question is voluntary and “no religion” is one of the options available.
Christianity is the largest religion in Surrey with 711,110 people (62.8% of the population).
5% of the population (56,390) reported a Non-Christian religion. Within the Non-Christian religions, Muslim was the largest group with 24,378 people (2.2%) followed by Hindu with 15,018 people (1.3%).
24.8% of the population reported to have “no religion” and 7.4% did not answer the religion question.
Figure 1: Religion, Surrey, 2011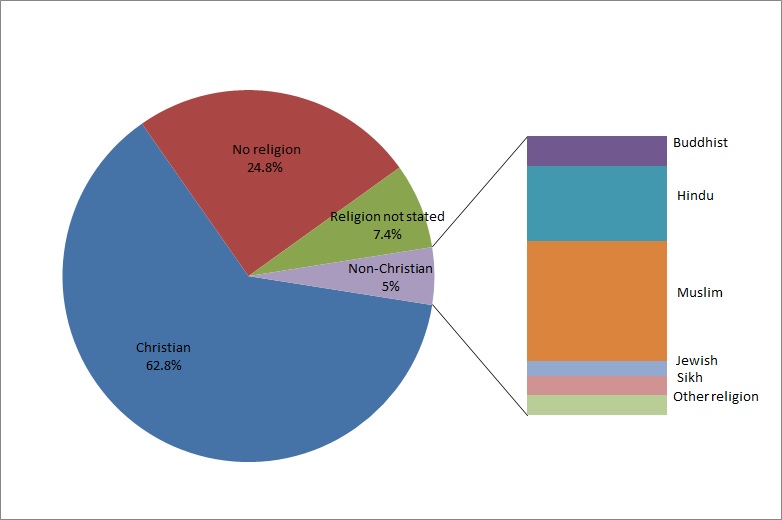
Source: Census – Office for National Statistics
Changing picture of religion over time
Over the last decade the proportion of Christians in Surrey decreased going from 74.6% in 2001 to 62.8% in 2011 and the proportion of people reporting “No religion” increased from 15.2% to 24.8%.
There was an increase in all other main religions. The number of Muslims increased the most from 1.3% in 2001 to 2.2% in 2011.
Table 1: Religion, Census 2001-2011, Surrey
| 2011 | 2001 | |||
| Christian | 711110 | 62.8% | 789609 | 74.6% |
| Buddhist | 6019 | 0.5% | 3362 | 0.3% |
| Hindu | 15018 | 1.3% | 7458 | 0.7% |
| Muslim | 24378 | 2.2% | 14190 | 1.3% |
| Jewish | 3055 | 0.3% | 3229 | 0.3% |
| Sikh | 3783 | 0.3% | 1967 | 0.2% |
| Other religion | 4137 | 0.4% | 3281 | 0.3% |
| No religion | 280814 | 24.8% | 161074 | 15.2% |
| Religion not stated | 84076 | 7.4% | 74845 | 7.1% |
Source: Census – Office for National Statistics
Differences in religion across local authorities
Christianity was the largest religion across all boroughs in Surrey. In 10 out of 11 boroughs the proportion of people who were Christian was over 60%.
Waverley was the borough with the highest percentage of Christians (65.2%) and the lowest percentages in all the Non-Christian religions.
Woking was the most diverse borough in terms of religion with 10.7 % of the population identifying with a religion other than the Christian and had the highest proportion of Muslims at 7.4%.
The proportion reporting no religion increased across all the boroughs. The borough with the highest proportion of people stating that they have “No religion” was Guilford with 27.8%. Guilford was also the borough that had the largest decrease in Christian affiliation (-13.4 percentage points).
Table 2: Religion 2011, Local Authorities in Surrey
| % Christian | % Buddhist | % Hindu | % Muslim | % Jewish | % Sikh | % Other religion |
% No religion | % Religion not stated |
|
| Surrey | 62.8 | 0.5 | 1.3 | 2.2 | 0.3 | 0.3 | 0.4 | 24.8 | 7.4 |
| Elmbridge | 64.2 | 0.5 | 1.2 | 1.8 | 0.6 | 0.4 | 0.3 | 23.4 | 7.5 |
| Epsom and Ewell | 61.5 | 0.6 | 2.5 | 3.0 | 0.3 | 0.2 | 0.4 | 24.3 | 7.1 |
| Guildford | 60.2 | 0.6 | 0.9 | 2.0 | 0.2 | 0.2 | 0.3 | 27.8 | 7.7 |
| Mole Valley | 64.3 | 0.4 | 0.7 | 0.8 | 0.2 | 0.1 | 0.4 | 25.2 | 7.9 |
| Reigate and Banstead | 61.9 | 0.4 | 1.4 | 1.9 | 0.2 | 0.1 | 0.3 | 26.3 | 7.4 |
| Runnymede | 63.4 | 0.6 | 1.5 | 1.9 | 0.3 | 0.7 | 0.4 | 24.0 | 7.2 |
| Spelthorne | 63.8 | 0.4 | 2.4 | 1.9 | 0.2 | 1.4 | 0.4 | 22.5 | 7.0 |
| Surrey Heath | 63.4 | 0.9 | 1.6 | 1.9 | 0.2 | 0.6 | 0.4 | 23.9 | 7.2 |
| Tandridge | 64.9 | 0.4 | 0.7 | 0.7 | 0.2 | 0.1 | 0.3 | 25.3 | 7.5 |
| Waverley | 65.2 | 0.4 | 0.3 | 0.6 | 0.2 | 0.1 | 0.4 | 25.3 | 7.6 |
| Woking | 58.8 | 0.7 | 2.0 | 7.4 | 0.2 | 0.2 | 0.3 | 23.1 | 7.3 |
Source: Census – Office for National Statistics
How does Surrey compare with England and the South East?
Surrey has a higher proportion of Christians than South East (59.8%) and England (59.4%).The proportion of Muslims in Surrey is less than half of the proportion in England (5%) and very similar to the proportion in the South East (2.3%).
Table 3: Religion 2011, Surrey, England and South East
| Surrey | South East | England | |
| Christian | 62.8% | 59.8% | 59.4% |
| Buddhist | 0.5% | 0.5% | 0.5% |
| Hindu | 1.3% | 1.1% | 1.5% |
| Muslim | 2.2% | 2.3% | 5.0% |
| Jewish | 0.3% | 0.2% | 0.5% |
| Sikh | 0.3% | 0.6% | 0.8% |
| Other religion | 0.4% | 0.5% | 0.4% |
| No religion | 24.8% | 27.7% | 24.7% |
| Religion not stated | 7.4% | 7.4% | 7.2% |
Source: Census – Office for National Statistics
Differences across age groups
Younger people are more likely to have no religion than older people. More than a third (36%) of young adults aged 16-24 say they have no religion whereas only 10% of people aged over 65 have no religion. Older people are more likely to be Christian with 80% affiliating with this religion. In contrast only 51% of young adults say they are Christian. The highest proportion of the population who have other religions is the 25-44 age group where 7.2% have non Christian religions.
Table 4: Religion by age 2011 – Surrey
| Christian | Muslim | Hindu | All other religions |
No religion | Religion not stated |
|
| Age 0-15 | 59% | 3.2% | 1.4% | 1.1% | 27% | 8% |
| Age 16-24 | 51% | 2.9% | 1.3% | 1.6% | 36% | 8% |
| Age 25-44 | 54% | 3.0% | 2.1% | 2.0% | 32% | 6% |
| Age 45-64 | 68% | 1.2% | 1.0% | 1.6% | 21% | 8% |
| Age 65+ | 80% | 0.6% | 0.5% | 0.9% | 10% | 8% |
| All people | 63% | 2.2% | 1.3% | 1.5% | 25% | 7% |
Source: Office for National Statistics
Figure 2: Religion by age 2011 – Surrey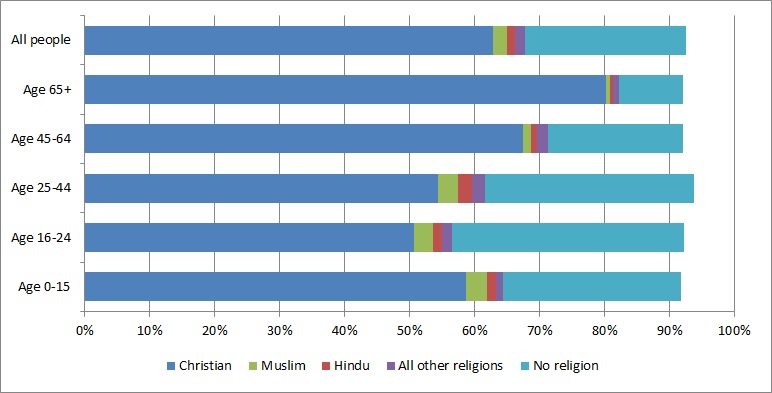
Source: Office for National Statistics