2021 Census: Car or Van Availability
Car or van availability from the 2021 Census
The raw data from this Census release has been processed by the Population Insight Team and is also available on Surrey-i.
The Office for National Statistics produced interactive maps for the 2021 Census results. The ONS interactive map of the car or van availability statistics have been embedded at the bottom of this page.
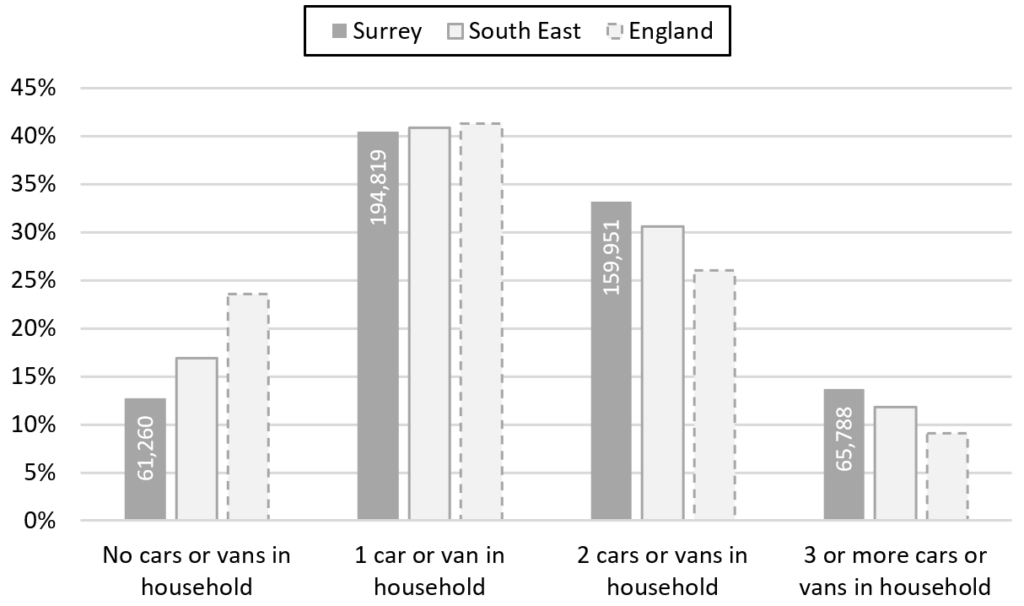
Census 2021 asked households how many cars or vans the household owned or had available to them. In 2021:
- 12.7% (61,260) of households had no cars or vans (down from 13.1% in 2011)
- 40.4% (194,819) had one car or van (equal to 40.4% in 2011)
- 33.2% (159,951) had two cars or vans (down from 34.2% in 2011)
- 13.7% (65,788) had three or more cars or vans (up from 12.2% in 2011)
Households in Surrey were less likely to have access to no cars or vans (12.7%) compared to the South East (16.9%) and England (23.5%). Surrey households were also more likely to have access to 2 cars or vans (33.2%) or 3 or more cars or vans (13.7%) compared to the South East (30.5% and 11.8% respectively) and England (26.1% and 9.1% respectively).
Car or van availability in Surrey, 2021
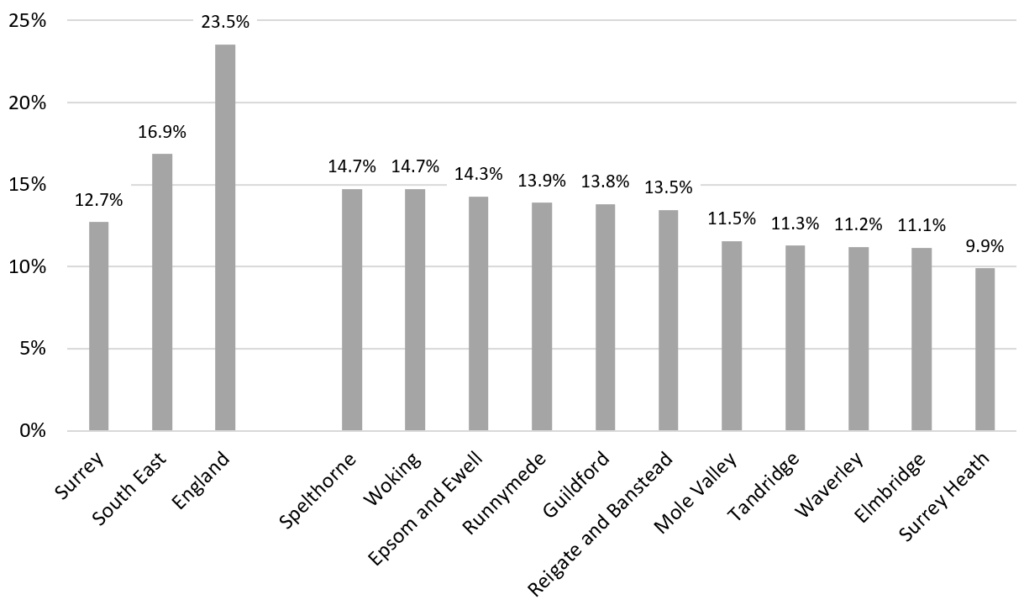
Every Surrey district and borough had lower percentages of households with access to no cars or vans than the South East and England. Spelthorne had the highest percentage of households with no car or van availability (14.7%) and Surrey Health had the lowest percentage (9.9%).
Households with no car or van availability in Surrey, 2021
The Office for National Statistics produced interactive maps for the 2021 Census results. The ONS interactive map shows the car or van availability statistics.
Hover over the map to see each of the area names and values. Zoom in and out of these maps to see the data at smaller geographical areas.