2021 Census: Disability
Disability from the 2021 Census
The raw data from this Census release has been processed by the Population Insight Team and is also available on Surrey-i.
The Office for National Statistics produced interactive maps for the 2021 Census results. The ONS interactive map of the disability statistics has been embedded at the bottom of this page.
The 2021 Census asked people “Do you have any physical or mental health conditions or illnesses lasting or expected to last 12 months or more?”. If they answered yes, a further question “Do any of your conditions or illnesses reduce your ability to carry out day-to-day activities?” was presented. The identification of disability differs from the 2011 Census question used, which asked “Are your day-to-day activities limited because of a health problem or disability which has lasted, or expected to last, at least 12 months?” to align the 2021 Census answers with the 2010 Equality Act. The Equality Act defines an individual as disabled if they have a physical or mental impairment that has a substantial and long-term negative effect on their ability to carry out normal day-to-day activities.
Census 2021 was undertaken during the coronavirus (COVID-19) pandemic, which may also have influenced how people perceive their health status and activity limitations and therefore may affect how people chose to respond.
Disability and age are closely related, with older people being more likely to be disabled. Age-standardised proportions (ASPs) account for different age structures in populations and are more appropriate than crude percentages when drawing comparisons over time and across areas.
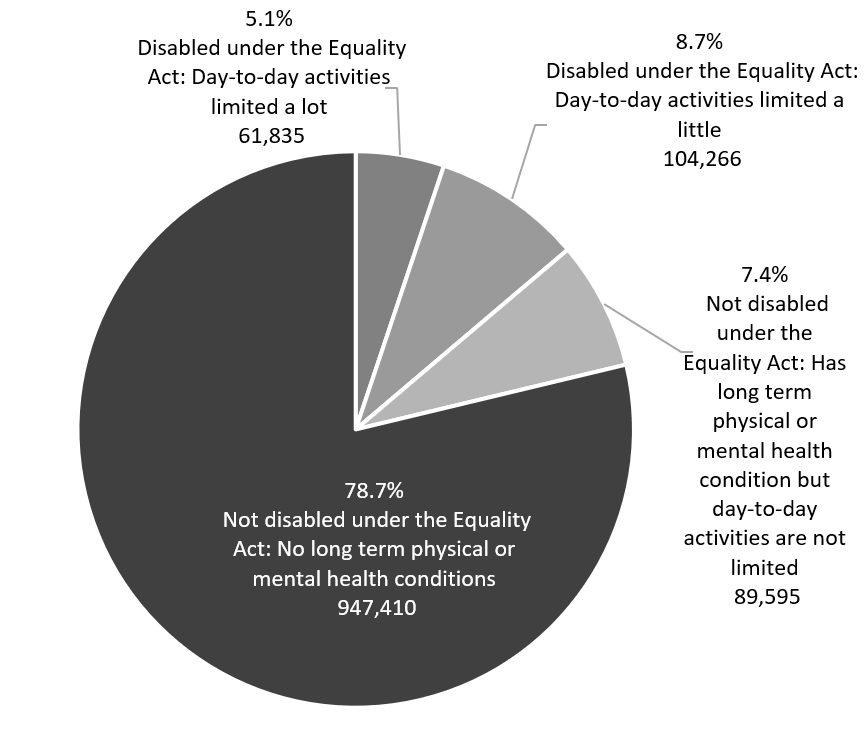
Just under a quarter of Surrey residents (21.3%) were classified as having a disability under the Equality Act or had a long term physical or mental health condition (but day-to-day activities were not limited). One in 20 residents were classified as disabled under the Equality Act where their day-to-day activities were limited ‘a lot’ and represented 61,835 individuals. Just over 100 thousand (104,266) residents were classified as disabled under the Equality Act, 8.7 per cent, whereby their day-to-day activities were limited ‘a little’. The Census also collected information from people who were not categorised as disabled under the Equality Act but had a long term physical or mental health condition and whose day-to-day activities were not limited, and such individuals represented 7.4 per cent of Surrey residents (89,595).
The non age-standardised proportion of Surrey residents with a disability, 2021
As noted above, age-standardised proportions account for differences in population size and age structure, meaning that they allow comparison between areas which are not skewed by one area having, for example, a much older population who are more likely to be disabled. The non age-standardised proportions are available on the data page and another graph below – these figures can be used when you are only concerned with looking at the level of disability in one area and represent the ‘true’ proportions of residents.
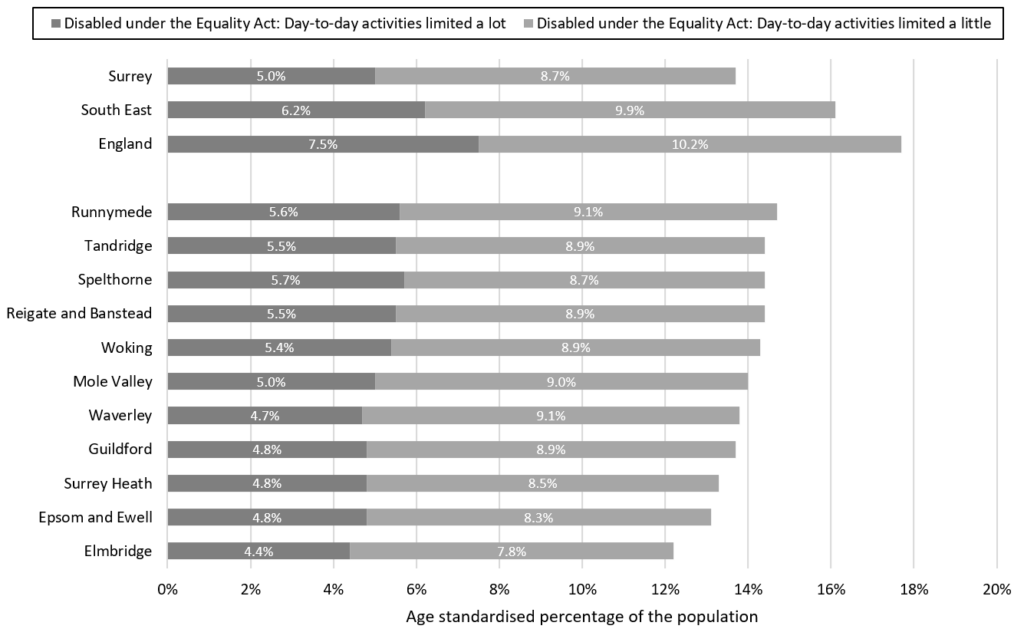
When accounting for the age structure, Surrey had a lower proportion of residents who were classified as disabled under the Equality Act (13.7%) compared to the South East (16.1%) and England (17.7%). When accounting for the age structure, Runnymede had the highest proportion of residents who were classified as disabled under the Equality Act at the time of the 2021 Census (14.7%) compared to Elmbridge which had the lowest percentage at 12.2 per cent.
Although Elmbridge continued to have the lowest non age-standardised proportion of residents who were classified as disabled, Mole Valley had the highest proportion of residents who were classified as disabled under the Equality Act when age structure was not accounted for (but had the 6th highest proportion when age-standardised). This is likely to be because Mole Valley had a higher proportion of residents at older ages and those at older ages are more likely to be classified as disabled.
The age-standardised proportion of Surrey residents with a disability, 2021
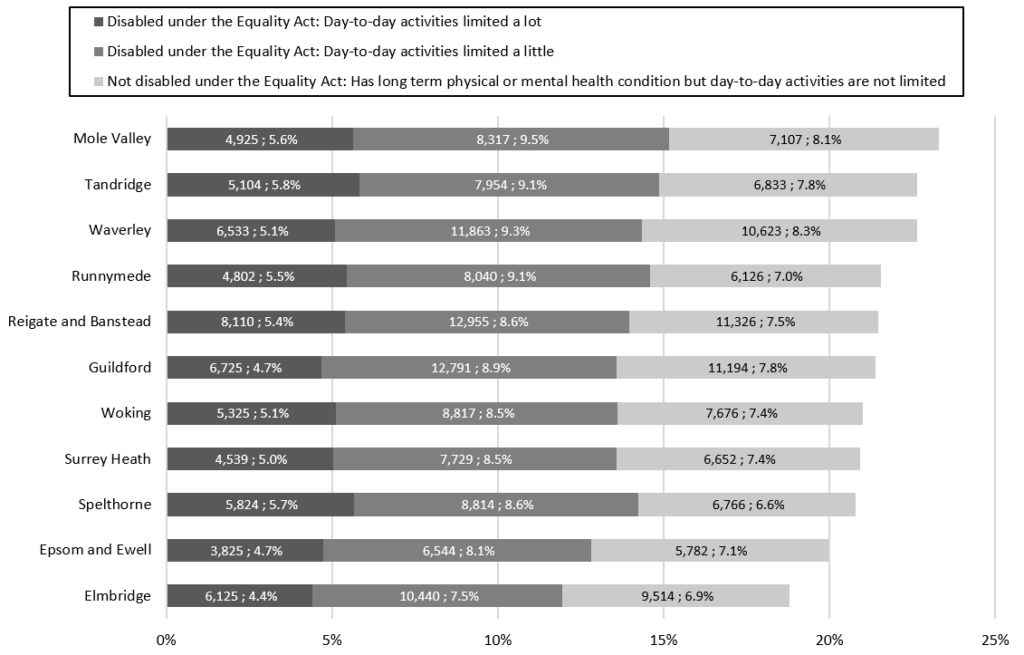
The non age-standardised figures which do not account for underlying differences in age structure showed that Mole Valley had the highest proportion of residents who were classified as disabled under the Equality Act or had long term physical or mental health conditions (23.3%) and, more specifically, the highest proportion of residents who were classified as disabled under the Equality Act (15.2%). Tandridge had the highest proportion of residents who were classified as disabled under the Equality Act whose day-to-day activities were limited ‘a lot’ at 5.8 per cent. Waverley had the highest proportion of residents with long term physical or mental health conditions whose day-to-day activities were not limited (8.3%). Elmbridge had the lowest proportion of residents who were classified as disabled under the Equality Act at 11.9 per cent.
The non age-standardised proportion of Surrey district and borough residents with a disability, 2021
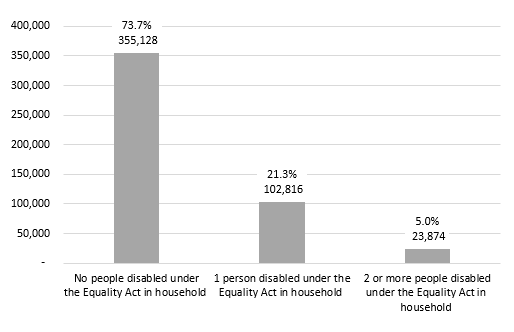
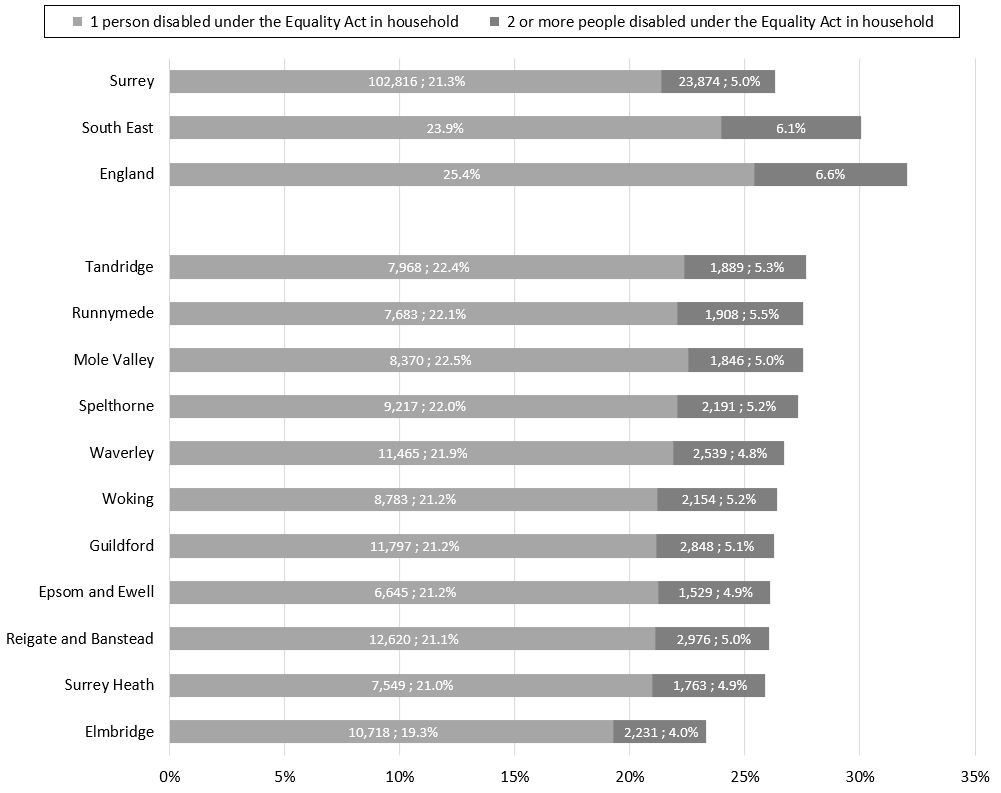
Just over a quarter of Surrey households (26.3%) had at least one person who were classified as disabled under the Equality Act in the household, which represented 126,690 households at the time of the Census in 2021. Of these households, 23,874 included two or more individuals who were classified as disabled under the Equality Act (5.0% of all Surrey households).
Households in Surrey by the number of residents who were disabled under the Equality Act, 2021
Surrey had a lower proportion of households with at least one member who was classified as disabled under the Equality Act (26.3%) compared to the South East (30.0%) and England (32.0%). Of the districts and boroughs in Surrey, Tandridge had the highest proportion of households with at least one member who was classified as disabled under the Equality Act at 27.7 per cent compared to 23.3 per cent of households in Elmbridge. Although Surrey has an older age structure compared to the England as a whole, every Surrey district and borough had a lower proportion of households with at least one person who was classified as disabled under the Equality Act compared to England.
Households in districts and boroughs in Surrey by the number of residents who were disabled under the Equality Act, 2021
The Office for National Statistics has produced interactive maps for the 2021 Census results. The maps below show the distribution of disability across residents.
Hover over the map to see each of the area names and values. Zoom in and out of these maps to see the data at smaller geographical areas.