2021 Census: Gender Identity
Gender identity from the 2021 Census
The raw data from this Census release has been processed by the Population Insight Team and is also available on Surrey-i.
The Office for National Statistics initially produced interactive maps for the 2021 Census results, but have subsequently (in September 2024) withdrawn their accreditation of this particular datasets at this level as official statistics. The ONS interactive map of the gender identity statistics were originally embedded at the bottom of this page, but have now been removed due to the source material being unpublished by ONS.
Questions about gender identity were included for the first time in the Census for 2021. As stated by the Office for National Statistics: ‘Gender identity refers to a person’s sense of their own gender, whether male, female or another category such as non-binary. This may or may not be the same as their sex registered at birth’.
‘The question was voluntary and was only asked of people aged 16 years and over. People were asked “Is the gender you identify with the same as your sex registered at birth?”, and had the option of selecting either “Yes”, or selecting “No” and writing in their gender identity.’
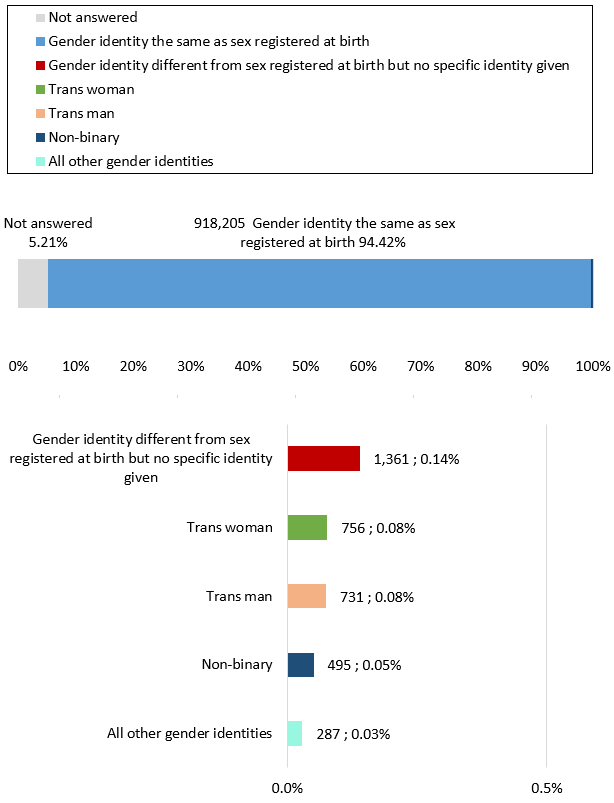
Across Surrey, there were responses from 921,833 residents (94.79% of the population aged 16 years and over).
A total of 918,205 residents (94.42%) answered “Yes”, indicating that their gender identity was the same as their sex registered at birth.
A total of 3,628 residents (0.37%) answered “No”, indicating that their gender identity was different from their sex registered at birth. Within this group:
- 1,361 (0.14%) answered “No” but did not provide a write-in response
- 731 (0.08%) identified as a trans man
- 756 (0.08%) identified as a trans woman
- 495 (0.05%) identified as non-binary
- 287 (0.03%) wrote in a different gender identity
The remaining 50,679* residents (5.21%*) did not answer the question on gender identity.
*Please note that these figures differ slightly to the earlier non-response figures which was concerned with responses to the initial question on gender identity with broad categories, this is because these higher non-response rates now include the non-responses to further defining gender identity in the write-in box.
Gender identity of usual Surrey residents, 2021
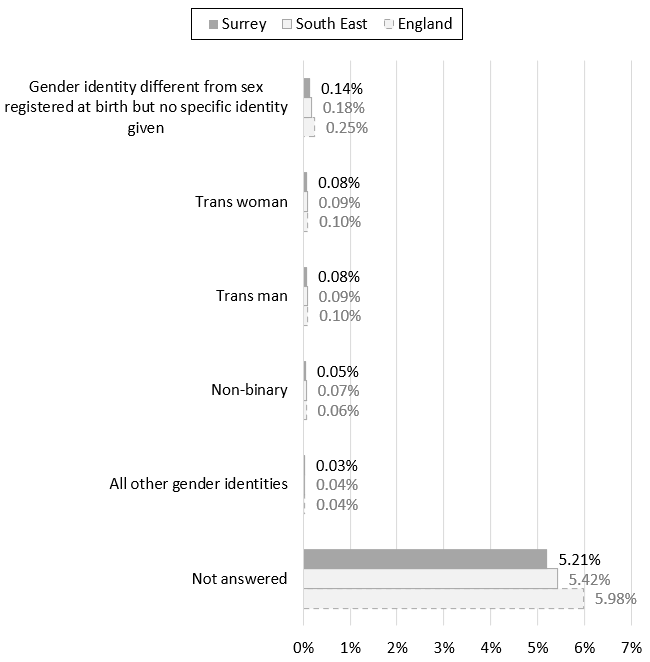
Overall, a lower proportion of Surrey residents aged 16 and over reported that their gender identity differed to their sex registered at birth (0.37%) compared to the South East (0.46%) and England (0.55%). Surrey residents were less likely to report each of the specific gender identities which involved a gender identity which differed to sex registered at birth than overall residents of the South East and England. This was even though a higher proportion of Surrey residents answered this question on gender identity than the South East and England response-rates.
Gender identity of Surrey, South East, and England residents aged 16 and over in 2021
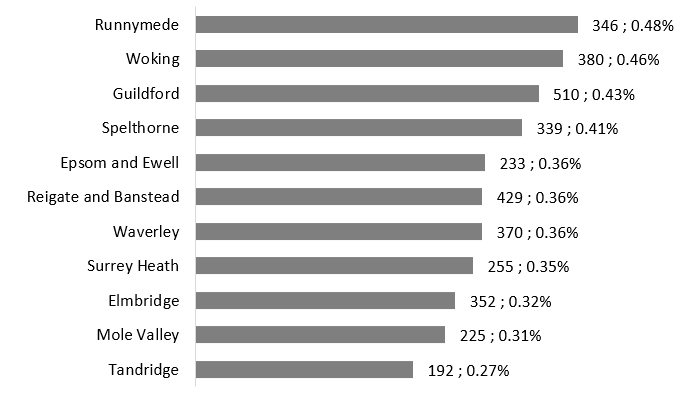
Every district and borough in Surrey had lower proportions of residents who reported that their gender identity differed from their sex registered at birth than the England average, and only Runnymede and Woking had higher proportions than the South East average at 0.48 per cent and 0.46 per cent respectively. Tandridge had the lowest proportion of residents aged 16 and over who reported that their their gender identity differed from their sex registered at birth at 0.27 per cent.
The percentage of Surrey residents aged 16 and over who reported that their gender identity was different from their sex registered at birth, 2021
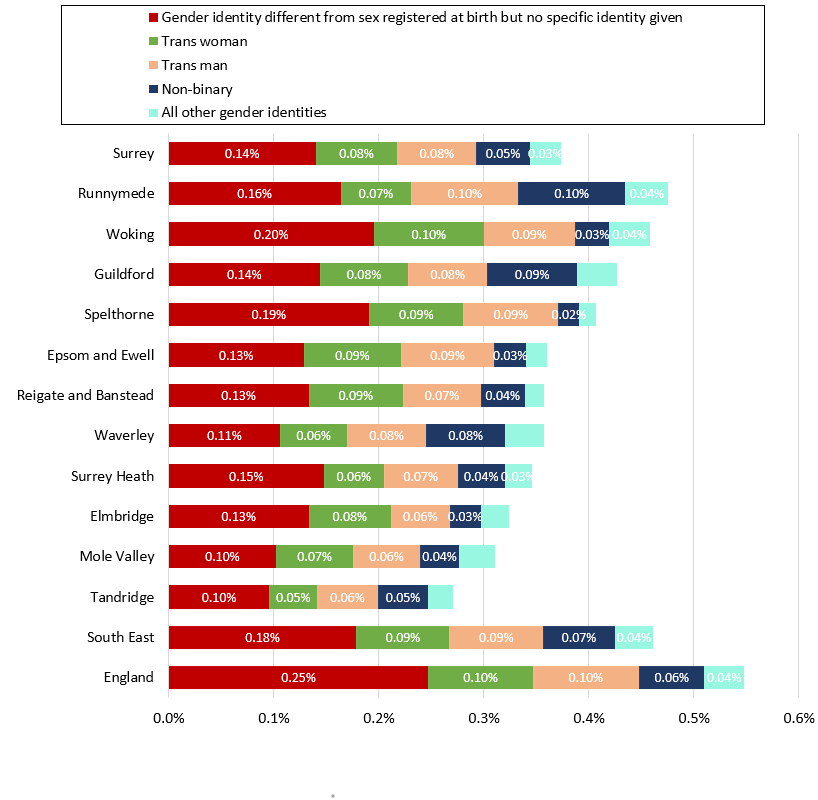
Of the district and borough with the highest proportion of residents who reported that their gender identity differed to their sex assigned at birth, 0.16 per cent of all unusual residents reported this difference between their gender identity and sex assigned at birth but did not provide a specific identity. Trans men represented 0.10 per cent of the Runnymede population, alongside non-binary residents representing 0.10 per cent and trans women representing 0.07 per cent. The detailed breakdown of gender identity is available on the Surrey-i data page.
Gender identity of the residents aged 16 and over of districts and boroughs in Surrey, 2021