2021 Census: General Health
General health from the 2021 Census
The raw data from this Census release has been processed by the Population Insight Team and is also available on Surrey-i.
The Office for National Statistics produced interactive maps for the 2021 Census results. The ONS interactive map of the self-rated general health statistics have been embedded at the bottom of this page.
Respondents were asked to assess their general health on a five-point scale from “Very good”, “Good”, “Fair”, “Bad”, to “Very bad”.
As noted by the Office for National Statistics: ‘Census 2021 was conducted during the coronavirus (COVID-19) pandemic during March 2021. This may have influenced how people perceive and rate their health and therefore may have affected how people chose to respond.’
The percentages presented in the following graphs use age-standardised proportions (ASPs) which account for different age structures in populations and are more appropriate than crude percentages when drawing comparisons over time and across areas. The data pages also include the raw percentages taken from the population which have not been age-standardised.
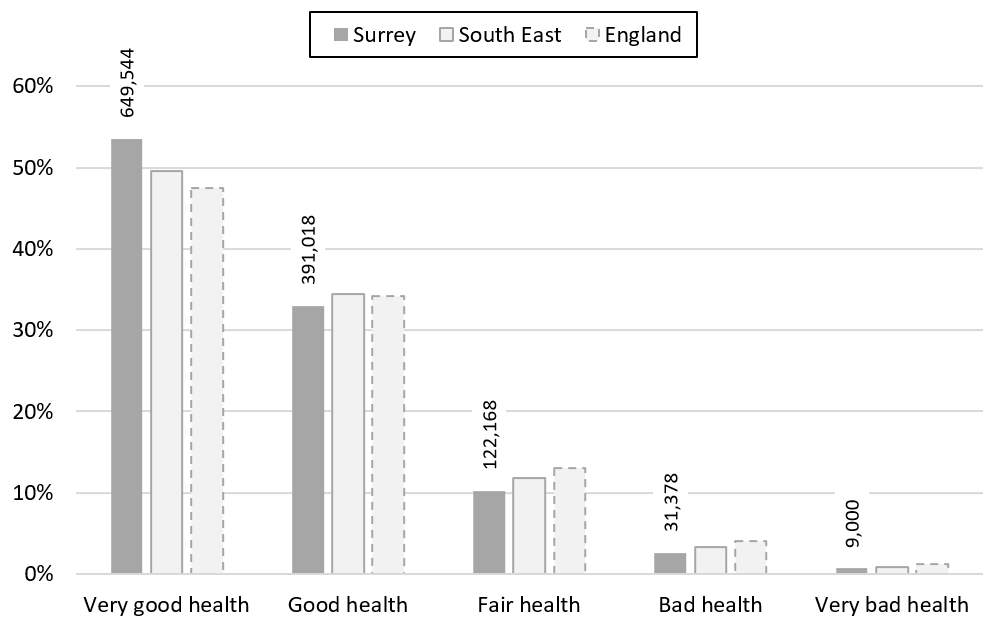
At the time of the 2021 Census, Surrey residents were more likely to report very good health (53.5%) than the South East (49.6%) and England (47.5%). While 3.3 per cent of Surrey residents reported bad health or very bad health at the time of the 2021 Census, 4.2 per cent of the South East and 5.3 per cent of England reported negative health. These age-standardised percentages take into account that Surrey has an older population and that older populations may be more likely to experience health issues which influence their self-reported general health.
The self-defined general health of Surrey residents, 2021
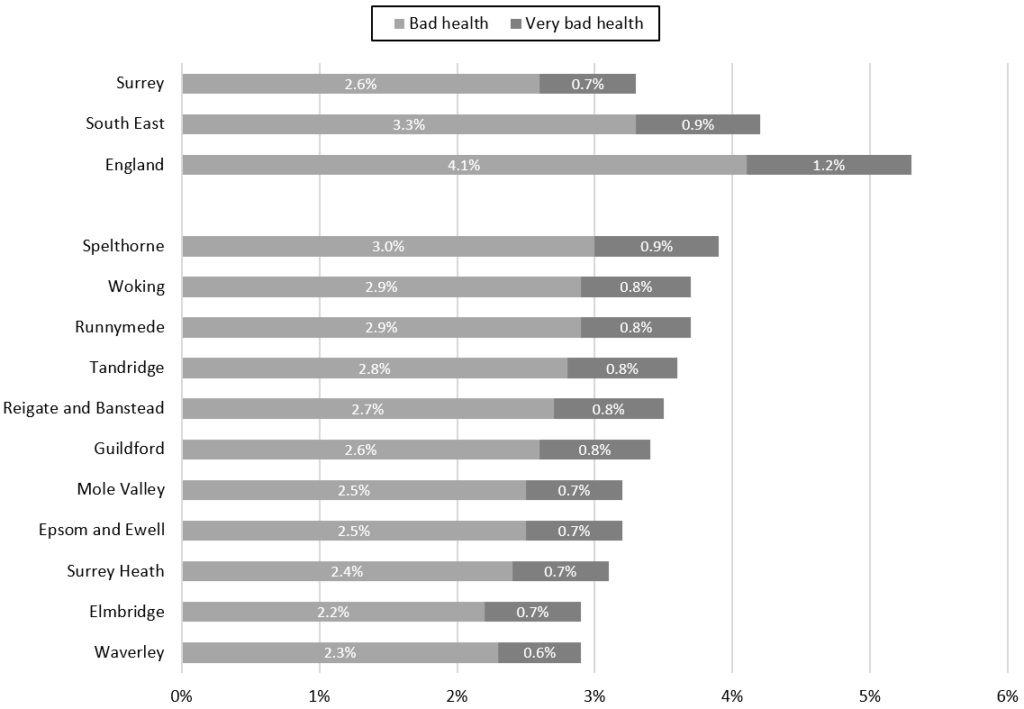
At the time of the 2021 Census, every district and borough in Surrey had a lower proportion (age-standardised and non age-standardised) of residents who reported negative general health through bad or very bad health. Spelthorne had the highest proportion of residents with self-reported bad or very bad general health (3.9%) compared to Waverley which had the lowest proportion at 2.9 per cent.
The self-defined bad or very bad general health of Surrey residents, 2021
The Office for National Statistics has produced interactive maps for the 2021 Census results. The maps below show the distribution of self-rated general health across residents.
Hover over the map to see each of the area names and values. Zoom in and out of these maps to see the data at smaller geographical areas.