2021 Census: Housing
Housing from the 2021 Census
The raw data from this Census release has been processed by the Population Insight Team and is also available on Surrey-i.
The Office for National Statistics produced interactive maps for the 2021 Census results. Some of the maps will be embedded here but the rest are available at the link.
On Census Day (21st March 2021), there were 481,818 households with at least one usual resident in Surrey. The number of households increased by 26,027 between the 2011 and 2021 Censuses, representing a 5.7 per cent growth (compared to the 5.2% growth between the 2001 and 2011 Censuses). The summary of the data around household size and persons in households is also available on Surrey-i.
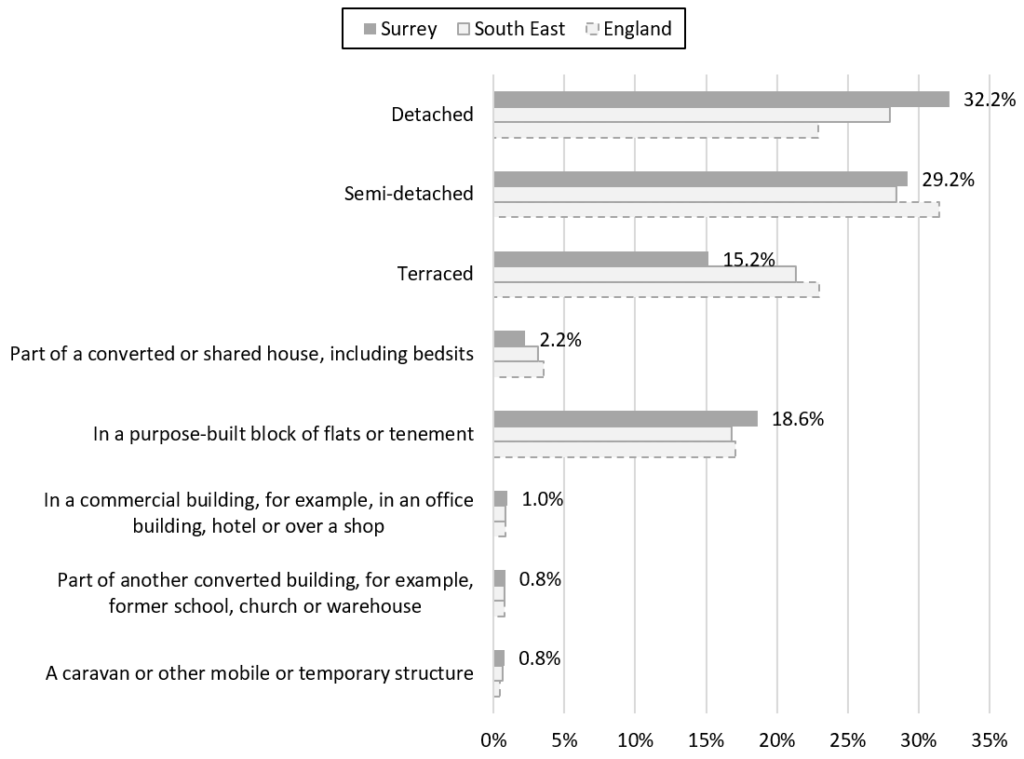
In 2021, just under a third of Surrey households were living in detached houses (32.2%), followed by 29.2 per cent in semi-detached houses, 18.6 per cent in purpose-built flats or tenements, and 15.2 per cent in terraced houses. Surrey had a higher proportion of households living in detached houses (32.3%) compared to the South East (28.0%) and England (22.9%). Although Surrey residents were more likely to live in detached houses, a similar proportion of households lived in houses with around three quarters of households in Surrey, the South East, and England living in houses compared to other accommodation types.
Accommodation type of Surrey housing, 2021
The Office for National Statistics has produced interactive maps for the 2021 Census results.
Hover over the map to see each of the area names and values. Zoom in and out of these maps to see the data at smaller geographical areas.
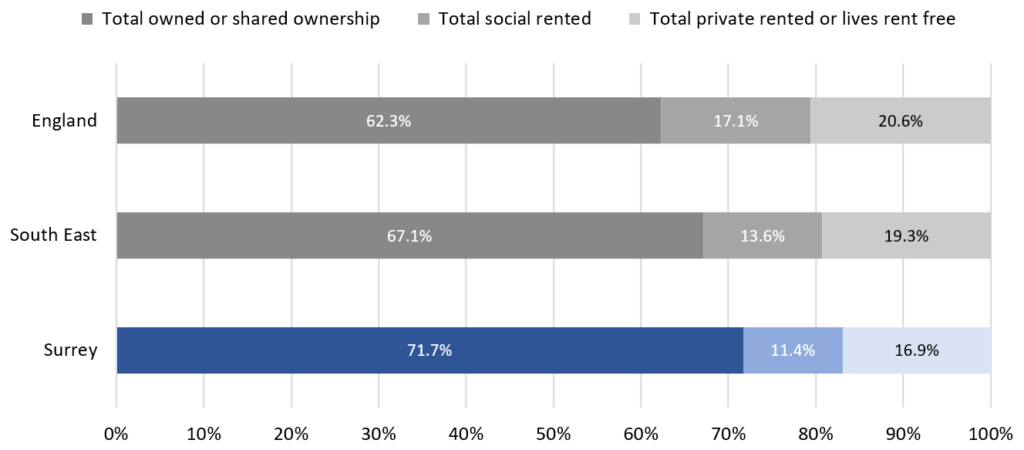
Just under three quarters of Surrey households owned their homes or had shared ownership of their homes (71.7%), alongside 16.9 per cent of households who lived in private rented homes or lived rent free and 11.4 per cent of households who lived in social rented homes. Surrey had a lower proportion of households in social rented homes (11.4%) than the South East (13.6%) and England (17.1%).
Tenure of Surrey housing, 2021
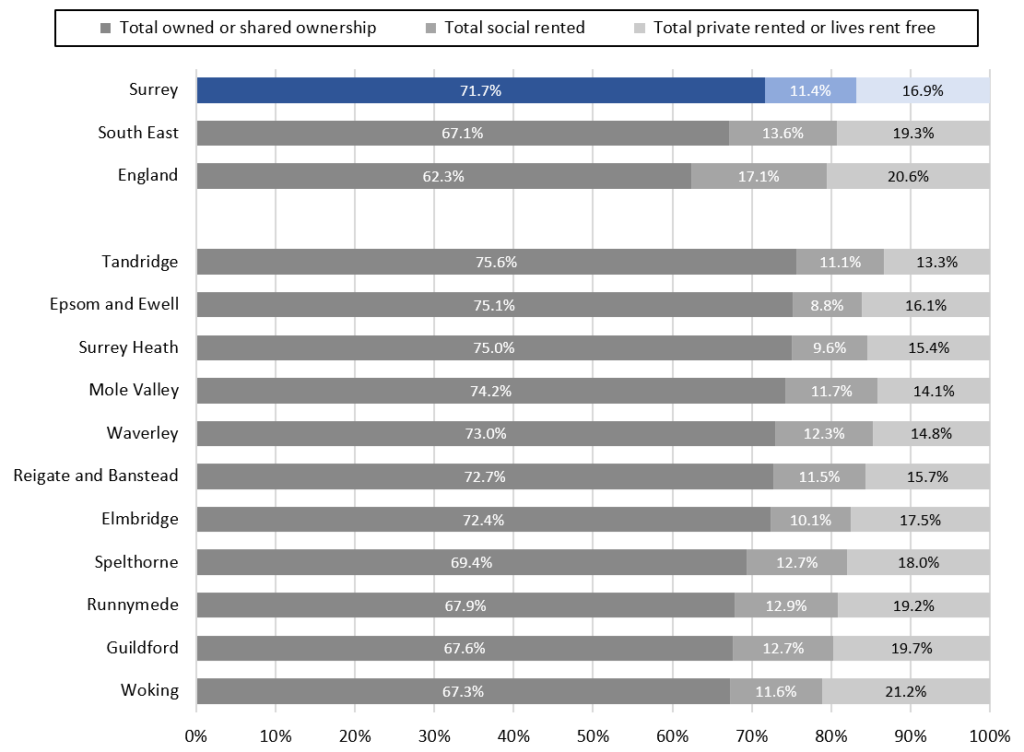
All of Surrey districts and boroughs had a higher proportion of home ownership than the South East and England averages. Every district and borough in Surrey also had a smaller proportion of households who lived in social rented housing than the South East (13.6%) and England (20.6%) averages. However, within Surrey, Runnymede and Guildford had the highest proportions of households in social rented homes at 12.9 per cent and 12.7 per cent respectively. Woking had the highest proportion of households in private rented housing or lived rent free at 21.2 per cent.
Tenure of the housing in the Surrey districts and boroughs, 2021
The Office for National Statistics has produced interactive maps for the 2021 Census results.
Hover over the map to see each of the area names and values. Zoom in and out of these maps to see the data at smaller geographical areas.
Census 2021 used Valuation Office Agency (VOA) data to count the number of rooms in a dwelling. This was instead of using the approach from previous censuses of asking the question on the census form. All rooms in a dwelling apart from bathrooms, toilets, halls or landings, kitchens, conservatories, or utility rooms are counted. For households living in a shared dwelling, the number of rooms are counted for the whole dwelling and not the individual household. The VOA method for counting number of rooms differs in several ways from the method used in the 2011 Census. For example, the VOA method includes storage rooms (which were excluded in the 2011 Census) but excludes kitchens, conservatories, and utility rooms (which were included in the 2011 Census). For this reason, Census 2021 data on number of rooms should not be directly compared with the equivalent 2011 Census data.
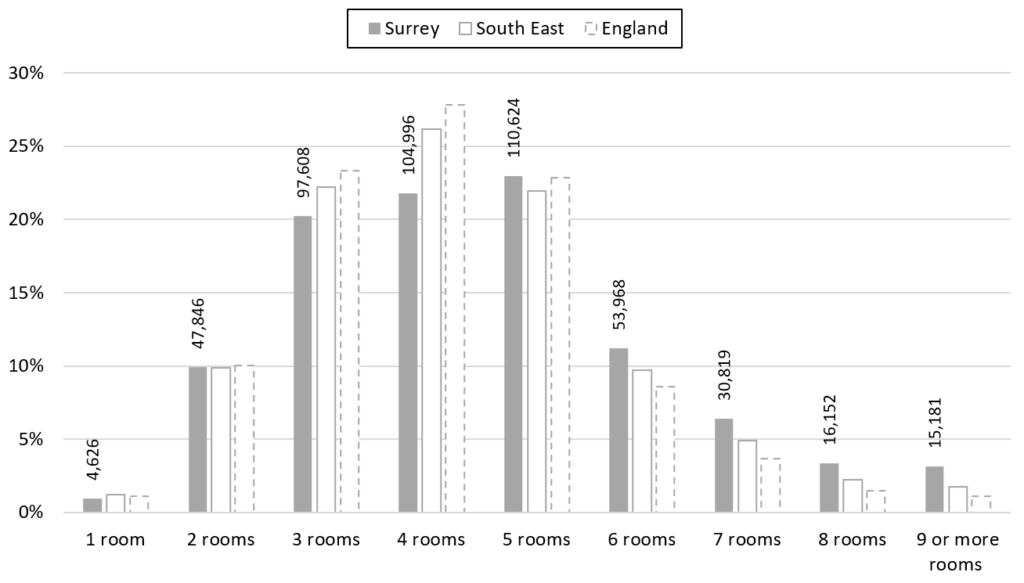
Across Surrey, 52,472 households had one or two rooms (10.9%), 313,228 households had three, four or five rooms (65.0%), 100,939 households had six, seven or eight rooms (20.9%), and 15,181 households had nine or more rooms (3.2%). In general, Surrey households had homes with more rooms than the average household living in the South East or England. In Surrey, 20.9 per cent of households lived in homes with six, seven or eight rooms compared to 16.8 per cent of the South East and 13.8 per cent of England. Homes with 9 or more rooms were also more common in Surrey (3.2%) than the South East (1.8%) and England (1.1%).
The number of rooms in Surrey housing, 2021
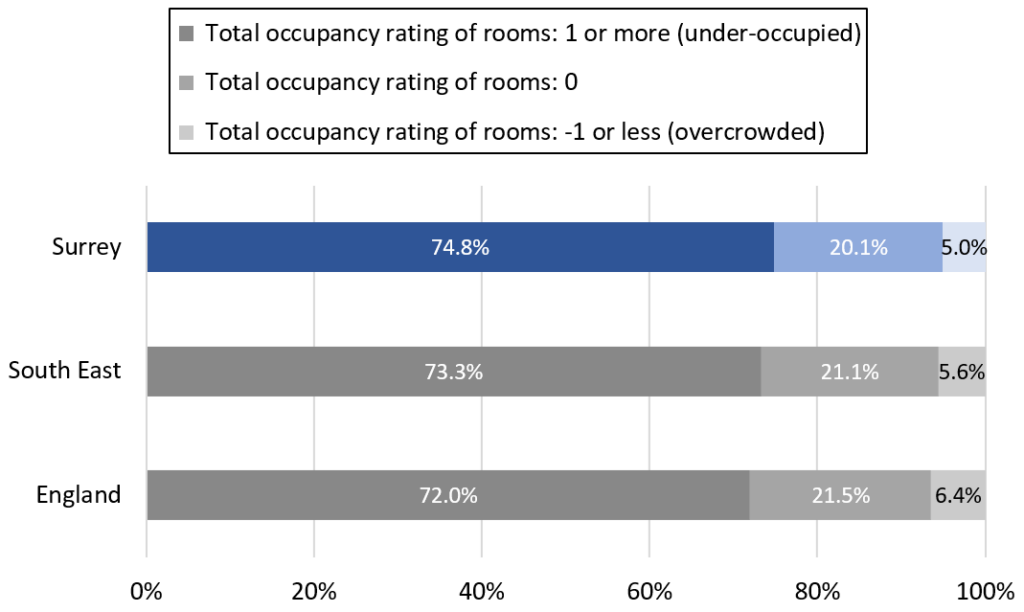
Occupancy rating provides a measure of whether a household’s accommodation is overcrowded or under-occupied. An occupancy rating of negative 1 or less implies that a household has fewer rooms than the standard requirement, positive 1 implies that they have more rooms than required, and 0 implies that they met the standard required. A lower proportion of households in Surrey lived in overcrowded homes (5.0%) than the South East (5.6%) and England (6.4%) averages. However, a total of 24,235 households in Surrey lived in an overcrowded home at the time of the 2021 Census.
The occupancy rating of rooms in Surrey households, 2021
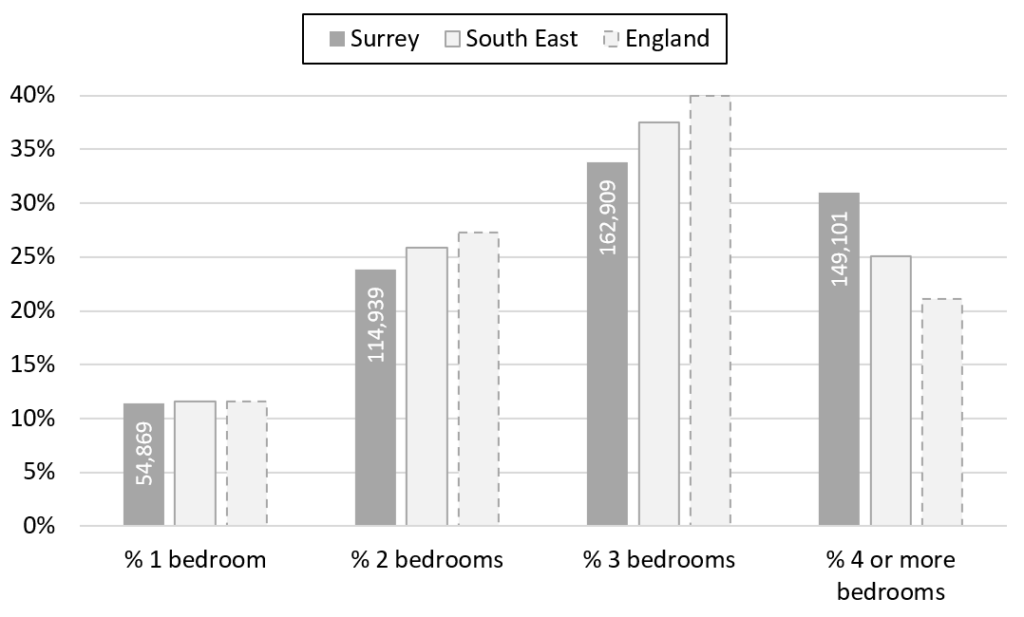
As in 2011, Census 2021 directly asked about the number of bedrooms available to the household. While the proportion of households in Surrey who lived in a home with just one bedroom (11.4%) was similar to the South East and England averages (11.6%), a higher proportion of Surrey households had access to four or more bedrooms (30.9%) than those living in the South East (25.0%) and England (21.1%).
The number of bedrooms in Surrey housing, 2021
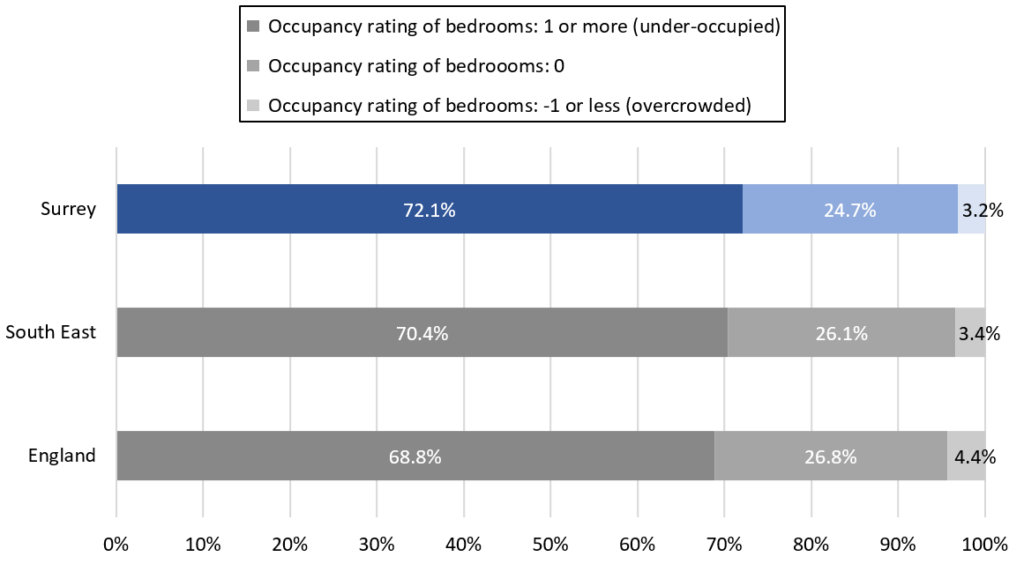
Occupancy rating provides a measure of whether a household’s accommodation is overcrowded or under-occupied. An occupancy rating of negative 1 or less implies that a household has fewer bedrooms than the standard requirement, positive 1 implies that they have more bedrooms than required, and 0 implies that they met the standard required. In Surrey, 15,327 households had overcrowded bedrooms which represented 3.2 per cent of households. Much like the general occupancy rating of all rooms, Surrey had a lower proportion of households who lived in overcrowded bedrooms (3.2%) compared to the South East (3.4%) and England (4.4%) averages.
The occupancy rating of bedrooms in Surrey households, 2021
