2021 Census: People with Second Addresses
People with second addresses from the 2021 Census
The raw data from this Census release has been processed by the Population Insight Team and is also available on Surrey-i.
The Office for National Statistics produced interactive maps for the 2021 Census results. The ONS interactive maps of the people with second addresses and the types of second address have been embedded at the bottom of this page.
In addition to reporting their primary address, Census 2021 also asked respondents to report whether they stay at another address for more than 30 days a year. If they answered yes, they were then asked the purpose of the second address, and whether it is within or outside the UK.
With these data it is important to consider the impacts of the coronavirus (COVID-19) pandemic, for instance students may have been more likely to be residing at their parent or guardians’ address for the whole academic year with no use of a second term-time address.
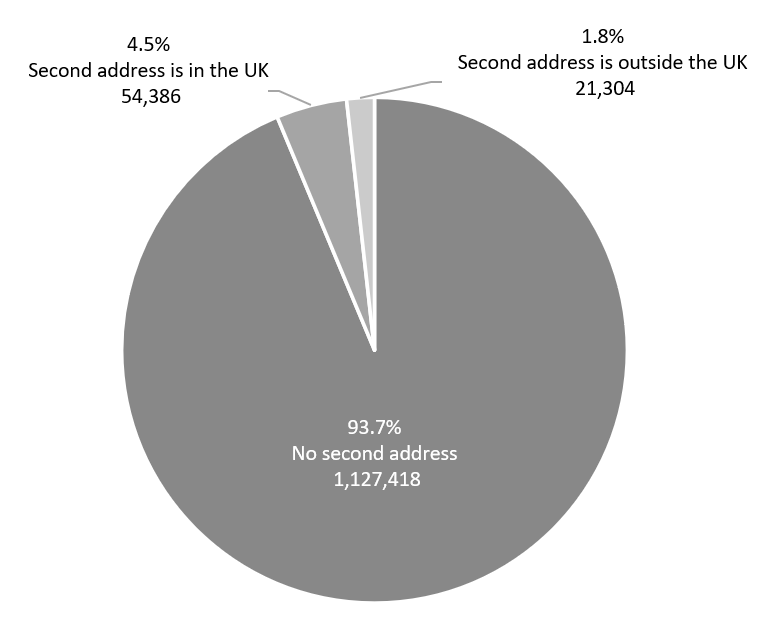
In Surrey, 75,690 usual residents (6.3% of the population) reported staying at a second address for more than 30 days a year. While a higher proportion of the Surrey population stayed at a second UK address (4.5%), 1.8 per cent of the Surrey population had a second address outside of the UK.
Surrey residents who stayed at a second address for more than 30 days a year, 2021
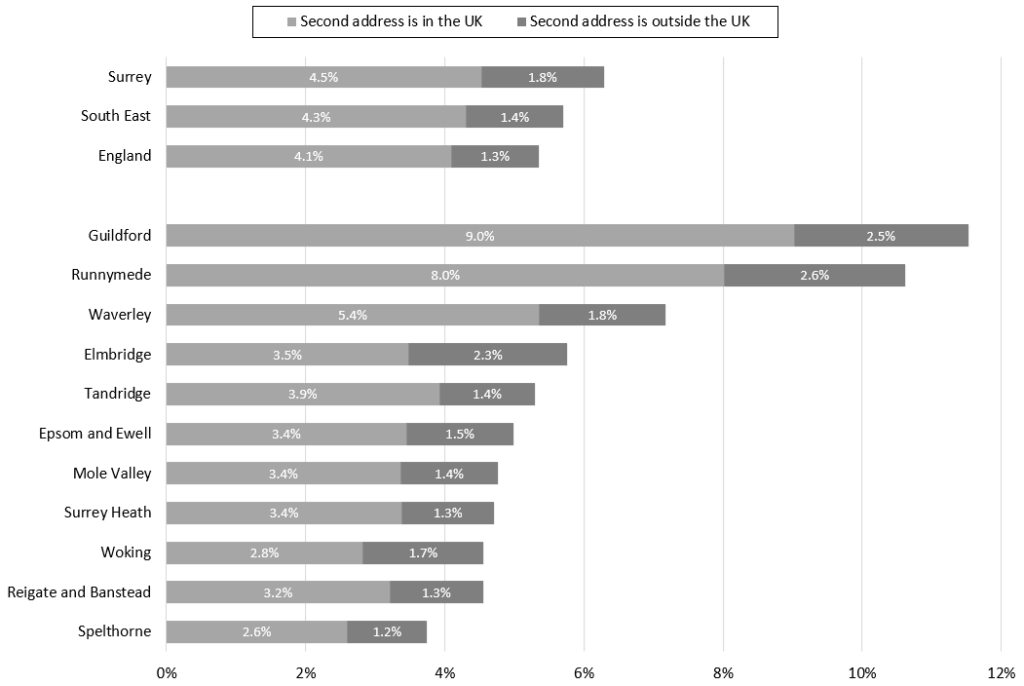
The Surrey population was more likely to report a second address (6.3%) than the South East (5.7%) and England (5.4%). Guildford and Runnymede had the highest proportions of the population which had a second address at 11.5 per cent and 10.6 per cent respectively. These two areas also had the highest proportions of the population with a second address outside of the UK (2.5% for Guildford and 2.6% for Runnymede) alongside Elmbridge which had 2.3 per cent of the population which had a second address outside of the UK at the time of the 2021 Census.
Residents of Surrey districts and boroughs who stayed at a second address for more than 30 days a year, 2021
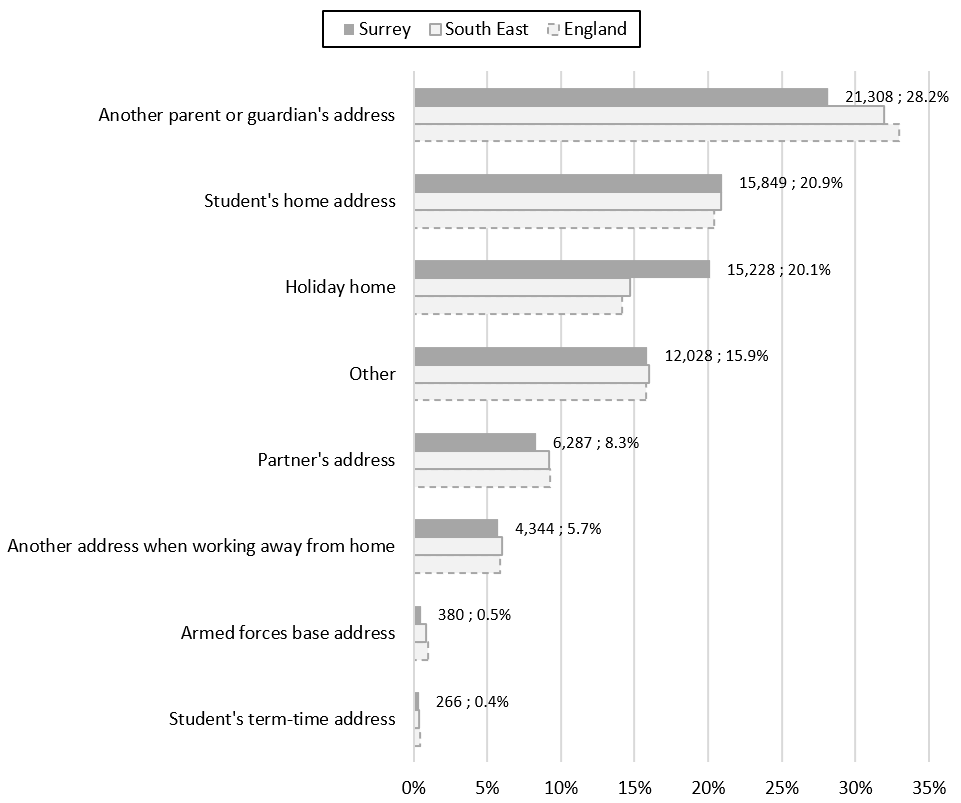
For those who stayed at a second address for more than 30 days per year, the Census then asked the purpose of this second address. In Surrey, the most common reasons for these second addresses were that it was another parent or guardian’s address (28.2%), a student’s home address (20.9%), or a holiday home (20.1%). However, these figures may not be representative of the behaviours outside of this time period as, due to the coronavirus (COVID-19) pandemic, students may have been more likely to remain at their parent or guardians’ address for the whole academic year and therefore may not have had a second term-time address.
A much lower proportion of the second addresses of the Surrey population were another parent or guardian’s address (28.2%) compared to the South East (31.9%) or England (33.0%). Holiday homes made up a higher proportion of second addresses in the Surrey population (20.1%) than the South East (14.7%) or England (14.2%).
The purpose of second addresses of the Surrey population, 2021
The Office for National Statistics has produced interactive maps for the 2021 Census results. The maps below show the distribution of people with second addresses and the types of second address.
Hover over the maps to see each of the area names and values. Zoom in and out of these maps to see the data at smaller geographical areas.