2021 Census: Unpaid Care
Unpaid care from the 2021 Census
The raw data from this Census release has been processed by the Population Insight Team and is also available on Surrey-i.
The Office for National Statistics produced interactive maps for the 2021 Census results. The ONS interactive map of the unpaid care statistics has been embedded at the bottom of this page.
Census 2021 asked “Do you look after, or give any help or support to, anyone because they have long-term physical or mental health conditions or illnesses, or problems related to old age?”. People were asked to exclude anything they did as part of their paid employment. The wording of the question differs from the 2011 Census question, which began “Do you look after, or give any help or support to family members, friends, neighbours or others”.
Census 2021 was undertaken during the coronavirus (COVID-19) pandemic, which may also have influenced how people perceived and undertook their provision of unpaid care and therefore may have affected how people chose to respond.
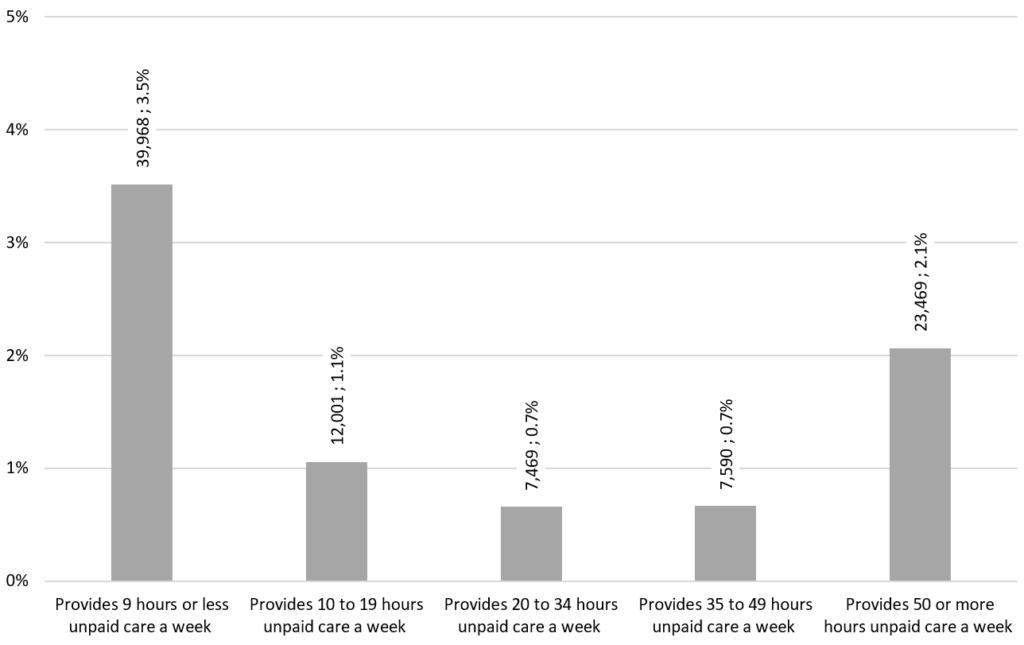
At the time of the 2021 Census, 90,497 residents reported that they provided unpaid care (8.0% of usual residents). The largest groups within unpaid carers were residents who provided 9 hours or less unpaid care a week (3.5% of the usual population, representing 39,968 residents) and residents who provided 50 or more hours of unpaid care a week (2.1% of the usual population, representing 23,469 residents).
Non age-standardised proportions of Surrey residents who provided unpaid care, 2021
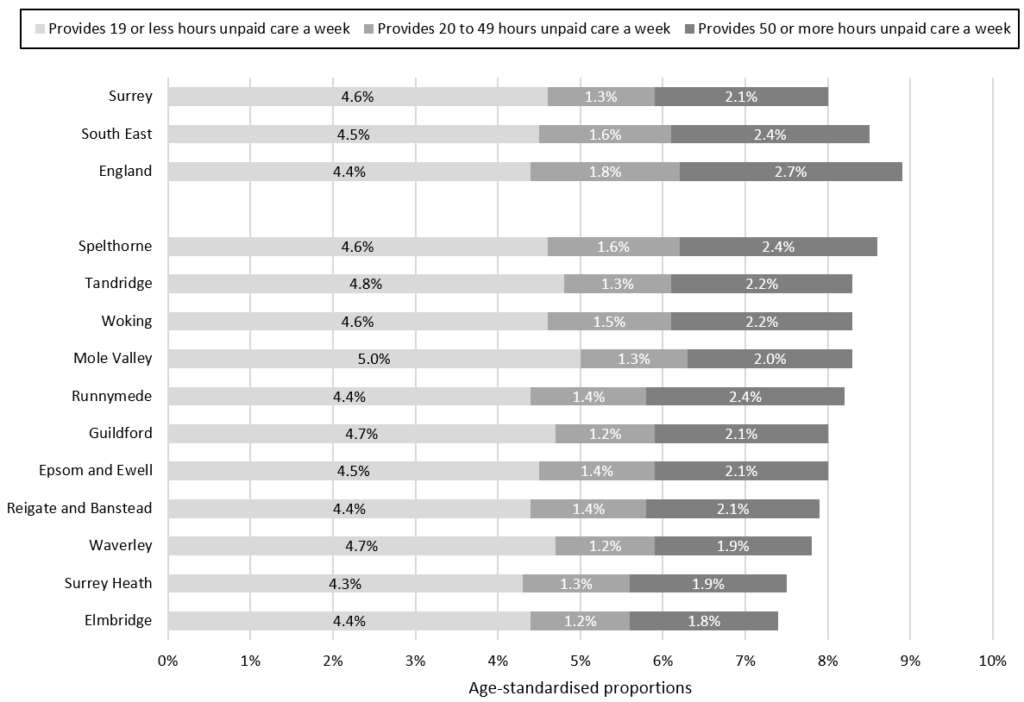
Health and age are closely related, with older people being more likely to be in poorer health. Age-standardised proportions (ASPs) account for different age structures in populations and are more appropriate than crude percentages when drawing comparisons over time and across areas.
When accounting for the age structure and population size, the proportion of Surrey residents who provided unpaid care (8.0%) was lower than the South East (8.5%) and England (8.9%) averages. Spelthorne had the highest age-standardised proportion of residents who provided unpaid care (8.6%), alongside the joint highest age-standardised proportion of residents who provided 50 or more hours of unpaid care a week with Runnymede at 2.4 per cent. Elmbridge had the lowest age-standardised percentage of residents who provided unpaid care at 7.4 per cent. The non age-standardised proportions are available on the data page and another graph below – these figures can be used when you are only concerned with looking at the level of unpaid care in one area and represent the ‘true’ proportions of residents.
Age-standardised proportions of residents of districts and boroughs in Surrey who provided unpaid care, 2021
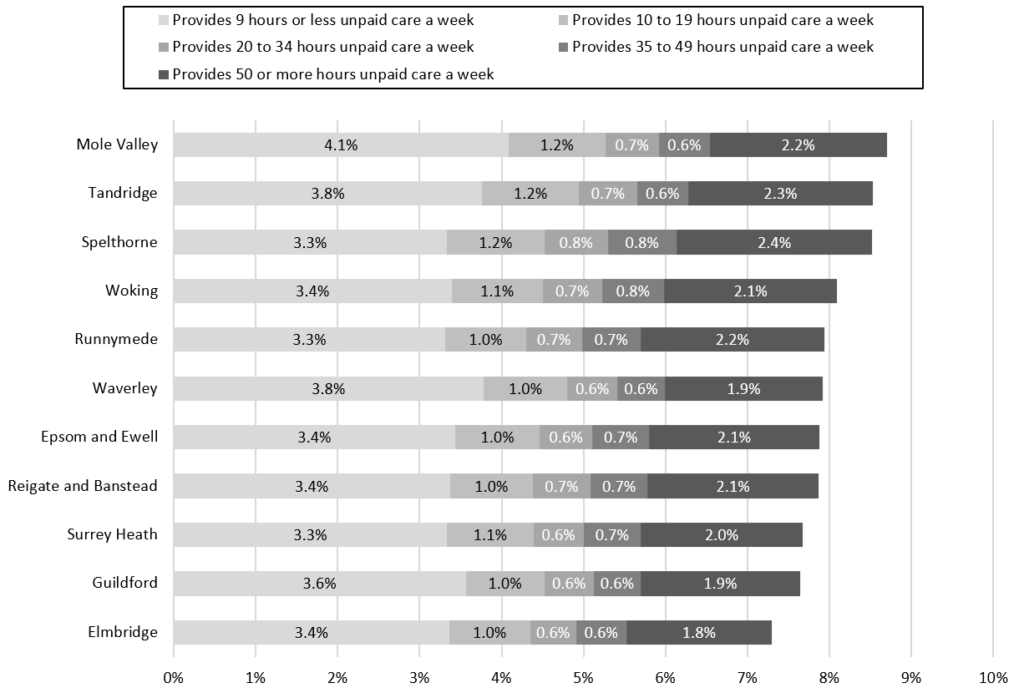
At the time of the 2021 Census, 8.0 per cent of Surrey residents provided unpaid care (unstandardised by age). These non age-standardised figures (which do not account for underlying differences in age structure) showed that Mole Valley had the highest proportion of residents who provided unpaid care at the time of the 2021 Census (8.7%). Mole Valley has a higher proportion of older residents which is likely to be why Mole Valley had the highest non age-standardised proportion but only the 4th highest age-standardised proportion. Spelthorne had the highest proportion of residents who provided 50 or more hours of unpaid care a week at 2.4 per cent. Elmbridge continued to have the lowest proportion of residents who provided unpaid care at 7.3 per cent.
Non age-standardised proportions of residents of districts and boroughs in Surrey who provided unpaid care, 2021
The Office for National Statistics has produced interactive maps for the 2021 Census results. The maps below show the distribution of unpaid care across residents.
Hover over the map to see each of the area names and values. Zoom in and out of these maps to see the data at smaller geographical areas.