Census 2021: Economic Activity
Economic Activity from the 2021 Census
The raw data from this Census release has been processed by the Population Insight Team and is also available on Surrey-i.
Contents
Not in employment (economically inactive)
Employment history (of those not in employment)
Long-term sick or disabled (economically inactive)
As stressed by the Office for National Statistics: ‘Census 2021 took place during the coronavirus (COVID-19) pandemic, a period of unparalleled and rapid change; the national lockdown, associated guidance and furlough measures will have affected the labour market topic.’ Therefore, caution should be applied when using these figures for planning and policy purposes.
Economic activity status
In Census 2021, everyone completing the census aged 16 years and over were asked to answer questions about their economic activity status. The questions asked whether a person was working or looking for work in the week before Census 2021.
There are three main types of economic activity status:
• economically active: in employment (an employee or self-employed),
• economically active: unemployed (those who were looking for work and could start within two weeks, or waiting to start a job that had been offered and accepted),
• economically inactive (those who did not have a job between 15 March and 21 March 2021 and had not looked for work between 22 February and 21 March 2021 or could not start work within two weeks)
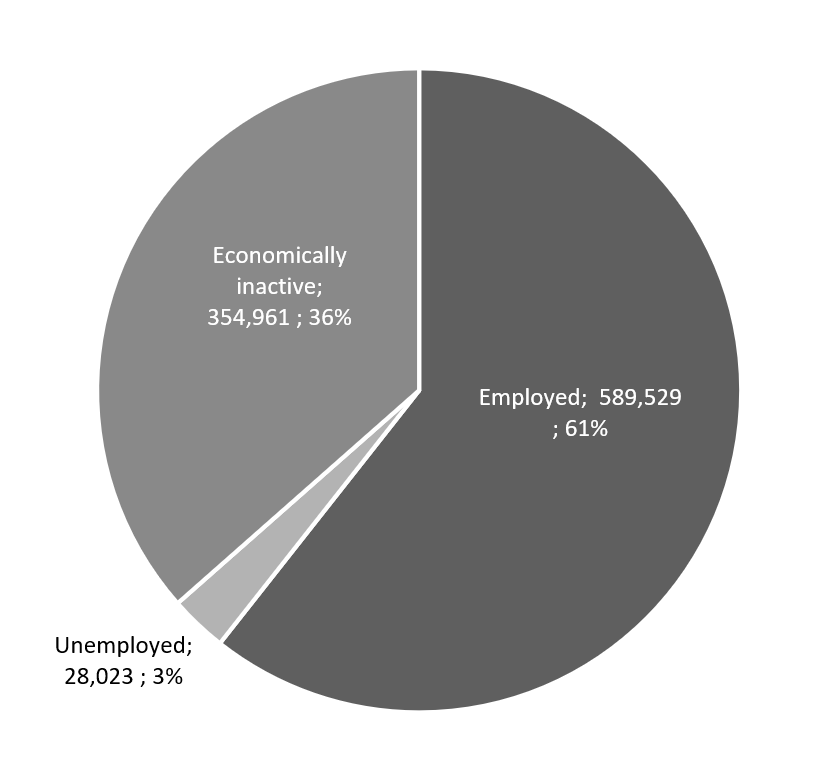
In Surrey, of the 972,515 usual residents aged 16 years and over, 589,529 residents were in employment (60.6%), 28,023 residents were unemployed (2.9%), and 354,961 residents were economically inactive (36.5%). The economically active population included people who were put on furlough at the time of Census 2021, who were considered to be temporarily away from work.
The economic activity status of Surrey residents during the week before the 2021 Census
Surrey had a higher proportion of residents aged 16 and over which were in employment the week before the 2021 Census (60.6%) than the South East (59.2%) and England (57.4%) as a whole. The proportion of residents who were in employment in Surrey districts and boroughs ranged from 58.5 per cent of residents in Guildford and Mole Valley to 63.6 per cent of residents in Woking.
The proportion of residents aged 16 and over who were in employment, unemployed, or economically active
| Local authority | % Economically active (In employment) | % Economically active (unemployed) | % Economically inactive |
|---|---|---|---|
| Surrey | 60.6% | 2.9% | 36.5% |
| Elmbridge | 61.6% | 2.8% | 35.6% |
| Epsom and Ewell | 61.8% | 2.8% | 35.4% |
| Guildford | 58.5% | 3.1% | 38.5% |
| Mole Valley | 58.5% | 2.3% | 39.1% |
| Reigate and Banstead | 62.5% | 2.8% | 34.7% |
| Runnymede | 58.4% | 3.6% | 38.0% |
| Spelthorne | 61.8% | 3.6% | 34.6% |
| Surrey Heath | 61.5% | 2.8% | 35.7% |
| Tandridge | 60.1% | 2.6% | 37.2% |
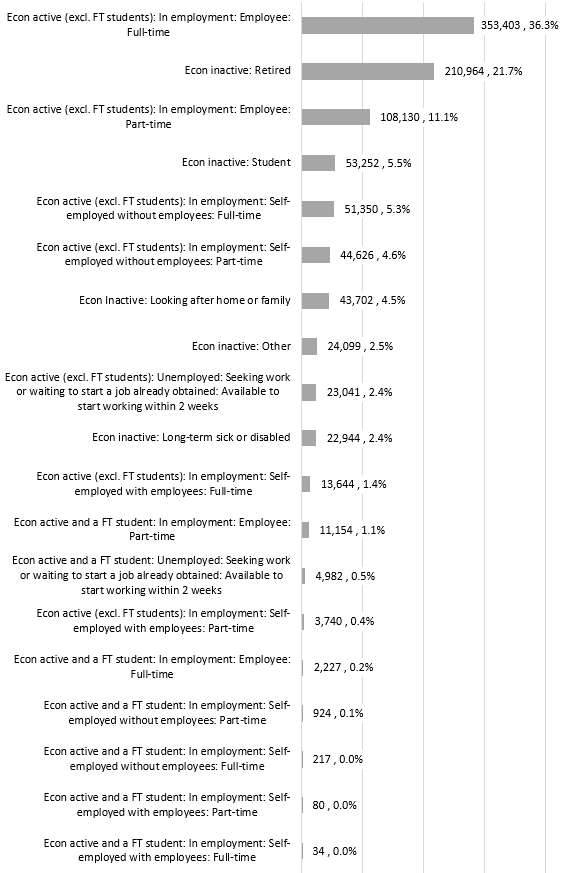
When looking at more detailed categories, the largest group in Surrey were residents in employment who were employees (not including full time students in employment), who represented 353,403 residents (36.3% of all residents aged 16 and over on Census Day). The second largest group of residents aged 16 and over in Surrey were retired and represented 210,964 residents (21.7%). The third largest group of Surrey residents were part-time employees (not including full-time students in part-time employment), who represented 108,130 residents (11.1%).
The proportion of Surrey residents aged 16 and over who were in employment, unemployed, or economically active by detailed category
Of all Surrey residents aged 16 and over, 47.5 per cent were an employee compared to 46.2 per cent of those aged 16 and above in England. An employee was defined as those who did paid work for a private individual, organisation or business; 474,914 Surrey residents reported that they were employees, which represented 81% of those who were in employment. Individuals who were self-employed or freelance were defined as those who owned and operated their own business, professional practice, or similar enterprise; 114,615 Surrey residents reported that they were self-employed or freelance, which represented 19% of those who were in employment.
Employed residents in Surrey were more likely to be self-employed or freelance compared to England. Just under 2 in every 10 Surrey residents (19.4%) who were employed reported that they were self-employed or freelance compared to 16.9 per cent of those employed in England. Within Surrey, Waverley had the highest proportion of residents in employment who were self-employed or freelance at 22.4 per cent compared to Spelthorne which had the lowest proportion at 16.6 per cent.
The proportion of employed Surrey residents who were self-employed or freelance, 2021
| Local authority | % Self-employed (of those in employment) | Total who were self-employed | Total who were employees |
|---|---|---|---|
| Waverley | 22.4% | 13,613 | 47,112 |
| Elmbridge | 22.3% | 14,912 | 52,068 |
| Mole Valley | 22.1% | 9,351 | 32,991 |
| Tandridge | 21.2% | 9,031 | 33,545 |
| Guildford | 18.6% | 13,005 | 56,769 |
| Epsom and Ewell | 18.6% | 7,417 | 32,493 |
| Reigate and Banstead | 18.4% | 13,825 | 61,299 |
| Runnymede | 18.1% | 7,685 | 34,771 |
| Woking | 17.8% | 9,377 | 43,367 |
| Surrey Heath | 17.2% | 7,821 | 37,543 |
| Spelthorne | 16.6% | 8,580 | 42,960 |
Within the 114,615 Surrey residents who were self-employed or freelance:
• 97,117 were self-employed without employees (representing 85% of those who were self-employed)
• 17,498 were self-employed with employees (representing 15% of those who were self-employed)
Elmbridge had the highest proportion of self-employed residents which had employees (16.9%), while Mole Valley had the lowest proportion (14.7%).
The proportion of Surrey residents who were self-employed or freelance with employees, 2021
| Local authority | Of those self-employed, % with employees | Total self-employed with employees | Total self-employed without employees |
|---|---|---|---|
| Elmbridge | 16.9% | 2,514 | 12,398 |
| Tandridge | 15.1% | 1,117 | 6,300 |
| Reigate and Banstead | 15.4% | 2,007 | 10,998 |
| Guildford | 13.9% | 1,300 | 8,051 |
| Waverley | 15.9% | 2,192 | 11,633 |
| Epsom and Ewell | 14.4% | 1,105 | 6,580 |
| Woking | 14.2% | 1,215 | 7,365 |
| Surrey Heath | 14.6% | 1,142 | 6,679 |
| Runnymede | 16.4% | 1,479 | 7,552 |
| Spelthorne | 15.1% | 2,051 | 11,562 |
| Mole Valley | 14.7% | 1,379 | 7,998 |
Not in employment (economically inactive)
At the time of the 2021 Census, 28,023 usual residents of Surrey were economically active and unemployed (2.9%). This included people who were looking for work and could start within two weeks, or waiting to start a job that had been offered and accepted.
The percentage of usual residents aged 16 years and over who were economically active and unemployed was lower in Surrey (2.9%) than the South East (3.0%) and England (3.5%). At the time of the 2021 Census, Runnymede and Spelthorne had the highest proportions of residents aged 16 and over who were unemployed at 3.6 per cent compared to Mole Valley and Waverley which had the lowest proportions at 2.3 per cent.
The table below also includes the total numbers of unemployed residents by whether they were also full-time students. Of the 28,023 unemployed residents of Surrey, 17.8 per cent were also full-time students (which represented 4,982 residents). Runnymede had one of the highest proportions of unemployed residents (3.6%), however, just under a third of these unemployed residents were also full-time students (30.4%). Guildford also had a high proportion of those unemployed also being full-time students (32.8%) which represent different employment requirements for these areas where individuals want to find work to go alongside their studies.
Unemployed Surrey residents, including whether residents were also full-time students
| Local authority | Of all residents, the % unemployed | Total unemployed | Of those unemployed, % who were FT students | Total unemployed who were FT students | Total unemployed (excluding FT students) |
|---|---|---|---|---|---|
| Surrey | 2.9% | 28,023 | 17.8% | 4,982 | 23,041 |
| Runnymede | 3.6% | 2,647 | 30.4% | 805 | 1,842 |
| Spelthorne | 3.6% | 3,015 | 13.0% | 393 | 2,622 |
| Guildford | 3.1% | 3,655 | 32.8% | 1,200 | 2,455 |
| Woking | 3.0% | 2,494 | 13.4% | 333 | 2,161 |
| Surrey Heath | 2.8% | 2,083 | 14.4% | 299 | 1,784 |
| Epsom and Ewell | 2.8% | 1,807 | 17.4% | 314 | 1,493 |
| Reigate and Banstead | 2.8% | 3,347 | 13.2% | 442 | 2,905 |
| Elmbridge | 2.8% | 3,020 | 11.2% | 338 | 2,682 |
| Tandridge | 2.6% | 1,876 | 12.5% | 235 | 1,641 |
| Mole Valley | 2.3% | 1,686 | 12.2% | 206 | 1,480 |
| Waverley | 2.3% | 2,396 | 17.5% | 419 | 1,977 |
| South East | 3.0% | 229,763 | 17.8% | 40,871 | 188,892 |
| England | 3.5% | 1,596,288 | 17.8% | 283,559 | 1,312,729 |
Employment history (of those not in employment)
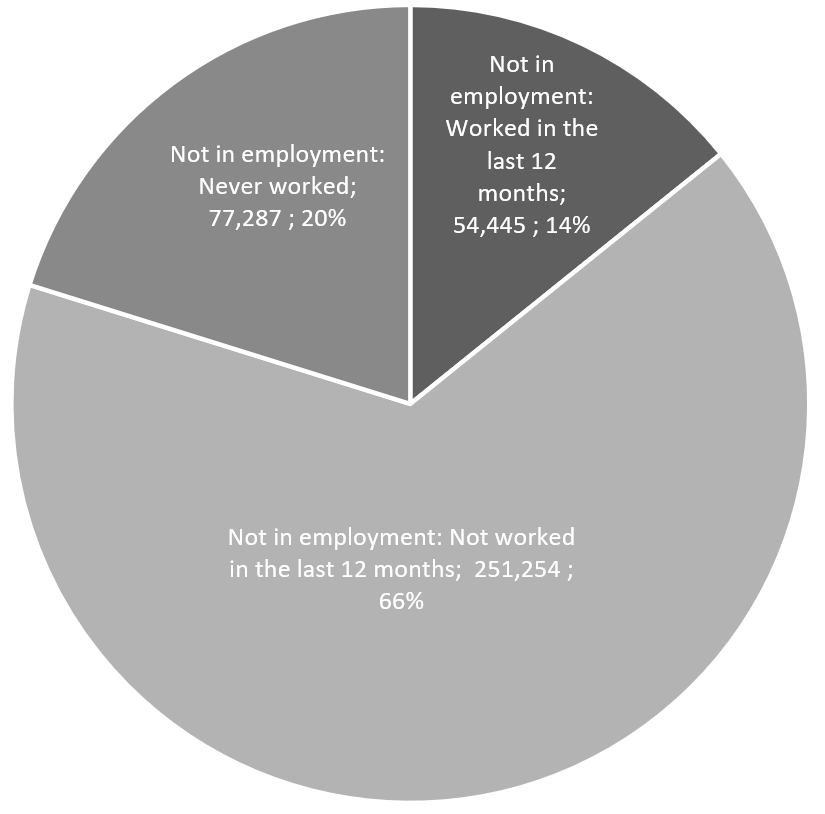
Residents who were unemployed on the 2021 Census Day were also asked how long they had been unemployed for. Two thirds of Surrey residents who were unemployed on Census Day had not worked in the last 12 months (66%, which represented 251,254 residents), a longer-term period of unemployment. Contrastingly, 14 per cent of those unemployed on Census Day in March 2021 had worked in the last 12 months and so this group had a shorter period of unemployment (which represented 54,445 residents). Of those unemployed at the time of the Census, 20 per cent had never worked (which represented 77,287 Surrey residents).
The work history of Surrey residents who were unemployed at the time of the 2021 Census
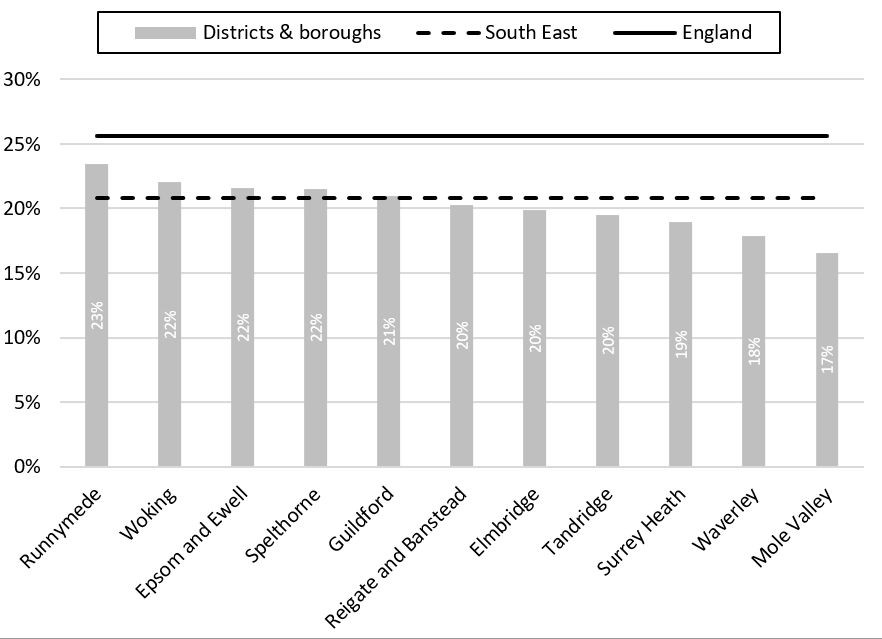
Surrey had a lower proportion of unemployed residents who had never worked (20%) than the South East (21%) and England (26%). Every district and borough in Surrey had lower proportions of unemployed residents who had never worked than the England average, and only four districts and boroughs (Runnymede, Woking, Epsom and Ewell, Spelthorne, and Guildford) had higher proportions than the South East average.
Within Surrey districts and boroughs, Runnymede had the highest proportion of unemployed residents who had never worked at 23 per cent, compared to Mole Valley which had the lowest at 17 per cent.
Of those who were unemployed at the time of the 2021 Census, the percentage of Surrey residents who had never worked
Within Surrey residents who were unemployed at the time of the 2021 Census, Mole Valley had the highest proportion of residents who had not worked in the last 12 months (71.6%), compared to 60 per cent of those unemployed in Guildford. Guildford also had the highest proportion of unemployed residents who had not worked in the last 12 months, suggesting a general shorter period of unemployment for these residents compared to other areas of Surrey such as Mole Valley.
The work history of residents who were unemployed at the time of the 2021 Census
| Local authority | Of those not in employment, % worked in the last 12 months | Of those not in employment, % not worked in the last 12 months | Of those not in employment, % never worked | Total not in employment who worked in the last 12 months | Total not in employment who had not worked in the last 12 months | Total not in employment who had never worked |
|---|---|---|---|---|---|---|
| Surrey | 14.2% | 65.6% | 20.2% | 54,445 | 251,254 | 77,287 |
| Elmbridge | 13.0% | 67.1% | 19.8% | 5,454 | 28,046 | 8,294 |
| Epsom and Ewell | 13.4% | 65.0% | 21.6% | 3,307 | 16,058 | 5,334 |
| Guildford | 19.1% | 60.0% | 20.9% | 9,447 | 29,752 | 10,383 |
| Mole Valley | 11.8% | 71.6% | 16.6% | 3,552 | 21,471 | 4,975 |
| Reigate and Banstead | 13.3% | 66.4% | 20.3% | 5,983 | 29,894 | 9,125 |
| Runnymede | 17.9% | 58.7% | 23.4% | 5,424 | 17,754 | 7,083 |
| Spelthorne | 14.7% | 63.8% | 21.5% | 4,663 | 20,315 | 6,845 |
| Surrey Heath | 13.6% | 67.4% | 18.9% | 3,873 | 19,165 | 5,381 |
| Tandridge | 11.6% | 68.8% | 19.5% | 3,290 | 19,446 | 5,516 |
| Waverley | 12.2% | 69.9% | 17.9% | 5,248 | 29,987 | 7,678 |
| Woking | 13.9% | 64.0% | 22.1% | 4,204 | 19,362 | 6,674 |
| South East | 13.6% | 65.5% | 20.8% | 420,077 | 2,020,237 | 642,487 |
| England | 13.2% | 61.1% | 25.6% | 2,592,965 | 11,983,992 | 5,024,786 |
Economically inactive
People aged 16 years and over were economically inactive if, in the week before Census 2021, they were not in employment, and they were:
• not looking for work
• looking for work, but were not able to start work in the next two weeks
The reason why they were inactive was recorded as being one of the following:
• retired (whether receiving a pension or not)
• studying
• looking after home or family
• long-term sick or disabled
• another reason
Over one third of Surrey residents aged 16 and over were economically inactive around the time of the 2021 Census. A lower proportion of those aged 16 and over were economically inactive in Surrey (36.5%) than in the South East (37.8%) or England (39.1%). Mole Valley and Waverley had the highest proportions of residents aged 16 and over who were economically inactive (39.1%), which represented 28,311 and 40,518 residents respectively. Woking had the lowest proportion of residents aged 16 and over who were economically inactive (33.4%).
Economically inactive residents of Surrey aged 16 and over, 2021
| Local authority | % Economically inactive | Total economically inactive |
|---|---|---|
| Surrey | 36.5% | 354,961 |
| Mole Valley | 39.1% | 28,311 |
| Waverley | 39.1% | 40,518 |
| Guildford | 38.5% | 45,927 |
| Runnymede | 38.0% | 27,616 |
| Tandridge | 37.2% | 26,375 |
| Surrey Heath | 35.7% | 26,338 |
| Elmbridge | 35.6% | 38,774 |
| Epsom and Ewell | 35.4% | 22,890 |
| Reigate and Banstead | 34.7% | 41,656 |
| Spelthorne | 34.6% | 28,808 |
| Woking | 33.4% | 27,746 |
| South East | 37.8% | 2,853,040 |
| England | 39.1% | 18,005,455 |
Respondents who were economically inactive at the time of the 2021 Census were asked for the reason behind their economic inactivity. Of the 354,961 economically inactive residents of Surrey, 210,964 residents were retired (which represented 59.4% of the economically inactive population and 21.7% of the wider Surrey population).
Residents who reported that they were economically inactive due to studying or being a student represented 15.0 per cent of the economically inactive population and 5.5 per cent of the wider Surrey population. These figures only include students who are classified as economically inactive, and therefore do not include students in employment or looking for work. The section focusing on students includes all of these figures in one place.
Surrey residents who were economically inactive due to looking after the home or family consisted of 43,702 individuals, which represented 12.3 per cent of economically inactive residents and 4.5 per cent of all Surrey residents aged 16 and over.
The breakdown of reasons for being economically inactive at the time of the 2021 Census
| Local authority | Surrey total who cited: | Of all Surrey residents, % who cited: | Of all South East residents, % who cited: | Of all England residents, % who cited: |
|---|---|---|---|---|
| Retired | 210,964 | 21.7% | 22.5% | 21.5% |
| Student* | 53,252 | 5.5% | 5.1% | 5.6% |
| Looking after home or family | 43,702 | 4.5% | 4.4% | 4.8% |
| Long-term sick or disabled | 22,944 | 2.4% | 3.1% | 4.1% |
| Other | 24,099 | 2.5% | 2.7% | 3.1% |
*This table only includes students who were classified as economically inactive (and so does not include students who were in employment or unemployed at the time of the 2021 Census). The following section focuses on students & includes such figures.
Students
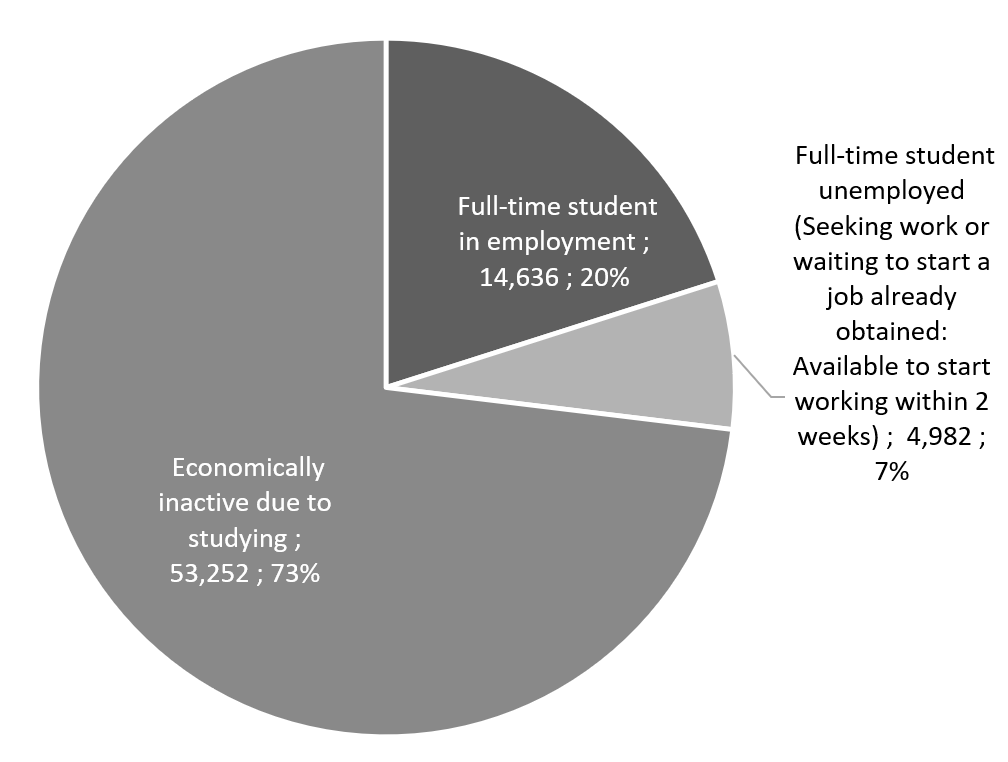
There were 72,870 students who were residents of Surrey at the time of the 2021 Census. This figure includes full-time students who were considered economically inactive (i.e. not looking for work) and those who are either in work or looking for work. This is also why this figure is higher than other totals which only consider economically inactive students.
While nearly three quarters of students in Surrey were economically inactive; 14,636 full-time students were in employment (20% of all students) and 4,982 full-time students were unemployed (7% of all students).
The breakdown of Surrey residents who are students by economic activity, 2021
Long-term sick or disabled (economically inactive)
When capturing the economically inactive population, respondents were asked the reason for their economic inactivity and some noted that their reason was due to long-term sickness or disability.
In Surrey, 22,944 residents were economically inactive at the time of the 2021 Census due to long-term sickness or disability. This group makes up a lower proportion of all residents aged 16 and above in Surrey (2.4%) compared to the South East (3.1%) and England (4.1%).
It is important to keep in mind that these figures do not include all residents with long-term sickness or disability because not all residents who are long-term sick or have a disability are out of work.
Residents who were economically inactive due to long-term sickness or disability, 2021
| Local authority | % Economically inactive due to long-term sickness or disability (out of all residents) | Total long-term sick or disabled |
|---|---|---|
| Surrey | 2.4% | 22,944 |
| Elmbridge | 2.0% | 2,125 |
| Spelthorne | 2.8% | 2,332 |
| Reigate and Banstead | 2.7% | 3,234 |
| Tandridge | 2.6% | 1,816 |
| Mole Valley | 2.6% | 1,849 |
| Woking | 2.4% | 2,011 |
| Waverley | 2.3% | 2,405 |
| Epsom and Ewell | 2.3% | 1,463 |
| Runnymede | 2.2% | 1,597 |
| Surrey Heath | 2.2% | 1,594 |
| Guildford | 2.1% | 2,519 |
| South East | 3.1% | 234,601 |
| England | 4.1% | 1,874,300 |