Census 2021: Main Language
Main Language and Proficiency from the 2021 Census
Headlines
• In 2021, 93.1 per cent of Surrey residents aged 3 and above reported English as their main language.
• The top five main languages in Surrey were English, Polish, Romanian, Portuguese, and Spanish.
• Of all households in Surrey, 3.5 per cent (17,050 households) did not have a resident whose main language was English and 1.1 per cent (5,451 households) included adults whose main language was not English alongside at least one resident aged 3 to 15 whose main language was English.
• 12.3 per cent of Surrey residents with a main language other than English could not speak English well or at all (representing 0.8 per cent of all Surrey residents aged 3 and over).
The raw data from this Census release has been processed by the Population Insight Team and is also available on Surrey-i.
Contents
Main Language
Multiple Main Languages
Proficiency in English Language
Main Language
On the 2021 Census Day, 93.1 per cent of Surrey residents aged 3 and above reported English as their main language. A main language is a person’s first or preferred language. The Surrey population who reported a language other than English as their main language represented 80,799 residents (6.9%).
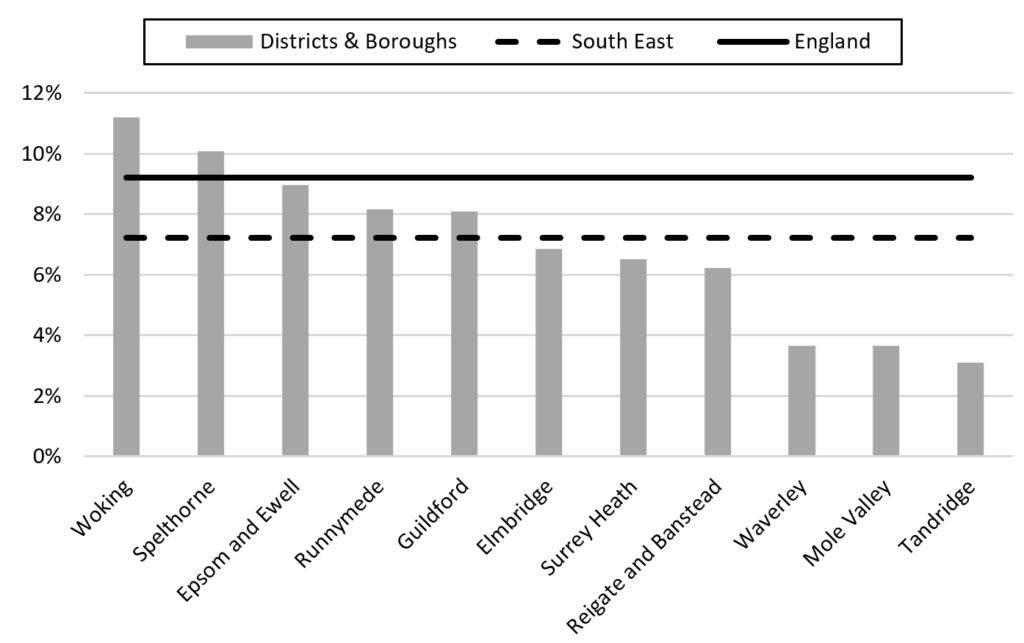
Five of the eleven Surrey districts and boroughs had a higher proportion of residents aged 3 and over with a main language other than English compared to the South East average. However, only two of the eleven districts and boroughs in Surrey had a higher proportion of residents with a main language other than English than the England average; the first being Woking at 11.2 per cent and the second being Spelthorne at 10.1 per cent.
Percentage of Surrey residents aged 3 and over whose main language was not English in 2021
The most common main language other than English of Surrey residents was Polish during both 2011 and 2021. Between 2011 and 2021, Romanian, Hungarian, and Bulgarian all saw growth which meant they entered the top ten main languages of Surrey residents in 2021. It is important to note that these individuals may also be able to speak English to some degree, but that they reported that their ‘main language’ was not English. Proficiency at spoken English is looked into later in this summary.
The top ten main languages spoken in Surrey (by those aged 3 and over), excluding English
| Main language | 2011 Count | 2011 Rank | 2021 Count | 2021 Rank |
|---|---|---|---|---|
| Polish | 6,634 | 1st | 7,871 | 1st |
| Romanian | 973 | 22nd | 6,239 | 2nd |
| Portuguese | 3,056 | 4th | 5,924 | 3rd |
| Spanish | 3,247 | 2nd | 4,484 | 4th |
| Italian | 2,546 | 7th | 3,335 | 5th |
| Urdu | 2,585 | 6th | 3,229 | 6th |
| Hungarian | 1,395 | 16th | 2,739 | 7th |
| All other Chinese | 3,072 | 3rd | 2,472 | 8th |
| Nepalese | 1,781 | 11th | 2,457 | 9th |
| Bulgarian | 728 | 30th | 2,347 | 10th |
The top five languages, outside of English, that were reported as the main language of Surrey residents were all European. Just under 1 per cent of Surrey residents reported Polish as their main language in 2021, representing 7,871 individuals.
Languages with more than 1,000 speakers in Surrey, by number of residents aged 3 and over
| Main language | 2021 Count | 2021 % |
|---|---|---|
| Polish | 7,871 | 0.7% |
| Romanian | 6,239 | 0.5% |
| Portuguese | 5,924 | 0.5% |
| Spanish | 4,484 | 0.4% |
| Italian | 3,335 | 0.3% |
| Urdu | 3,229 | 0.3% |
| Hungarian | 2,739 | 0.2% |
| All other Chinese | 2,472 | 0.2% |
| Nepalese | 2,457 | 0.2% |
| Bulgarian | 2,347 | 0.2% |
| Arabic | 2,299 | 0.2% |
| Panjabi | 2,298 | 0.2% |
| Tamil | 2,242 | 0.2% |
| French | 2,226 | 0.2% |
| Tagalog or Filipino | 2,086 | 0.2% |
| Russian | 2,043 | 0.2% |
| Bengali (with Sylheti and Chatgaya) | 1,588 | 0.1% |
| Greek | 1,507 | 0.1% |
| Turkish | 1,477 | 0.1% |
| Malayalam | 1,470 | 0.1% |
| Cantonese Chinese | 1,276 | 0.1% |
| Gujarati | 1,270 | 0.1% |
| German | 1,204 | 0.1% |
| Persian or Farsi | 1,156 | 0.1% |
| Lithuanian | 1,107 | 0.1% |
| Hindi | 1,074 | 0.1% |
Multiple Main Languages
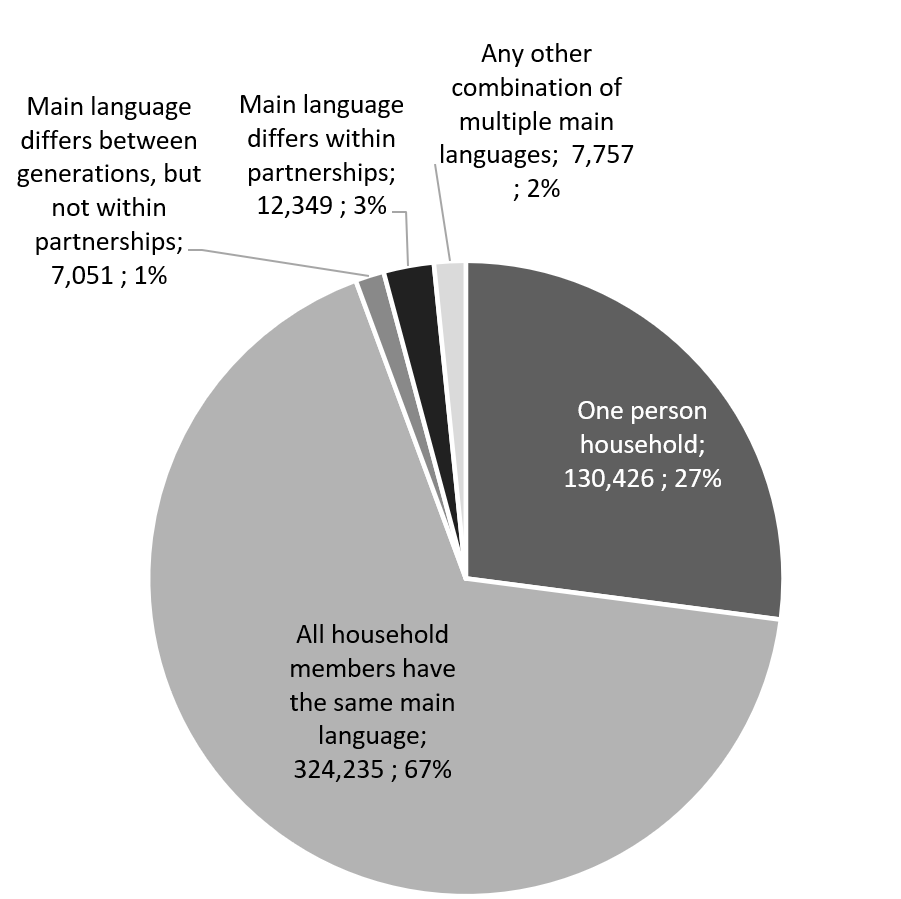
The Census enables us to view the language or combination of languages used within Surrey households. Around two thirds of households included members with the same main language (67%) and 27 per cent of households included only one person. Therefore, just 6 per cent of all Surrey households included multiple residents with a combination of more than one main language, representing 27,157 households.
Households in Surrey by main language
The next table shows that 91.2 per cent of households included adults with only English as their main language, which was slightly higher than the English average of 89.3 per cent. Contrastingly, 3.5 per cent of Surrey households (17,050 households) did not have a resident whose main language was English, which was lower than the England average of 5.0 per cent. In addition, 1.1 per cent of households (5,451 households) included adults whose main language was not English alongside at least one resident aged 3 to 15 whose main language was English.
Woking (6.0%) and Spelthorne (5.5%) had the highest proportion of households without a resident whose main language was English. Tandridge had the smallest proportion of households without a resident whose main language was English at just 1.3 per cent.
Main language in Surrey households
| Local authority | All adults in household have English as a main language | At least one but not all adults in household have English as a main language | No adults in household, but at least one person aged 3 to 15 years, has English as a main language | No people in household have English as a main language |
|---|---|---|---|---|
| Surrey | 91.2% | 4.2% | 1.1% | 3.5% |
| Elmbridge | 90.5% | 4.6% | 1.2% | 3.6% |
| Epsom and Ewell | 88.4% | 5.6% | 1.8% | 4.3% |
| Guildford | 90.3% | 4.5% | 1.1% | 4.1% |
| Mole Valley | 95.0% | 2.7% | 0.5% | 1.8% |
| Reigate and Banstead | 91.7% | 3.8% | 1.2% | 3.3% |
| Runnymede | 89.8% | 4.8% | 1.2% | 4.2% |
| Spelthorne | 87.8% | 4.9% | 1.8% | 5.5% |
| Surrey Heath | 91.8% | 4.0% | 1.1% | 3.1% |
| Tandridge | 95.8% | 2.4% | 0.5% | 1.3% |
| Waverley | 95.2% | 2.6% | 0.5% | 1.8% |
| Woking | 85.9% | 6.3% | 1.8% | 6.0% |
| South East | 91.4% | 3.6% | 1.2% | 3.8% |
| England | 89.3% | 4.3% | 1.4% | 5.0% |
Proficiency in English Language
As stated above, reporting a main language as something other than English did not mean that the individual could not speak English or that their proficiency at English was low. Therefore, the Census also captured the proficiency at English of individuals whose main language was not English.
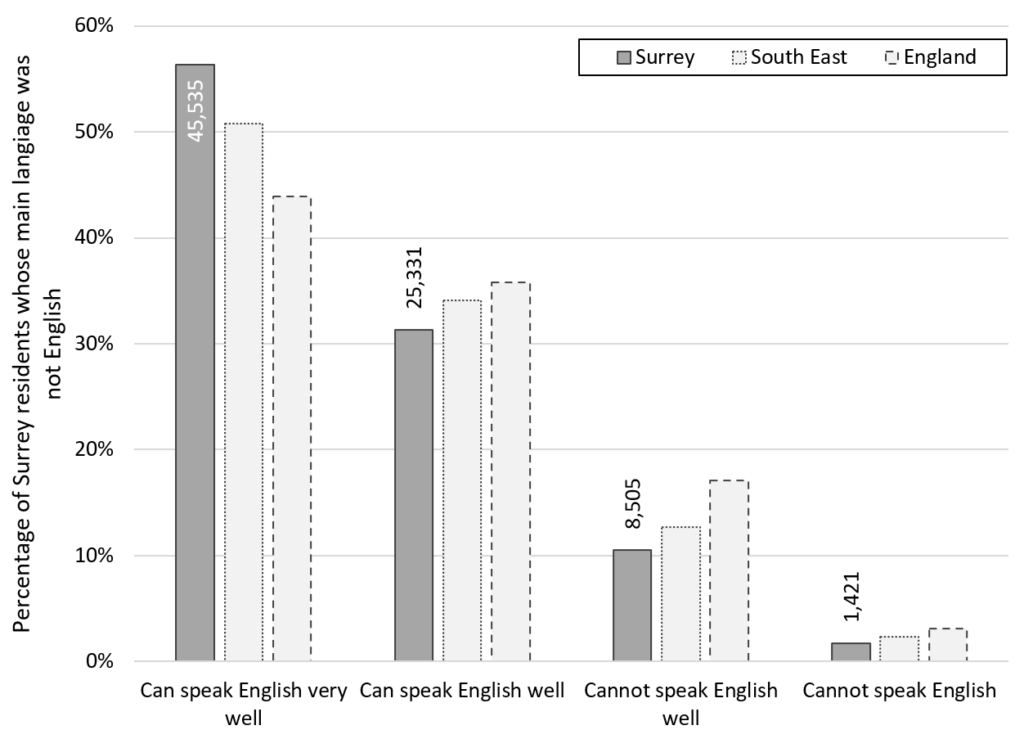
Of the 80,792 residents of Surrey (6.9%) whose main language was something other than English, over half (56.4%) reported that they could speak English ‘very well’ and 31.4 per cent reported they could speak English ‘well’. Therefore, 12.3 per cent of Surrey residents with a main language other than English could not speak English well or at all.
Individuals in Surrey with a non-English main language were less likely to not be able to speak English well or be able to speak English at all compared to their counterparts in the South East (15.1%) and England (20.2%) as a whole. In other words, Surrey residents with a non-English main language generally had a higher level of English language proficiency than the wider local area.
However, Surrey residents who could not speak English at all still represented 1,421 residents (1.8% of residents whose main language was non-English) while 8,505 residents could not speak English well (10.5% of residents whose main language was non-English).
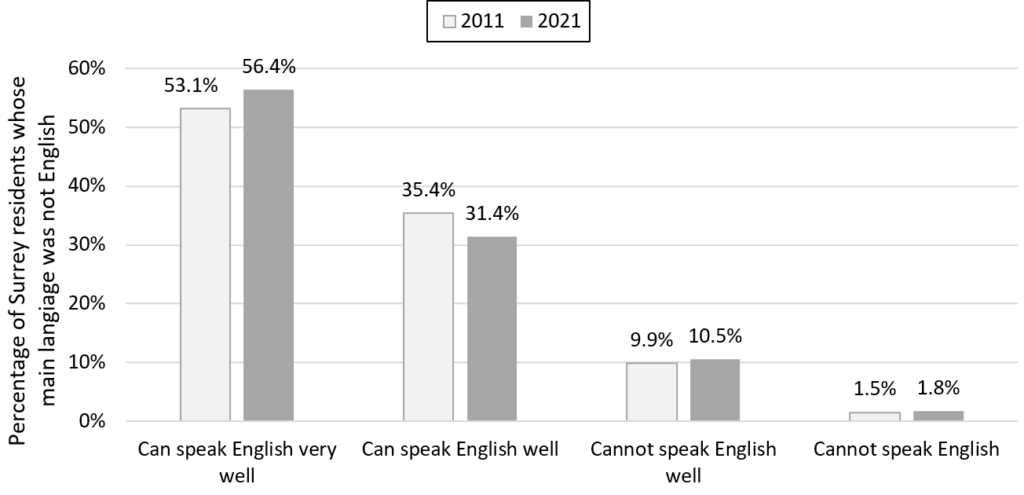
Proficiency in English of those whose main language was not English, 2021
The percentage of residents whose main language was something other than English who could speak English very well slightly increased between the 2011 and 2021 Censuses in Surrey (from 53.1% to 56.4%). However, these improvements appear to have been from the slight reduction in those who can speak English well, rather than improvements which would cause a reduction in those who cannot speak English well or at all. Instead, the percentage of residents whose main language was non-English who could not speak English well or at all rose slightly from 11.4 per cent in 2011 to 12.3 per cent in 2021.
Proficiency in English of those whose main language was not English, 2011 and 2021
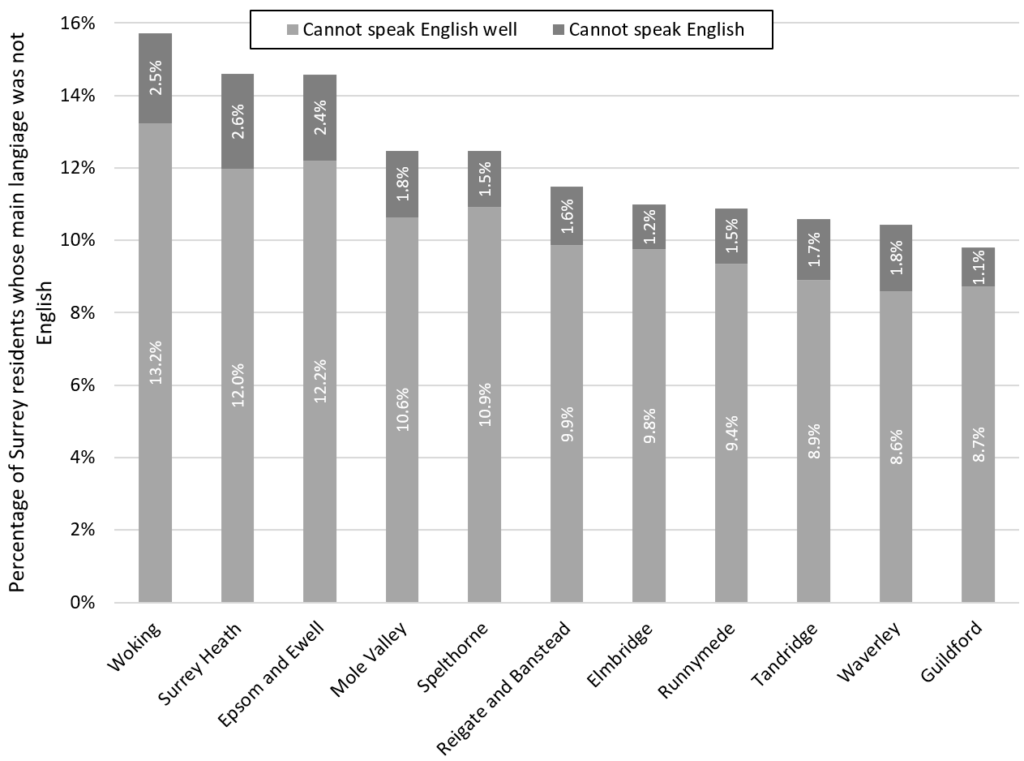
Woking had the highest percentage of residents whose main language was not English who could not speak English well or at all (15.7%), followed by Surrey Heath (14.6%) and Epsom and Ewell (14.6%).
Within residents whose main language was not English, Woking residents were also the most likely to not be able to speak English well at 13.4 per cent compared to just 8.6 per cent of those in Waverley.
Surrey Heath residents whose main language was not English were the most likely to not be able to speak English at all (2.6%), followed by Woking (2.5%) and Epsom and Ewell (2.4%).
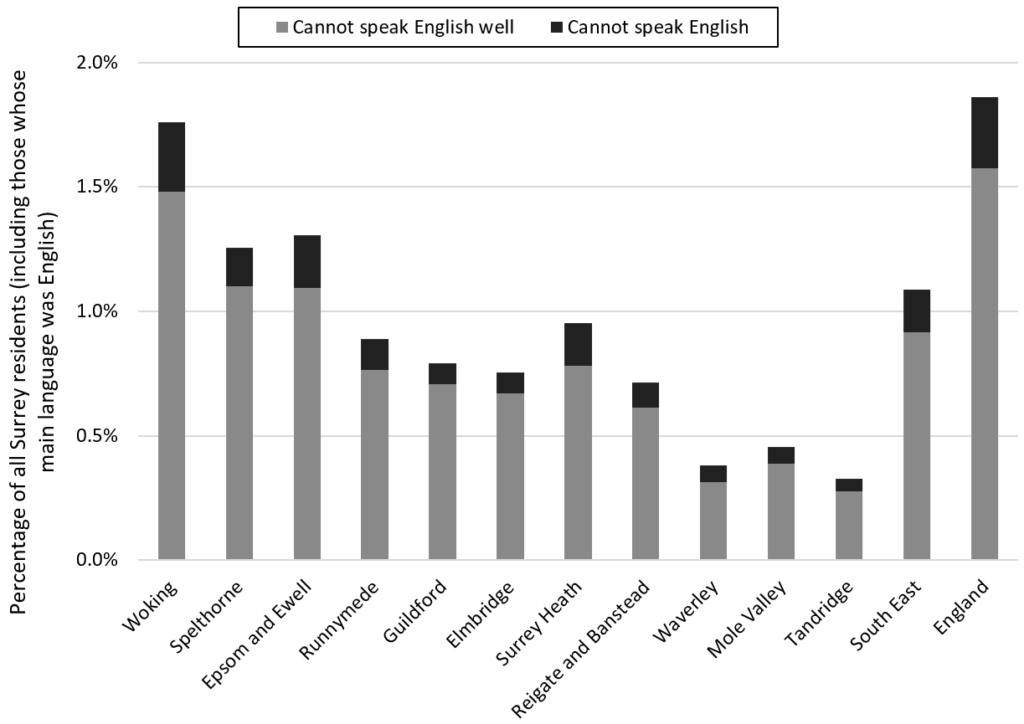
The proportion of Surrey residents whose main language was not English who cannot speak English well or cannot speak English, 2021
The proportion of residents whose main language was not English by proficiency at English, 2021
| Local authority | % Can speak English very well | % Can speak English well | % Cannot speak English well | % Cannot speak English | Cannot speak English well (Count) | Cannot speak English (count) |
|---|---|---|---|---|---|---|
| Surrey | 56.4% | 31.4% | 10.5% | 1.8% | 8,505 | 1,421 |
| Elmbridge | 58.7% | 30.3% | 9.8% | 1.2% | 5,395 | 2,782 |
| Epsom and Ewell | 54.2% | 31.2% | 12.2% | 2.4% | 3,804 | 2,187 |
| Guildford | 58.7% | 31.5% | 8.7% | 1.1% | 6,639 | 3,557 |
| Mole Valley | 55.4% | 32.2% | 10.6% | 1.8% | 1,722 | 1,001 |
| Reigate and Banstead | 58.8% | 29.7% | 9.9% | 1.6% | 5,333 | 2,690 |
| Runnymede | 58.1% | 31.0% | 9.4% | 1.5% | 4,045 | 2,160 |
| Spelthorne | 54.9% | 32.6% | 10.9% | 1.5% | 5,501 | 3,272 |
| Surrey Heath | 54.5% | 30.9% | 12.0% | 2.6% | 3,125 | 1,769 |
| Tandridge | 61.4% | 28.0% | 8.9% | 1.7% | 1,614 | 735 |
| Waverley | 58.3% | 31.3% | 8.6% | 1.8% | 2,657 | 1,426 |
| Woking | 50.8% | 33.5% | 13.2% | 2.5% | 5,700 | 3,754 |
| South East | 50.8% | 34.1% | 12.7% | 2.4% | 82,360 | 15,252 |
| England | 43.9% | 35.8% | 17.1% | 3.1% | 861,288 | 156,892 |
The following graph has been made to present the prevalence of individuals with little to no spoken English within the wider population. These figures do not include English literacy rates and only focus on the ability to speak English within those whose main language was not English. These figures therefore do not represent individuals whose main language is English but have poor spoken English as this is not captured by this dataset.
Within the whole of Surrey aged 3 and over, residents who could not speak English well or at all (with a non-English main language) represented 0.8 percent of the population.
Within the Woking population aged 3 and over, 1.8 per cent of all residents could not speak English well or could not speak English (with a non-English main language) at all in 2021. In contrast, just 0.4 per cent of all Tandridge residents aged 3 and over could not speak English well or at all (with a non-English main language) in 2021.
The prevalence of residents who could not speak English well or at all within the whole population (including those whose main language was English)