Census 2021: National Identity
National Identity from the 2021 Census
Headlines
- Every 9 in 10 Surrey residents reported their national identity as something which was only UK-based, with British only being the most popular specific identity (57.5%).
- 8.5 per cent of Surrey residents reported a non-UK identity and 2.5 per cent reported a a combination of a non-UK identity alongside a UK-based identity.
The raw data from this Census release has been processed by the Population Insight Team and is also available on Surrey-i.
‘Someone’s national identity is a self-determined assessment of their own identity; it could be the country or countries where they feel they belong or think of as home. It is not dependent on ethnic group or citizenship. This census question was introduced in 2011. As the question allows respondents to select all identities that apply, some individuals may have more than one national identity and the term “only” is used to refer to respondents classified with a single national identity.’
Around 89 per cent of Surrey residents reported their identity as just UK-based. More than half of Surrey residents chose a British only national identity (57.5%), alongside 15.2 per cent of residents who chose an English only identity and 13.7 per cent who chose a combination of an English and British only identity.
Surrey residents who only reported a non-UK identity represented 8.5 per cent of the population (102,152). Residents with a combination of a non-UK identity alongside a UK-based identity represented 2.5 per cent of the Surrey population (30,354).
A slightly lower proportion of Surrey residents reported a non-UK based identity only (8.5%) compared to the England average (9.5%).
National identity of Surrey residents, 2021
| National identity | Percentage (%) | Count | England (%) |
|---|---|---|---|
| % British only identity | 57.5% | 691,531 | 56.8% |
| % English only identity | 15.2% | 182,972 | 15.3% |
| % English and British only identity | 13.7% | 165,355 | 14.3% |
| % Other identity only | 8.5% | 102,152 | 9.5% |
| % Other identity and at least one UK identity | 2.5% | 30,354 | 1.9% |
| % Irish only identity | 0.7% | 8,141 | 0.5% |
| % Scottish only identity | 0.4% | 5,243 | 0.4% |
| % Welsh only identity | 0.4% | 4,372 | 0.3% |
| % Scottish and British only identity | 0.3% | 3,191 | 0.2% |
| % Any other combination of only UK identities | 0.2% | 2,855 | 0.2% |
| % Welsh and British only identity | 0.2% | 2,466 | 0.2% |
| % Irish and at least one UK identity | 0.1% | 1,739 | 0.1% |
| % Northern Irish only identity | 0.1% | 1,665 | 0.1% |
| % Northern Irish and British only identity | 0.1% | 876 | 0.1% |
| % Cornish only identity | 0.0% | 166 | 0.2% |
| % Cornish and British only identity | 0.0% | 30 | 0.0% |
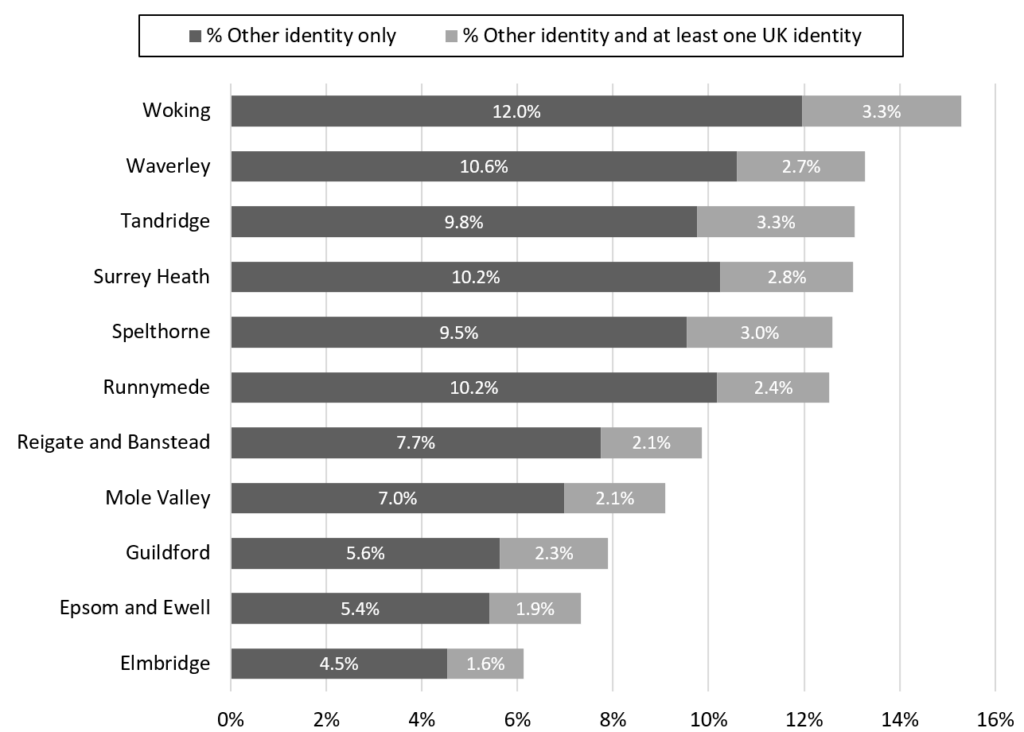
Woking had the highest proportion of residents whose identity contained a non-UK identity (including those with a mixture of non-UK and UK identities) at 15.3 per cent, while the smallest proportion of such residents were found in Elmbridge at 6.1 per cent.
Woking also had the highest proportion of residents with only non-UK identities at 12.0 per cent, followed by Waverley at 10.6 per cent, Surrey Heath at 10.2 per cent, and Runnymede at 10.2 per cent.
Woking and Tandridge had the highest proportion of residents with a combination of non-UK identities and at least one UK identity at 3.3 per cent.
Non-UK national identities of Surrey residents, 2021
The top 20 detailed national identities of Surrey residents, 2021
| National identity | Percentage (%) | Count |
|---|---|---|
| UK identity: British only identity | 57.5% | 691,531 |
| UK identity: English only identity | 15.2% | 182,972 |
| UK identity: English and British only identity | 13.7% | 165,355 |
| UK identity: Other identity and at least one UK identity | 2.5% | 30,354 |
| Other identity only: European: Non-EU countries: Other European | 0.8% | 9,356 |
| Other identity only: Irish only identity | 0.7% | 8,141 |
| Other identity only: European: EU countries: Polish | 0.7% | 7,899 |
| Other identity only: European: EU countries: Other member countries | 0.6% | 7,772 |
| Other identity only: Middle Eastern and Asian: Southern Asian: Indian | 0.6% | 6,749 |
| Other identity only: European: EU countries: Romanian | 0.5% | 6,283 |
| Other identity only: European: EU countries: Other member countries in March 2001 | 0.5% | 5,731 |
| Other identity only: European: EU countries: Italian | 0.4% | 5,394 |
| UK identity: Scottish only identity | 0.4% | 5,243 |
| Other identity only: European: EU countries: Portuguese | 0.4% | 4,898 |
| UK identity: Welsh only identity | 0.4% | 4,372 |
| Other identity only: European: EU countries: Spanish (including Canary Islander) | 0.3% | 3,395 |
| Other identity only: African: South and Eastern African: South African | 0.3% | 3,307 |
| UK identity: Scottish and British only identity | 0.3% | 3,191 |
| Other identity only: American and Caribbean: North American: US Citizen | 0.2% | 2,897 |
| Other identity only: European: EU countries: French | 0.2% | 2,871 |