Census 2021: Occupation
Occupation from the 2021 Census
The raw data from this Census release has been processed by the Population Insight Team and is also available on Surrey-i in more detail.
Contents
Occupation
National Statistics Socio-economic Classification
As stressed by the Office for National Statistics: ‘Census 2021 took place during the coronavirus (COVID-19) pandemic, a period of unparalleled and rapid change; the national lockdown, associated guidance and furlough measures will have affected the labour market topic.’ Therefore, caution should be applied when using these figures for planning and policy purposes.
Occupation
In Census 2021, respondents aged 16 years and over were asked for their full job titles (for their main job, or if not working their last main job) and the main activity of their employer. Therefore, the total number of residents included in this question is higher than the question about industry because it includes those who were not in work but have worked previously (for example, those in occupations which experienced more job losses around the coronavirus pandemic). The answers they gave were coded using the Standard Occupational Classification 2020.
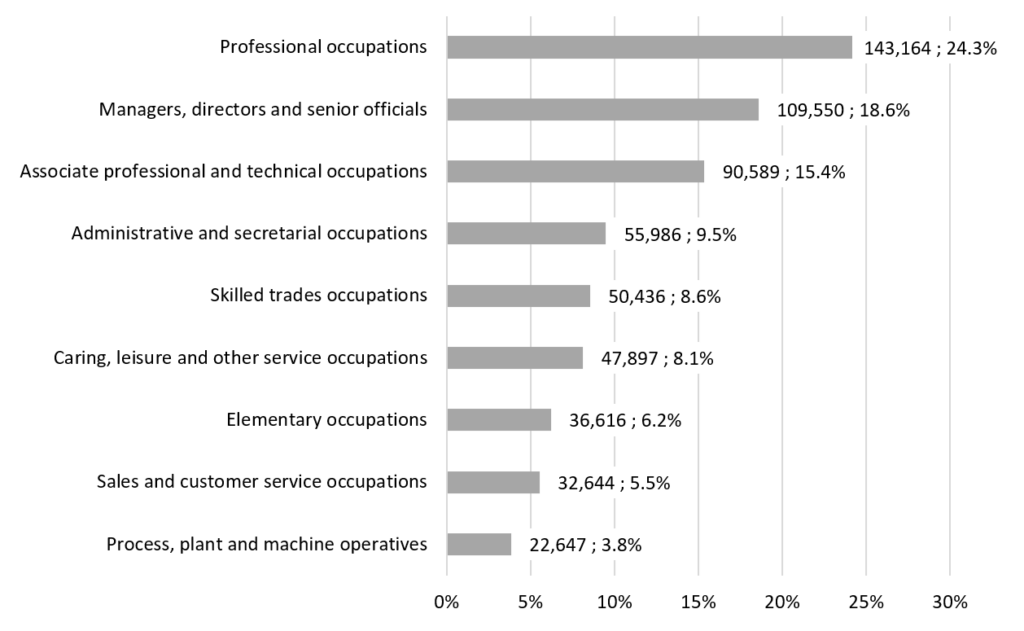
Just under a quarter of Surrey residents (24.3%) had a job which was categorised as a professional occupation, which represented the largest individual occupational group in Surrey of 143,164 individuals. The second largest occupational group in Surrey were managers, directors, and senior officials (18.6%) and consisted of 109,550 residents. Residents in the third largest occupational group in Surrey had jobs which were categorised as associate professional technical occupations (15.4%, 90,589 residents).
The percentage of Surrey residents by occupation, 2021
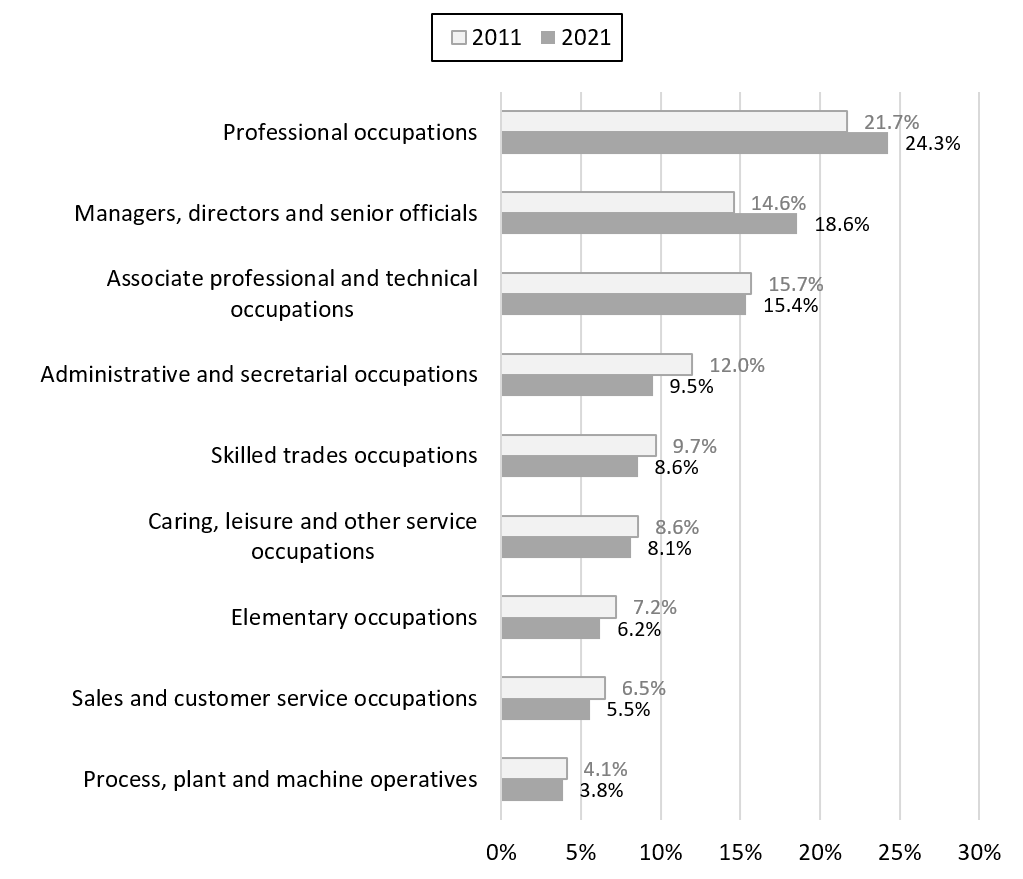
Between the 2011 and 2021, the proportion of Surrey residents in the top two occupations grew (professional occupations grew from 21.7% to 24.3% and managers, directors, and senior officials grew from 14.6% to 18.6%). All other occupational groups either continued to have similar proportions of residents in 2021 compared to 2011 (e.g., associate professional and technical occupations only declined from 15.7% to 15.4%) or declined during this time (e.g., administrative and secretarial occupations declined from 12.0% in 2011 to 9.5% in 2021).
The occupations of Surrey residents in 2011 and 2021
Professional occupations were the most common occupational group in every district and borough in Surrey at the time of the 2021 Census. Every district and borough in Surrey had a higher proportion of residents who were managers, directors, and senior officials than the England average (12.9%), from 24.5 per cent of residents in Elmbridge to 14.5 per cent of residents in Spelthorne.
The occupations of Surrey residents across districts and boroughs, 2021
| Area name | Managers, directors and senior officials | Professional occupations | Associate professional and technical occupations | Administrative and secretarial occupations | Skilled trades occupations | Caring, leisure and other service occupations | Sales and customer service occupations | Process, plant and machine operatives | Elementary occupations | Total in employment |
|---|---|---|---|---|---|---|---|---|---|---|
| Surrey | 18.6% | 24.3% | 15.4% | 9.5% | 8.6% | 8.1% | 5.5% | 3.8% | 6.2% | 589,529 |
| Elmbridge | 24.5% | 26.4% | 16.2% | 8.3% | 6.3% | 6.7% | 4.5% | 2.7% | 4.5% | 66,980 |
| Epsom and Ewell | 17.6% | 26.7% | 14.9% | 10.3% | 8.1% | 8.3% | 5.1% | 3.5% | 5.5% | 39,909 |
| Guildford | 17.4% | 26.4% | 16.1% | 8.4% | 8.1% | 7.8% | 5.8% | 3.4% | 6.6% | 69,774 |
| Mole Valley | 19.7% | 23.9% | 15.1% | 9.6% | 9.8% | 8.1% | 5.1% | 3.0% | 5.6% | 42,341 |
| Reigate and Banstead | 17.3% | 24.6% | 15.2% | 9.8% | 8.6% | 9.0% | 5.5% | 3.9% | 6.1% | 75,125 |
| Runnymede | 16.7% | 21.8% | 14.9% | 9.8% | 9.4% | 8.8% | 6.5% | 4.4% | 7.7% | 42,457 |
| Spelthorne | 14.5% | 19.5% | 15.0% | 11.7% | 9.8% | 8.6% | 6.6% | 6.3% | 8.0% | 51,539 |
| Surrey Heath | 18.5% | 22.9% | 15.6% | 9.9% | 8.6% | 8.3% | 6.0% | 4.0% | 6.3% | 45,363 |
| Tandridge | 19.6% | 21.6% | 15.7% | 10.6% | 9.7% | 8.4% | 5.1% | 3.9% | 5.5% | 42,576 |
| Waverley | 20.9% | 25.6% | 15.2% | 8.2% | 8.7% | 7.8% | 5.0% | 2.8% | 5.8% | 60,722 |
| Woking | 16.4% | 25.5% | 14.7% | 9.3% | 8.1% | 8.2% | 6.0% | 4.7% | 7.0% | 52,741 |
| South East | 14.9% | 21.2% | 14.3% | 9.4% | 10.0% | 9.1% | 6.8% | 5.6% | 8.8% | 4,471,777 |
| England | 12.9% | 20.3% | 13.3% | 9.3% | 10.2% | 9.3% | 7.5% | 6.9% | 10.5% | 26,405,214 |
National Statistics Socio-economic Classification
The National Statistics Socio-economic Classification (NS-SEC) indicates a person’s socioeconomic position based on their occupation and other job characteristics. It is an Office for National Statistics standard classification. NS-SEC categories are assigned based on a person’s occupation, whether employed, self-employed, or supervising other employees. Full-time students are recorded in the “full-time students” category regardless of whether they are economically active.
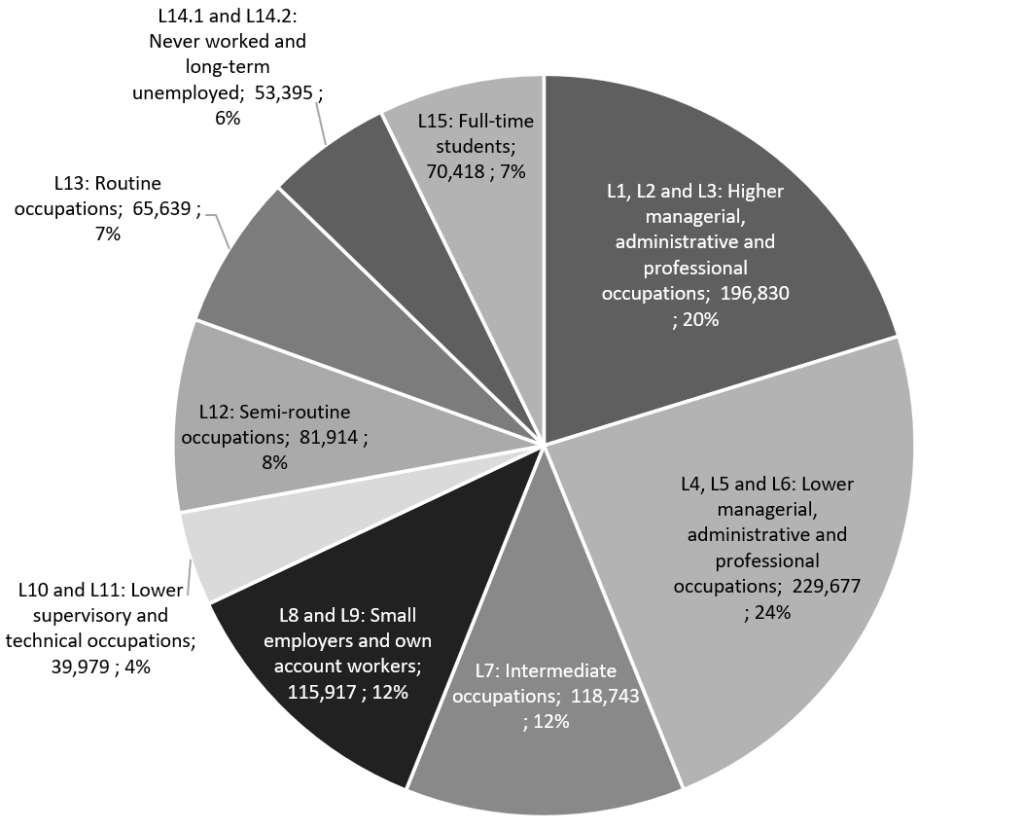
Just under a quarter of Surrey residents (24%) were in lower managerial, administrative and professional occupations (which represented 229,677 individuals). The second largest group were residents in higher managerial, administrative, and professional occupations (20%) who represented 196,830 individuals.
The groups with the smallest proportions of Surrey residents were those in lower supervisory and technical occupations (4%, 39,979 residents), those who had never worked and long-term unemployed (6%, 53,395 residents), and those in routine occupations (7%, 65,639 residents).
The distribution of socio-economic classifications (NS-SEC) across Surrey residents, 2021
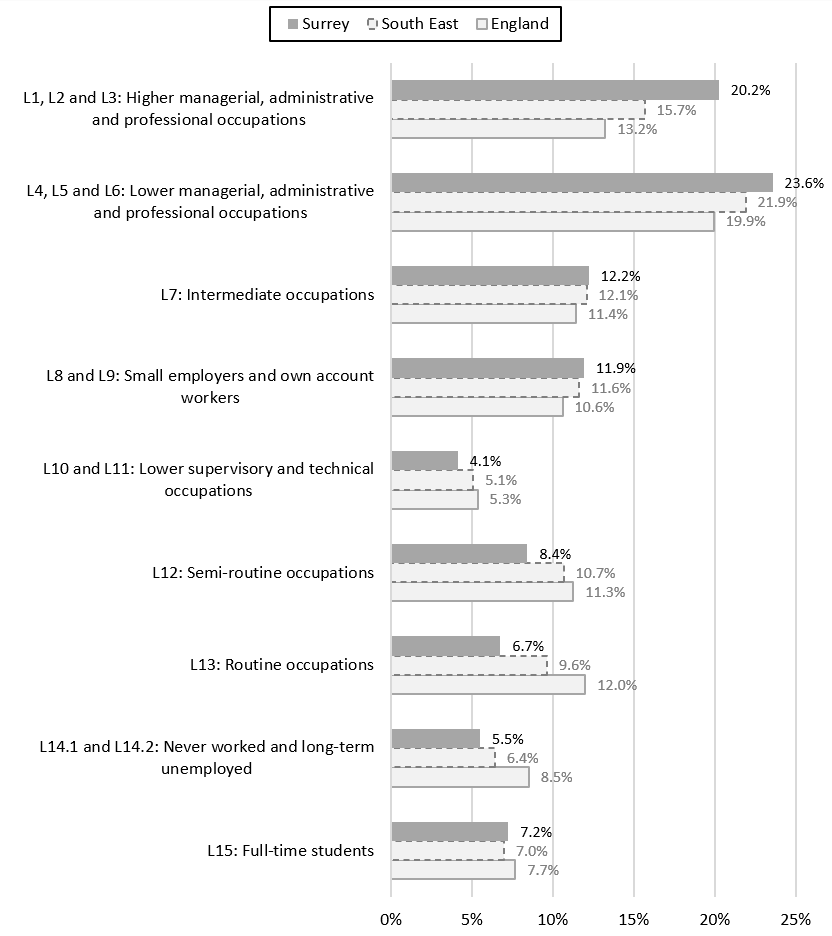
A much smaller proportion of Surrey residents were in semi-routine (8.4%) and routine occupations (6.7%) than the South East (10.7% and 9.6% respectively) and England (11.3% and 12.0% respectively). A lower proportion of Surrey residents were in lower supervisory and technical occupations (4.1%) than the South East (5.1%) and England (5.3%). A similar proportion of Surrey residents (7.2%) were full-time students to the South East (7.0%) and England (7.7%) (full-time students were recorded in the “full-time students” category regardless of whether they are economically active).
In contrast, higher proportions of Surrey residents were in more senior positions (i.e. managerial) or technical occupations, particularly those of high level. While 20.2 per cent of Surrey residents were in higher managerial, administrative, and professional occupations, only 15.7 per cent of the South East and 13.2 per cent of the England populations were in this occupation in 2021. In addition, 23.6 per cent of Surrey residents were in lower managerial, administrative, and professional occupations compared to 21.9 per cent of the South East and 19.9 per cent of England.
The distribution of socio-economic classifications (NS-SEC) across Surrey, the South East, and England , 2021