Census 2021: Religion
Religion from the 2021 Census
Headlines
- The Christian population remained the largest religious group in Surrey in the 2021 Census. However, the proportion of Surrey residents who were Christian decreased from 62.8 per cent in 2011 to 50.2 per cent in 2021.
- The reduction in Christian residents was largely driven by the population reporting ‘no religion’ rising from 24.8 per cent in 2011 to 36.3 per cent (440,069 residents) in 2021.
- Non-Christian religions were reported by 7.0 per cent of Surrey residents (84,641) in 2021, where Muslims represented 3.2 per cent of Surrey residents (38,138).
The raw data from this Census release has been processed by the Population Insight Team and is also available on Surrey-i.
Contents
Religion
Multiple Religion Households
Religion
The 2021 Census asked about religion, but this question was voluntary and ‘no religion’ was an accepted and popular answer. In Surrey, 93.7 per cent of respondents answered the religion question.
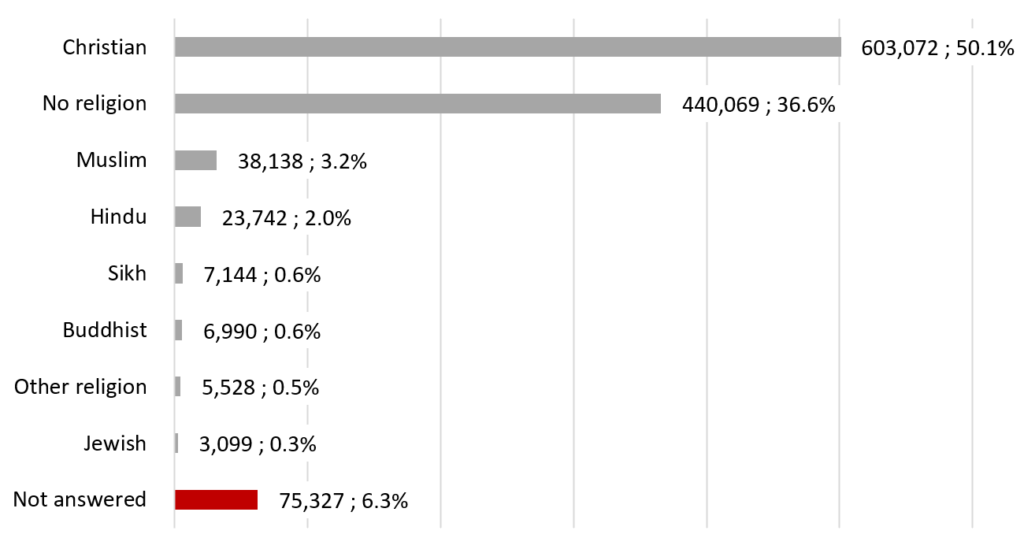
Christianity was the largest religion reported by Surrey residents on the 2021 Census Day. Half of Surrey residents reported that they were Christian (603,072). Over a third (36.6%) of Surrey residents also reported ‘no religion’ (40,069).
Non-Christian religions were reported by 7.0 per cent of Surrey residents (84,641) in 2021. Islam was the second most common religion in Surrey, where Muslims represented 3.2 per cent of Surrey residents (38,138).
The prevalence of religion within Surrey residents, 2021
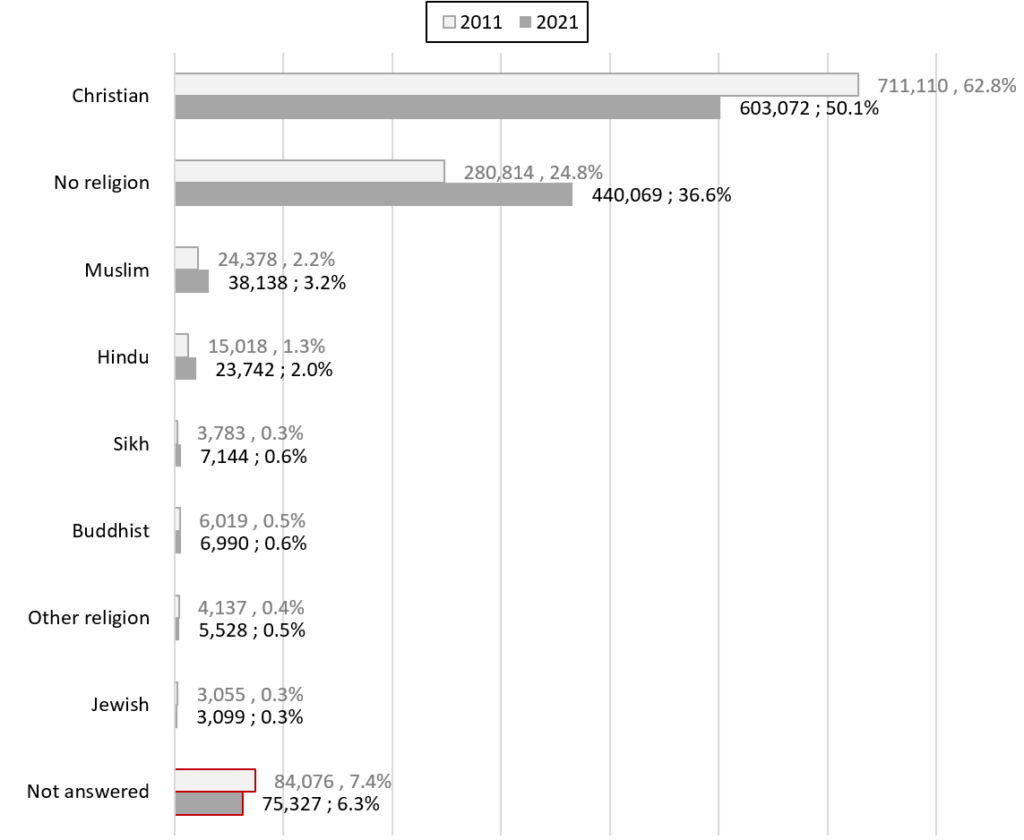
The breakdown of the Surrey population by religion changed considerably for certain groups between 2011 and 2021. Christianity was the only religion which experienced a reduction between the 2011 and 2021 Censuses. While still the most common religion in Surrey, the proportion of Surrey residents reporting as Christian declined from 62.8 per cent (711,110) in 2011 to 50.2 per cent (603,072) in 2021, representing a reduction of 15 per cent in ten years.
The reduction in the reports of Christianity was mainly due to more residents reporting ‘no religion’ in the most recent Census alongside much smaller increases in certain non-Christian religions. The population reporting ‘no religion’ rose from 24.8 per cent (280,814) in 2011 to 36.3 per cent (440,069) in 2021, representing a growth of 57 per cent in ten years. This trend of growing ‘no religion’ alongside reductions in residents self-reporting as Christian was also captured between the 2001 and 2011 Censuses and is therefore a long-term shift.
The percentage of Surrey residents who reported that they were Muslim increased from 2.2 per cent in 2011 to 3.2 per cent in 2021 (a growth of just over 14 thousand residents). The percentage of Surrey residents who reported that they were Hindu also increased from 1.3 per cent in 2011 to 2.0 per cent in 2021 (a growth of 8,724 residents). The Surrey Sikh population doubled in size from representing 0.3 per cent of residents in 2011 to 0.6 per cent of residents in 2021.
The Buddhist and Jewish religions experienced much smaller increases in Surrey between 2011 and 2021 (from 6,019 to 6,990 Buddhist residents and 3,055 to 3,099 Jewish residents).
The prevalence of religion within Surrey residents, 2011 and 2021
The prevalence of religion within Surrey residents, 2001, 2011 and 2021
| Religion | 2001 Count | 2001 % | 2011 Count | 2011 % | 2021 Count | 2021 % |
|---|---|---|---|---|---|---|
| Christian | 789,609 | 74.6% | 711,110 | 62.8% | 603,072 | 50.1% |
| Buddhist | 3,362 | 0.3% | 6,019 | 0.5% | 6,990 | 0.6% |
| Hindu | 7,458 | 0.7% | 15,018 | 1.3% | 23,742 | 2.0% |
| Jewish | 3,229 | 0.3% | 3,055 | 0.3% | 3,099 | 0.3% |
| Muslim | 14,190 | 1.3% | 24,378 | 2.2% | 38,138 | 3.2% |
| Sikh | 1,967 | 0.2% | 3,783 | 0.3% | 7,144 | 0.6% |
| Other religion | 3,281 | 0.3% | 4,137 | 0.4% | 5,528 | 0.5% |
| No religion | 161,074 | 15.2% | 280,814 | 24.8% | 440,069 | 36.6% |
| Not answered | 74,845 | 7.1% | 84,076 | 7.4% | 75,327 | 6.3% |
When comparing the prevalence of religions across areas, it is important to note that certain areas had a lower response rate (a higher proportion of residents did not answer the question about religion) and so very small differences may echo the differences in response rate rather than actual difference.
Guildford had the highest proportion of residents who reported ‘no religion’ in 2021 at 39.7 per cent, with Waverley coming in second at 39.0 per cent. Spelthorne had the lowest proportion of residents who reported ‘no religion’ in 2021, but this group still represented 31.2 per cent of the Spelthorne population.
The prevalence of Christianity in Surrey ranged from 52.2 per cent of residents in Mole Valley to 47.6 per cent in Woking. Yet Christianity remained the most common religion in every Surrey district and borough.
Islam was the second most commonly reported religion after Christianity (and ‘no religion’) for every Surrey district and borough other than Spelthorne.
Woking had the highest proportion of residents who self-identified as Muslim at nearly one in every ten residents identifying as Muslim (9.4%). Residents reporting as Muslim represented 4.9 per cent of the Epsom and Ewell population, 4.0 per cent of those in Spelthorne, and 3.1 per cent of those in Reigate and Banstead.
Hindu residents were the second largest religious group in Spelthorne at 4.2 per cent. In Epsom and Ewell, although the Hindu population was smaller than the Muslim population, Hindu residents still represented 3.6 per cent of the local resident population.
Spelthorne also had a larger Sikh population at 2.5 per cent of residents in 2021, alongside Surrey Heath which had a Sikh population which represented 1.2 per cent of residents. Surrey Heath also had the largest prevalence of Buddhist residents at 1.1 per cent.
Elmbridge had the highest proportion of residents who reported as Jewish at 0.5 per cent.
The prevalence of religion within Surrey boroughs and districts, 2021
| Local authority | % No religion | % Christian | % Buddhist | % Hindu | % Jewish | % Muslim | % Sikh | % Other religion | % Not answered | Total population |
|---|---|---|---|---|---|---|---|---|---|---|
| Elmbridge | 35.4% | 52.0% | 0.5% | 1.6% | 0.5% | 2.5% | 0.5% | 0.4% | 6.4% | 138,753 |
| Epsom and Ewell | 35.7% | 48.1% | 0.7% | 3.6% | 0.3% | 4.9% | 0.3% | 0.4% | 6.1% | 80,938 |
| Guildford | 39.7% | 48.2% | 0.7% | 1.4% | 0.3% | 2.2% | 0.2% | 0.5% | 7.0% | 143,649 |
| Mole Valley | 38.4% | 52.2% | 0.4% | 0.7% | 0.2% | 1.2% | 0.1% | 0.4% | 6.3% | 87,387 |
| Reigate and Banstead | 38.1% | 49.1% | 0.5% | 2.4% | 0.2% | 3.1% | 0.2% | 0.4% | 6.0% | 150,846 |
| Runnymede | 34.8% | 50.4% | 0.5% | 2.3% | 0.3% | 2.9% | 1.4% | 0.5% | 6.9% | 88,079 |
| Spelthorne | 31.2% | 50.9% | 0.7% | 4.2% | 0.2% | 4.0% | 2.5% | 0.5% | 5.7% | 102,955 |
| Surrey Heath | 36.0% | 50.0% | 1.1% | 2.2% | 0.2% | 3.1% | 1.2% | 0.5% | 5.7% | 90,457 |
| Tandridge | 38.9% | 51.2% | 0.4% | 1.2% | 0.2% | 1.3% | 0.1% | 0.4% | 6.4% | 87,872 |
| Waverley | 39.0% | 51.9% | 0.4% | 0.4% | 0.2% | 1.2% | 0.1% | 0.5% | 6.3% | 128,229 |
| Woking | 33.3% | 47.6% | 0.6% | 2.4% | 0.2% | 9.4% | 0.3% | 0.5% | 5.8% | 103,943 |
Multiple Religion Households
The multi-religious household data classified households by whether members identify with the same religion, no religion, did not answer the question, or a combination of these options. This question was voluntary and the variable includes those who answered the question alongside those who chose not to.
Of the 351,392 Surrey households which included more than one resident (72.9% of all households), just under half included members with only the same shared religion. Over a quarter of multiple-person households (27.1%) in Surrey reported no religion and 22.4 per cent of multiple-person households reported a combination of no religion alongside person(s) of the same religion.
The distribution of religions within Surrey households, 2021
| Of multiple-person households: | Percentage (%) | Count |
|---|---|---|
| No people stated their religion | 2.7% | 9,566 |
| Same religion (at least one person has stated a religion but the household may include people who did not state their religion) | 45.8% | 160,811 |
| No religion (household may include people who did not state their religion) | 27.1% | 95,075 |
| Same religion and no religion (household may include people who did not state their religion) | 22.4% | 78,743 |
| At least two different religions stated (household may include people with no religion and who did not state their religion) | 2.0% | 7,197 |