Census 2021: Ethnic Group
Ethnic Group from the 2021 Census
A NEW, more detailed, look at the ethnic group variable in combination with other measures is also available on Surrey-i: A deep-dive into ethnic groups at the 2021 Census | Surrey-i.
Headlines
- Three quarters of Surrey residents reported that they identified as White British in 2021, alongside 8.9 per cent who reported that they were ‘White Other’ and 14.5 per cent who reported that they identified as ethnicities which were not White.
- Apart from the White British group, the prevalence of all other ethnic groups grew in Surrey between 2011 and 2021
- When excluding single-person households, 8 out of 10 (80.3%) Surrey multiple-person households included members with the same ethnic group.
- Surrey multiple-person households were slightly less likely to have households members with the same ethnic groups than the South East and England, but more likely to include household partnerships with different ethnic groups.
The raw data from this Census release has been processed by the Population Insight Team and is also available on Surrey-i.
Contents
Ethnic group
Ethnic groups over time
Multiple ethnic groups in households
Ethnic group
The 1991 Census first introduced a question on ethnic grouping to enable private and public organisations to monitor equal opportunities/anti-discrimination policies and to plan for the future through resource allocation and provision of services.
The ethnic group question captures the group that the person completing whichever Census feels they belong to. This could be based on their culture, family background, identity or physical appearance. Respondents could choose one out of 19 tick-box response categories, including write-in response options.
High-level ethnic group refers to the first stage of the two-stage ethnic group question. High-level groups refer to the first stage where the respondent identifies through one of the following options:
• “Asian, Asian British, Asian Welsh”,
• “Black, Black British, Black Welsh, Caribbean or African”,
• “Mixed or Multiple”,
• “White”,
• or “Other ethnic group”.
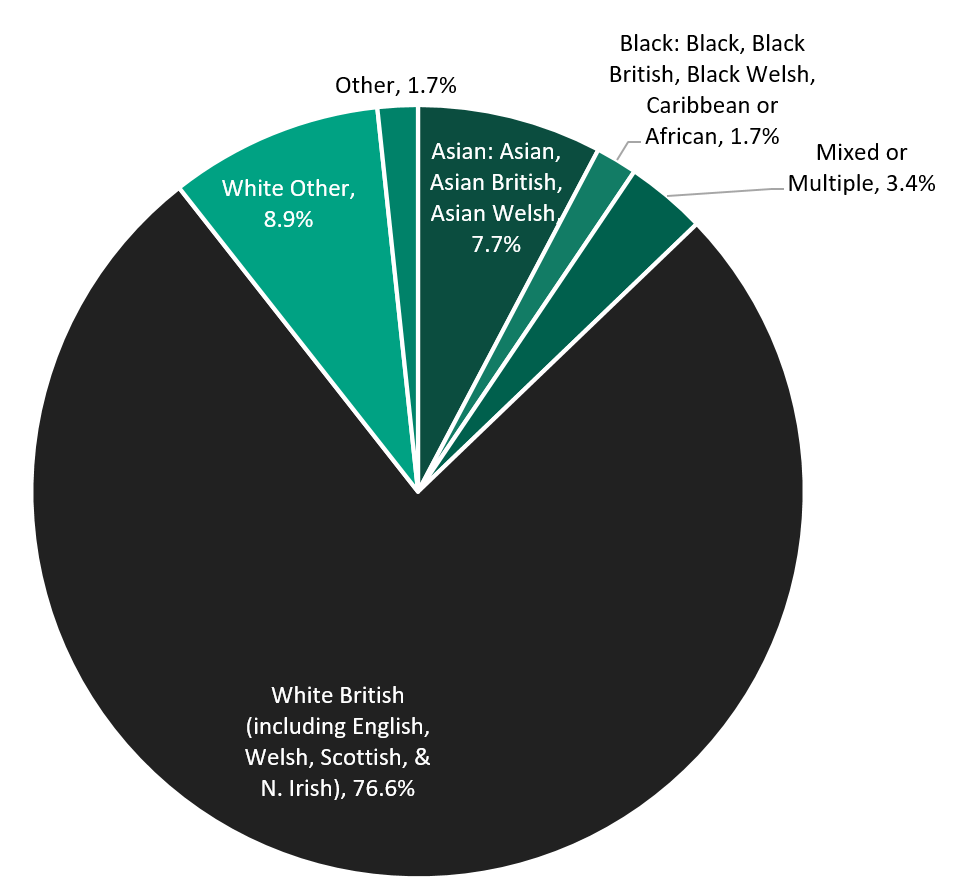
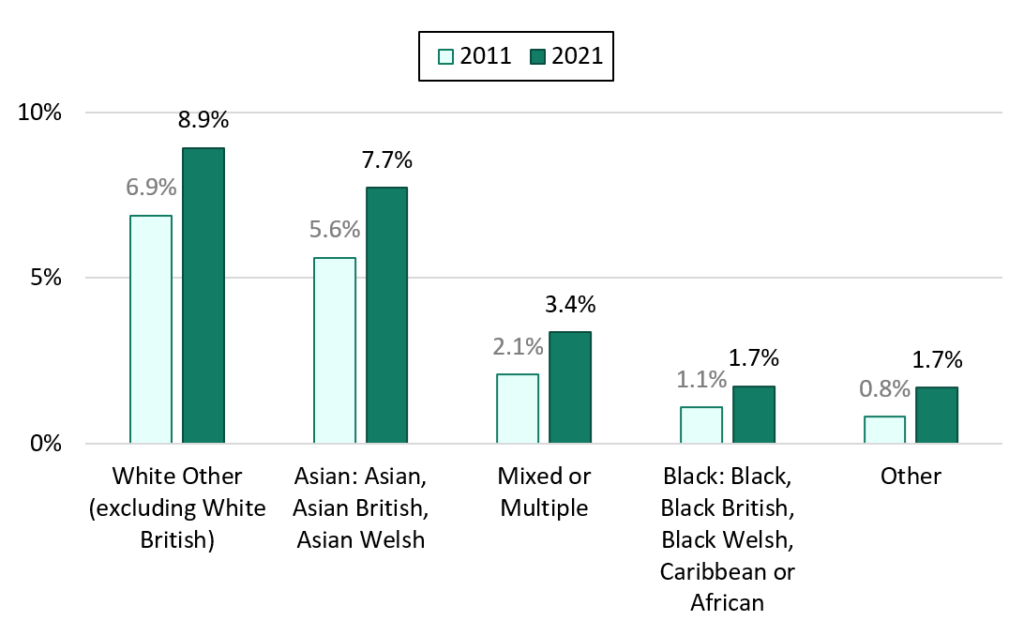
Three quarters of Surrey residents reported that they identified as White British in 2021, alongside 8.9 per cent who reported that they were ‘White Other’. Therefore, 14.5 per cent of Surrey residents reported that they identified as non-White. The residents who identified as Asian made up the largest percentage of the non-White Surrey population and represented 7.7 per cent of all Surrey residents in 2021. Those who identified as Mixed or of Multiple ethnicity represented 3.4 per cent of the overall Surrey population and residents who identified as Black represented 1.7 per cent.
Surrey residents by ethnic group, 2021
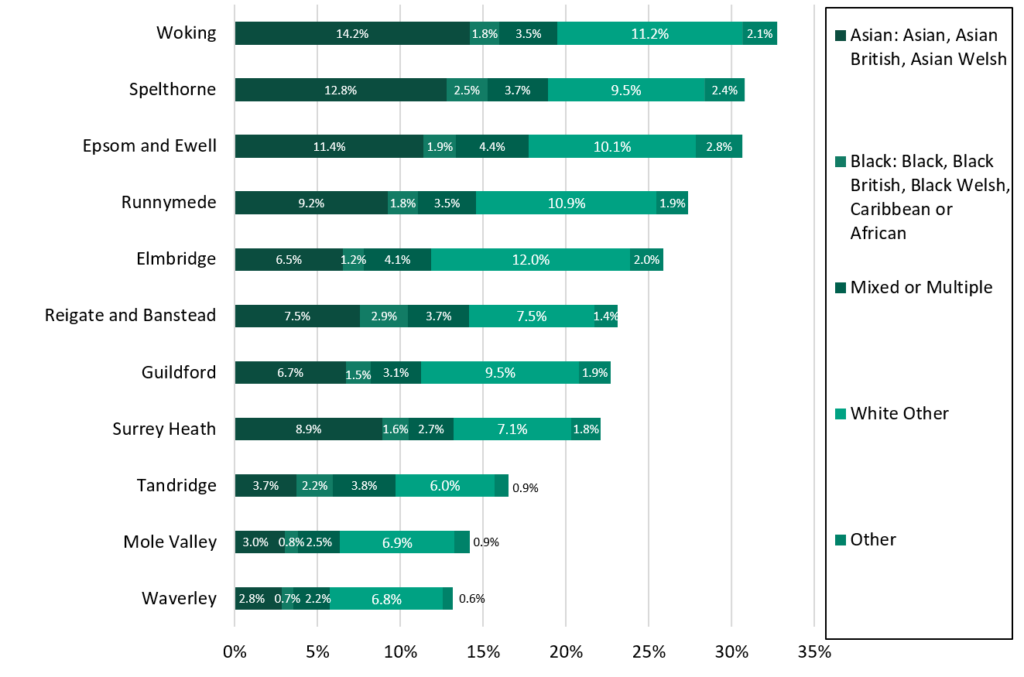
Woking had the highest proportion of non-‘White British’ residents in 2021, consisting of the highest proportion of residents identifying as Asian (14.2%) and the second highest prevalence of residents who identified as other White ethnicities (11.2%) in Surrey. Elmbridge had the highest proportion of residents who identified as other White ethnicities which were not White British (12.0%). Reigate and Banstead had the highest proportion of residents who identified as Black (2.9%) in Surrey.
High-level non-White British ethnic groups within Surrey, 2021
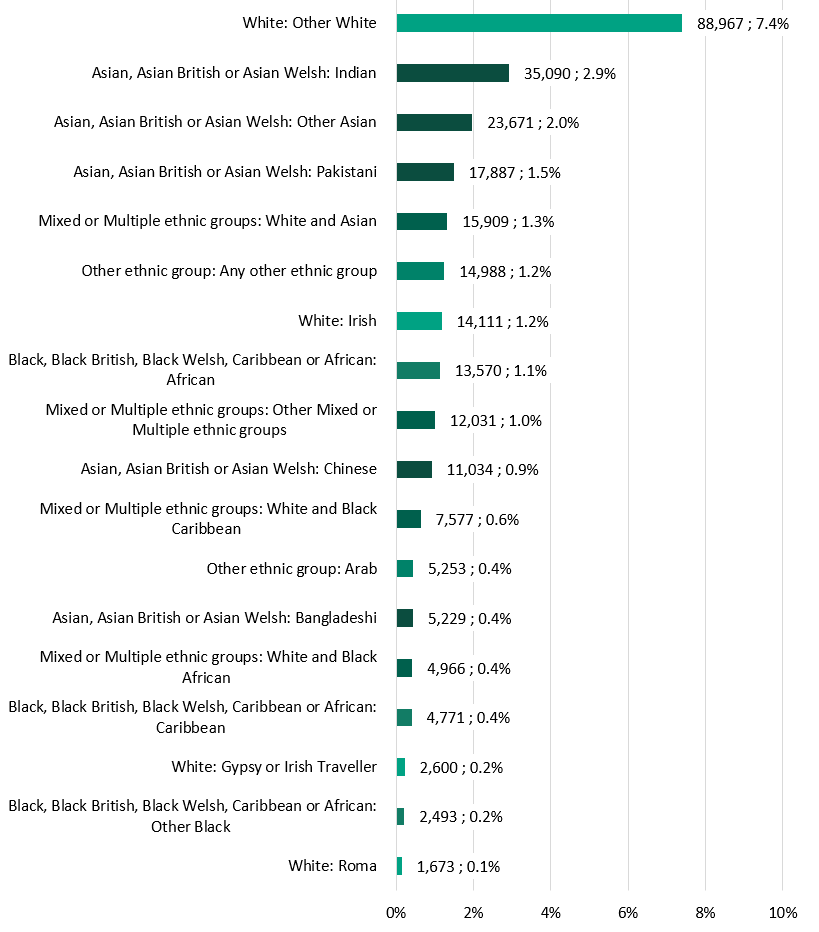
High-level ethnic groups do not show the more detailed breakdown of ethnic groups that are available from the Census. The next graph includes more detailed ethnic groupings, but even more detail is available as raw data on the Surrey-I data page.
Surrey districts and boroughs by non-White British ethnic groups, 2021
Ethnic groups over time
More than three quarters (76.6%) of Surrey residents reported that they were White British (including English, Welsh, Scottish, Northern Irish or British) in 2021 which was lower than in the 2011 Census (83.5%). The other high-level ethnic groups in Surrey, contrastingly, grew in size between 2011 and 2021.
The other White population (non-British) grew from representing 6.9 per cent of the 2011 Surrey population to 8.9 per cent of the 2021 Surrey population.
The Asian population in Surrey grew from 5.6 per cent of residents in 2011 to 7.7 per cent of residents in 2021. The Black population in Surrey grew from 1.1 per cent of residents in 2011 to 1.7 per cent of residents in 2021. Residents with a Mixed or of Multiple ethnicity represented 2.1 per cent of the 2011 Surrey population compared to 3.4 per cent of the 2021 population.
Ethnic groups within Surrey, 2011 and 2021
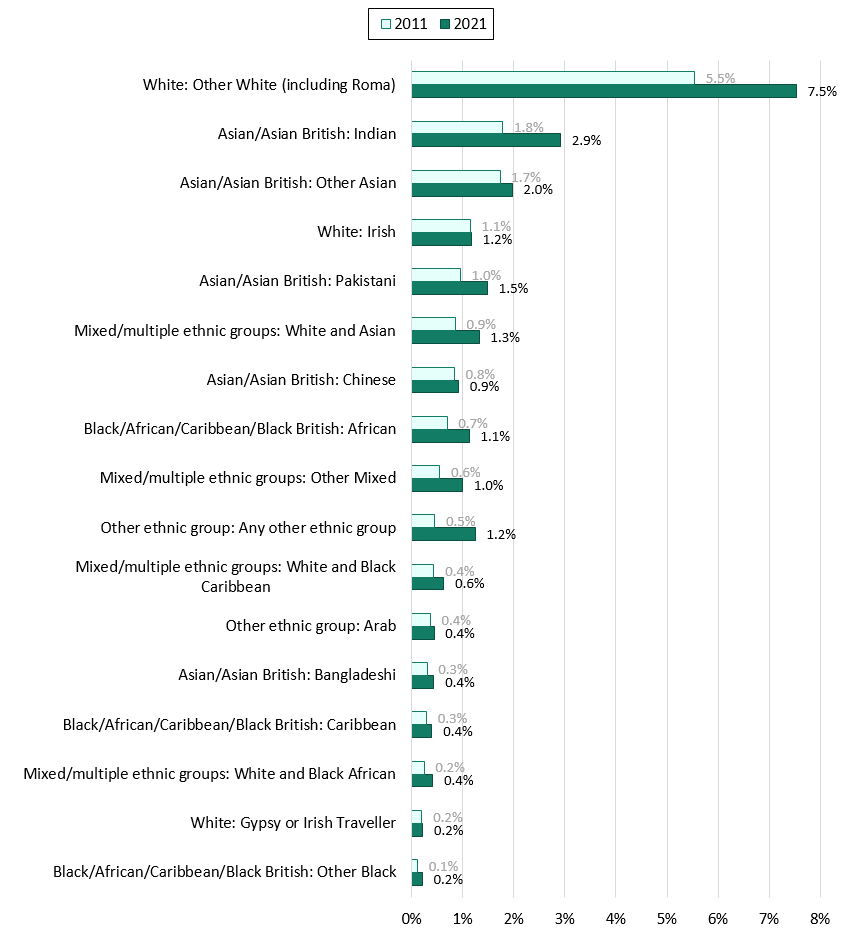
Roma individuals are included in the ‘Other White’ category for the following graph to match the 2011 Census results. ‘Other White’ individuals represented 5.5 per cent of Surrey residents in 2011 but this grew to 7.5 per cent in 2021.
All ethnic groups apart from White British grew between 2011 and 2021. Indian residents represented 2.9 per cent of Surrey residents in 2021, compared to 1.8 per cent in 2011.
Non-White British ethnic groups within Surrey, 2011 and 2021
Multiple ethnic groups in households
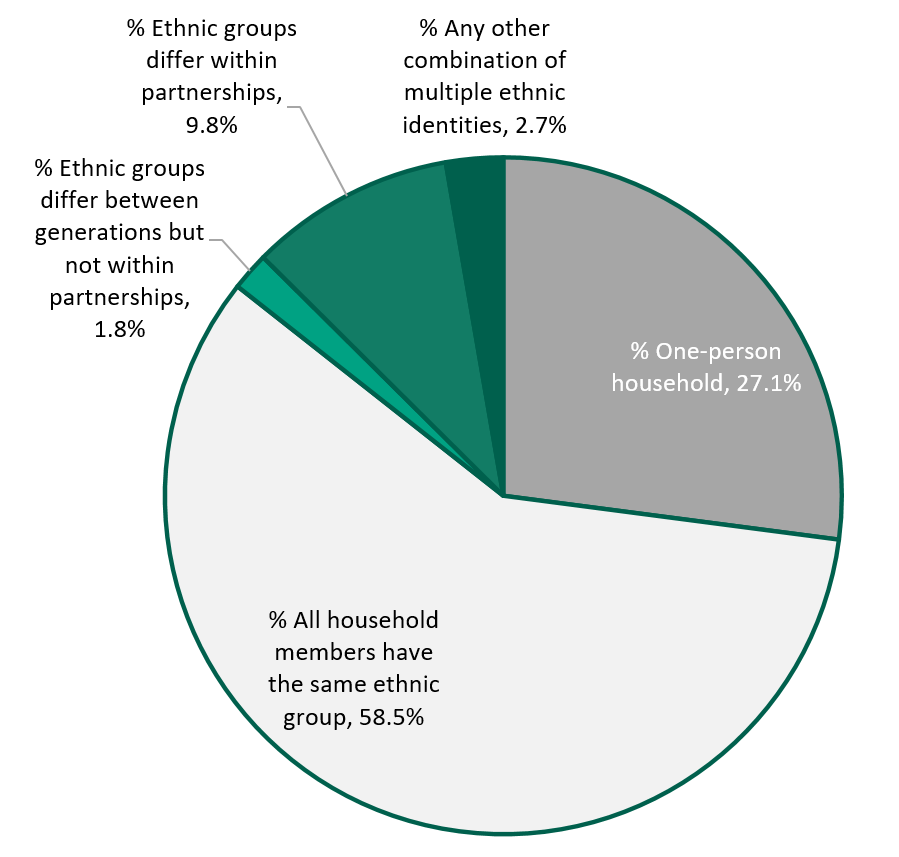
Of all Surrey households, alongside the 27.1 per cent of one-person households, over half (58.5%) of households had members with the same ethnic group. Just under 70 thousand (69,298) households in Surrey were multiple person households where members differed in ethnic group.
The majority of households with differing ethnic identities were from differences within partnerships (i.e. partners reported belonging to different ethnic groups), and represented 9.8 per cent of all Surrey households.
Multiple ethnic groups within all Surrey households, 2021
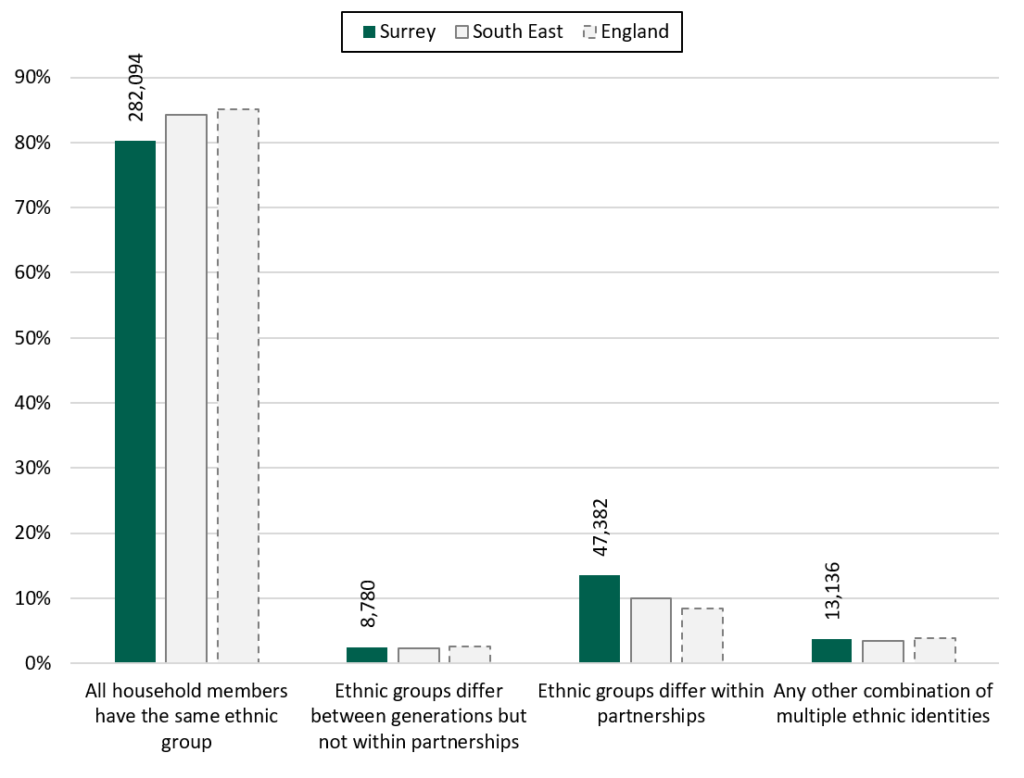
Focusing on multiple-person households (in other words, excluding one-person households), the Census showed that 8 out of 10 (80.3%) Surrey multiple-person households included members with the same ethnic group. Surrey multiple-person households were slightly less likely to have households members with the same ethnic groups than the South East (84.3%) and England (85.1%).
Multiple-person households with ethnic groups which differ within partnerships represent 47,382 households and are more common in Surrey (13.5%) than the South East (10.0%) and England (8.4%).
Ethnic group within multiple-person households in Surrey