Census 2021: Travel to work
Travel to work from the 2021 Census
The raw data from this Census release has been processed by the Population Insight Team and is also available on Surrey-i.
Contents
As stressed by the Office for National Statistics: ‘Census 2021 took place during the coronavirus (COVID-19) pandemic, a period of unparalleled and rapid change; the national lockdown, associated guidance and furlough measures will have affected the labour market topic.’ Therefore, caution should be applied when using these figures for planning and policy purposes.
In Surrey, 589,529 usual residents aged 16 years and over were in employment on the 2021 Census Day. ‘On the Census 2021 form, people who were in employment or temporarily away from work in the week before Census Day were asked “How do you usually travel to work?”. People were asked to select one mode of transport that they used for the longest part, by distance, of their usual journey to work.’
Modes of travel and the requirement to travel to work were very influenced by the period in which the Census was taken in 2021. While more jobs are now utilising working from home, the Census occurred at time where the Coronavirus pandemic may have caused higher home working so taking these figures as the norm for the years after the 2021 Census may be misleading. This question is also difficult to interpret with the rise of hybrid working – e.g., a person working from home 3 days a week and going into an office 2 days a week would ‘work mainly at or from home’ under this question but, in reality, uses transport two days of the working week.
Working mainly at or from home
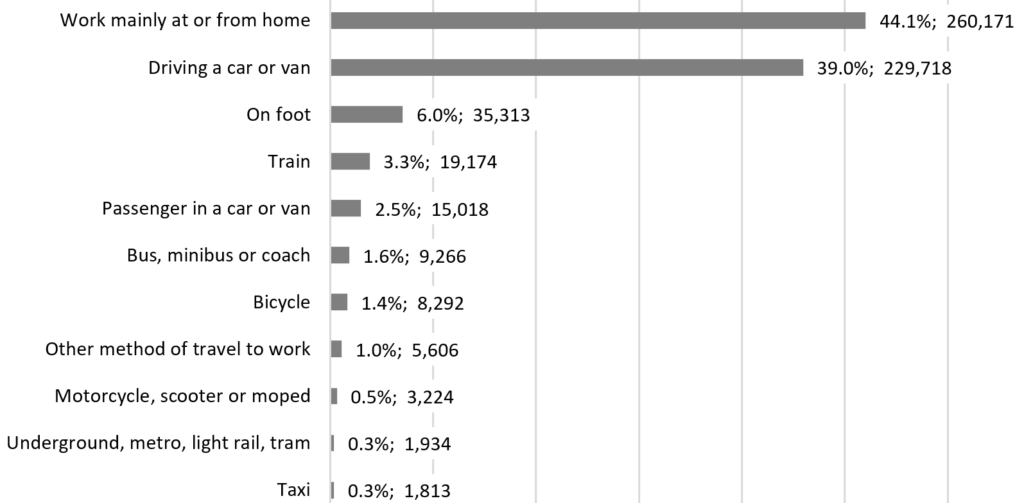
At the time of the 2021 Census, 44.1 per cent of employed Surrey residents reported that they worked mainly at or from home (260,171 residents) compared to just 7.7 per cent of residents in 2011. As noted above, it is important to keep in mind that the 2021 Census was collected at a time where there was rapid change due to the coronavirus pandemic which heavily influenced if and how residents would have travelled to work. These numbers are therefore unlikely to represent behaviours pre-pandemic or the years or months after March 2021.
The numbers of residents who worked mainly at or from home were not that much lower than those who used a car or van to drive to work in 2021, at 39 per cent (229,718). Just 6 per cent of Surrey residents walked to work, representing only 35,313 persons. Only 17 per cent of Surrey residents in employment did not work from home or drive a car or van into work at the time of the 2021 Census. The methods used to travel to work are further explored below.
Methods for travel to work, including those who worked mainly at or from home in 2021
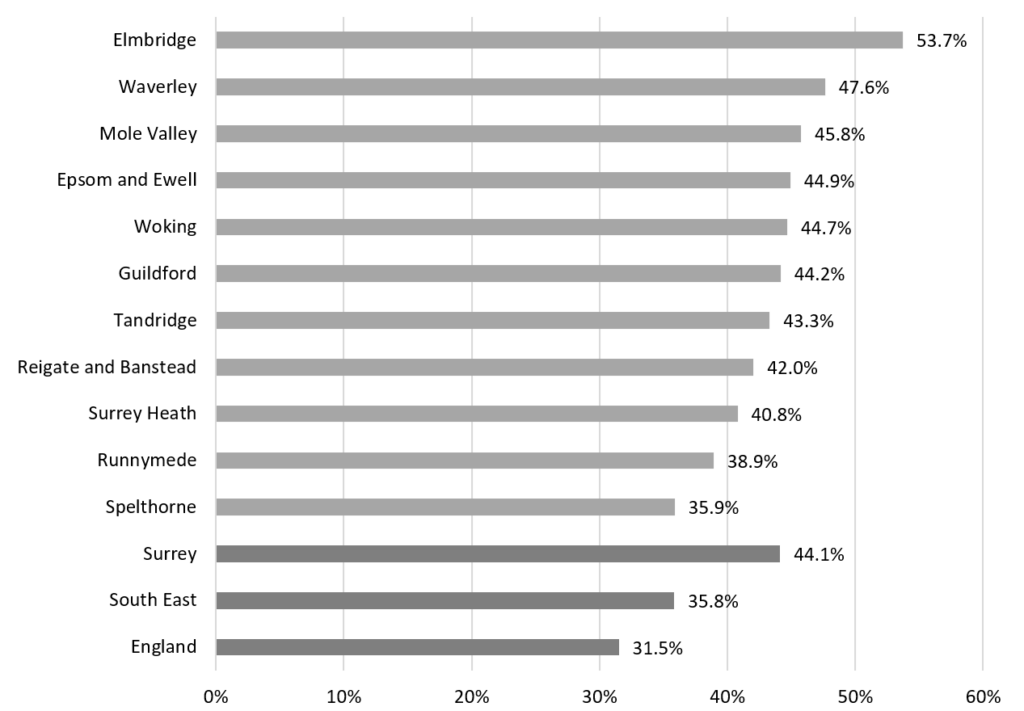
Surrey had higher proportions of residents who reported that they mainly worked at or from home in March 2021 (44.1%) than the South East (35.8%) and England (31.5%) averages. This is likely to be related to Surrey residents also being more likely to be in certain occupations (professional and managerial) which may have enabled home-working in response to the coronavirus pandemic.
Elmbridge had the highest proportion of employed residents who reported working at or from home in 2021 at 53.7 per cent, compared to 35.9 per cent of Spelthorne residents who were employed.
The percentage of employed residents of Surrey who reported that they worked at or from home, 2021
Method of travel to work
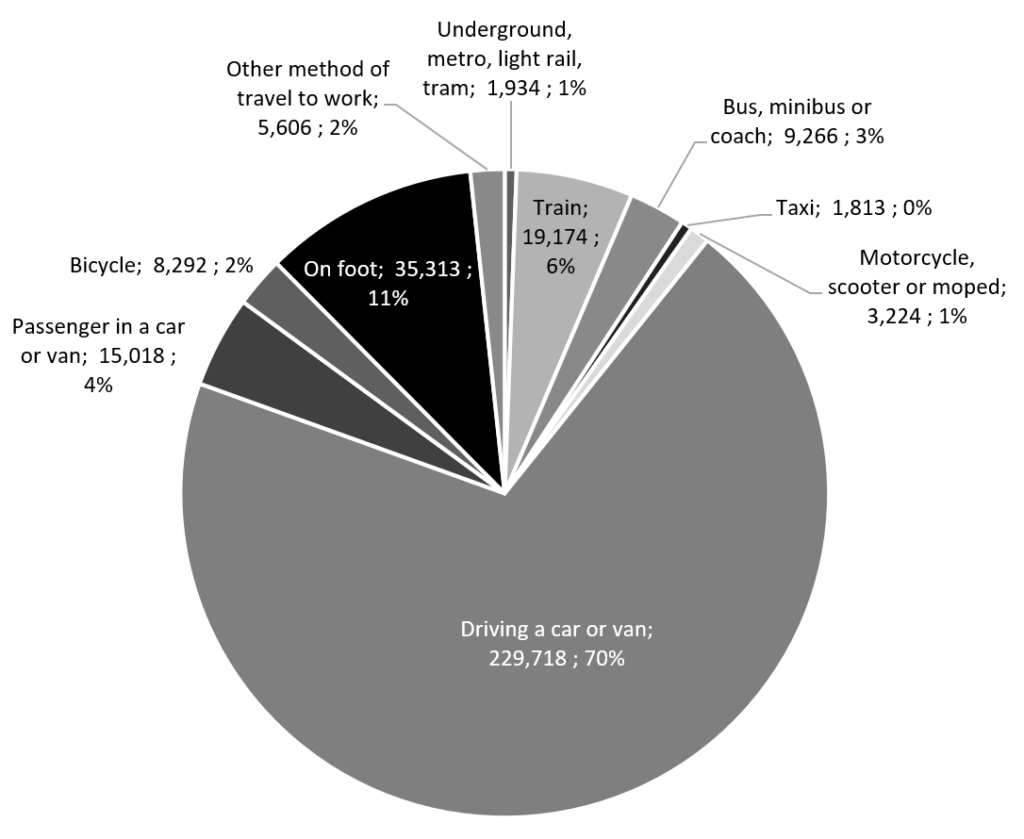
Of the 329,358 employed Surrey residents who reported that they mainly travelled to work, over two thirds of residents reported driving a car or a van (69.7%). The top three methods used to travel to work by employed Surrey residents were driving a car or van (70%), on foot (11%), and train (6%).
Of residents who travelled to work, the reported methods used to travel by Surrey residents at the 2021 Census
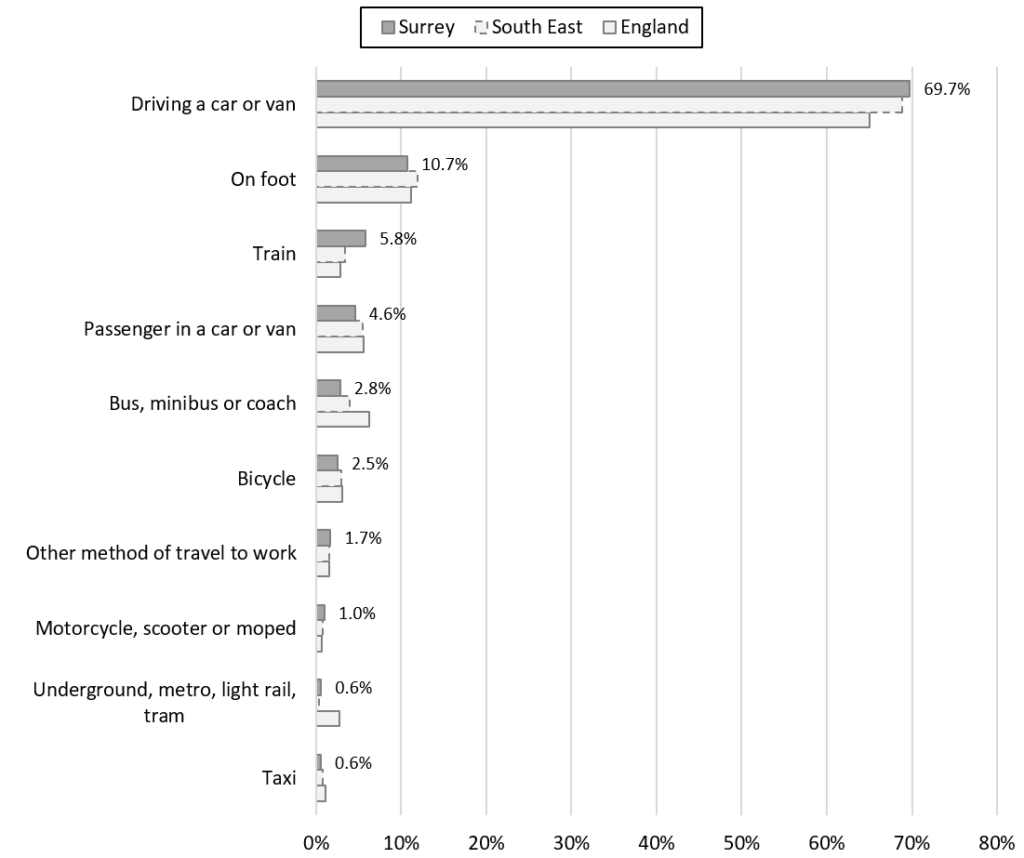
Surrey residents who travelled to work were more likely to use the train (5.8%) than those from the South East (3.4%) and England (2.9%). However, Surrey residents were much less likely to use a bus, minibus, or coach (2.8%) than England as a whole (6.2%). Surrey residents were slightly less likely to report using a bicycle to travel to work (2.5%) than the South East (3.0%) or England (3.1%) as a whole.
Of residents who travelled to work, the reported methods used to travel at the 2021 Census
Surrey Heath residents had the highest proportion of employed residents who travelled to work and reported driving a car or van to work at 76.3 per cent, compared to 62.0 per cent in Epsom and Ewell. Elmbridge residents who travelled to work were the most likely to report using a bicycle (4.6%) in Surrey, while Guildford residents were most likely to report travelling on foot (15.1%). Epsom and Ewell residents were the most likely to report travelling to work via train (9.8%), while Spelthorne residents were the most likely to report using a bus, mini bus, or coach (5.5%).
| Local authority | Driving a car or van | On foot | Train | Passenger in a car or van | Bus, minibus or coach | Bicycle | Other method of travel to work | Motorcycle, scooter or moped | Underground, metro, light rail, tram | Taxi | Total persons who travel to work |
|---|---|---|---|---|---|---|---|---|---|---|---|
| Surrey | 69.7% | 10.7% | 5.8% | 4.6% | 2.8% | 2.5% | 1.7% | 1.0% | 0.6% | 0.6% | 329,358 |
| Elmbridge | 66.0% | 9.9% | 8.9% | 3.7% | 2.2% | 4.6% | 2.0% | 1.3% | 0.9% | 0.4% | 30,997 |
| Epsom and Ewell | 62.0% | 11.5% | 9.8% | 4.2% | 3.9% | 3.0% | 1.6% | 1.6% | 1.6% | 0.8% | 21,981 |
| Guildford | 66.2% | 15.1% | 4.2% | 4.7% | 3.2% | 3.0% | 1.9% | 0.9% | 0.2% | 0.4% | 38,960 |
| Mole Valley | 72.5% | 10.8% | 5.5% | 4.6% | 1.3% | 2.0% | 1.7% | 0.9% | 0.3% | 0.4% | 22,963 |
| Reigate and Banstead | 68.6% | 10.8% | 6.7% | 4.5% | 3.8% | 1.7% | 1.6% | 0.9% | 0.5% | 0.9% | 43,538 |
| Runnymede | 71.8% | 10.6% | 4.4% | 4.9% | 1.9% | 2.7% | 1.6% | 0.9% | 0.5% | 0.7% | 25,928 |
| Spelthorne | 71.2% | 7.0% | 4.5% | 4.0% | 5.5% | 2.9% | 1.6% | 1.3% | 1.4% | 0.4% | 33,045 |
| Surrey Heath | 76.3% | 9.8% | 2.5% | 4.9% | 1.9% | 1.8% | 1.5% | 0.7% | 0.1% | 0.3% | 26,854 |
| Tandridge | 73.0% | 8.0% | 8.1% | 4.4% | 2.5% | 0.8% | 1.6% | 0.8% | 0.5% | 0.4% | 24,133 |
| Waverley | 73.4% | 11.8% | 4.0% | 4.9% | 1.4% | 1.8% | 1.6% | 0.7% | 0.2% | 0.2% | 31,793 |
| Woking | 67.6% | 11.2% | 6.7% | 5.4% | 2.1% | 3.1% | 1.8% | 0.8% | 0.4% | 0.9% | 29,174 |
| South East | 69.7% | 10.7% | 5.8% | 4.6% | 2.8% | 2.5% | 1.7% | 1.0% | 0.6% | 0.6% | 2,868,700 |
| England | 68.9% | 11.9% | 3.4% | 5.5% | 3.9% | 3.0% | 1.6% | 0.8% | 0.3% | 0.7% | 18,083,962 |
Distance travelled to work
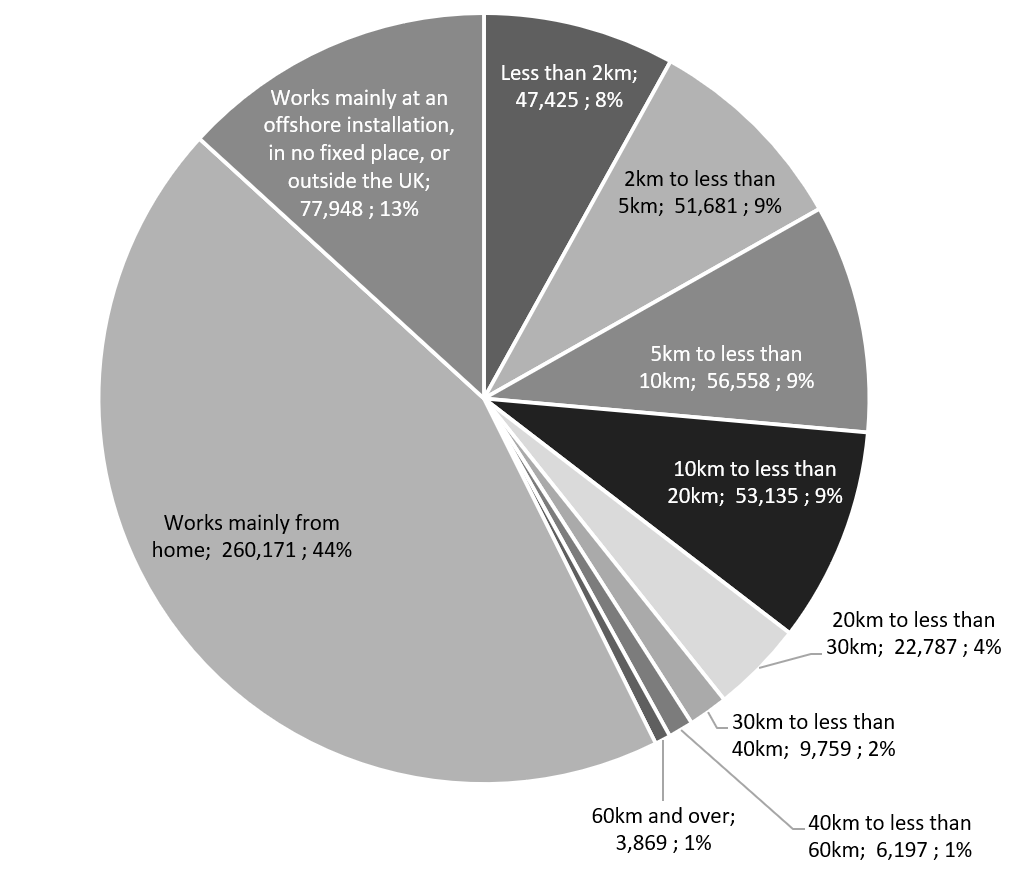
The graph below presents the distribution of the distance travelled to work by Surrey residents when including those who worked mainly at or from home before this section moves on to only focus on those who travelled to work. In addition to the 44 per cent of residents who worked mainly at or from home, 13 per cent (77,948) of residents reported that they worked mainly at an offshore installation, in no fixed place, or outside of the UK. The majority of residents who travelled to work travelled a distance less than 20km (35% of all employed residents) compared to distances of 20km and over (8% of all employed residents).
Distance travelled to work by Surrey residents, including those who work mainly from home
Of the Surrey residents who travelled to work, the most common distance travelled to work was from 5km to less than 10km (22.5%), followed by 10km to less than 20km (21.1%), 2km to less than 5km (20.6%), and less than 2km (18.9%).
Distance travelled to work out of Surrey residents who worked away from home, 2021
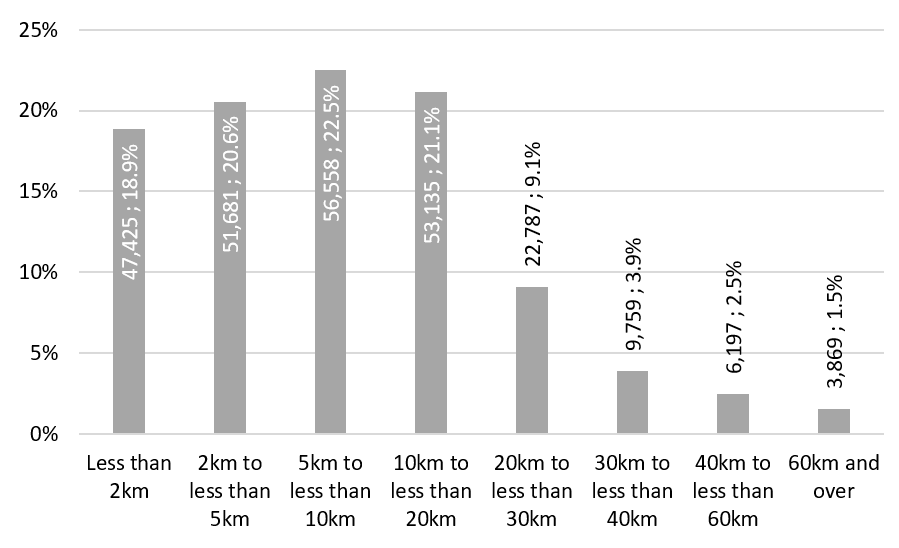
Although Surrey residents were more likely to report working at or from home at the time of the 2021 Census than the overall populations of the South East and England, Surrey residents who did travel to work were slightly less likely to travel the shortest distances. In Surrey, 39.5 per cent of residents who travelled to work travelled a distance below 5km compared to 43.3 per cent of the South East and 43.4 per cent of England.
The distribution of distances travelled to work out of residents who worked away from home, 2021
| Local authority | % Less than 2km (of those who travel to work) | % 2km to less than 5km (of those who travel to work) | % 5km to less than 10km (of those who travel to work) | % 10km to less than 20km (of those who travel to work) | % 20km to less than 30km (of those who travel to work) | % 30km to less than 40km (of those who travel to work) | % 40km to less than 60km (of those who travel to work) | % 60km and over (of those who travel to work) | Total of persons who travel to work | Total of persons who works mainly from home | Total of persons who works mainly at an offshore installation, in no fixed place, or outside the UK |
|---|---|---|---|---|---|---|---|---|---|---|---|
| Surrey | 18.9% | 20.6% | 22.5% | 21.1% | 9.1% | 3.9% | 2.5% | 1.5% | 251,411 | 260,171 | 77,948 |
| Elmbridge | 17.3% | 22.5% | 23.7% | 20.5% | 11.9% | 2.1% | 0.8% | 1.3% | 23,985 | 35,983 | 7,013 |
| Epsom and Ewell | 20.3% | 24.0% | 23.2% | 20.3% | 8.9% | 1.4% | 0.9% | 1.0% | 16,704 | 17,930 | 5,275 |
| Guildford | 23.5% | 21.0% | 18.6% | 18.8% | 7.7% | 4.4% | 4.2% | 2.0% | 30,246 | 30,814 | 8,714 |
| Mole Valley | 18.9% | 15.5% | 21.5% | 26.1% | 10.7% | 4.5% | 1.6% | 1.3% | 16,843 | 19,379 | 6,119 |
| Reigate and Banstead | 19.0% | 21.5% | 21.7% | 20.3% | 9.5% | 5.1% | 1.8% | 1.2% | 33,330 | 31,589 | 10,208 |
| Runnymede | 19.6% | 22.5% | 23.6% | 20.5% | 7.2% | 3.6% | 1.1% | 1.9% | 19,875 | 16,530 | 6,051 |
| Spelthorne | 14.6% | 25.0% | 31.2% | 17.9% | 7.7% | 1.6% | 0.9% | 1.2% | 25,242 | 18,497 | 7,799 |
| Surrey Heath | 18.1% | 19.6% | 20.6% | 21.8% | 10.5% | 3.7% | 3.6% | 2.1% | 21,196 | 18,509 | 5,659 |
| Tandridge | 13.3% | 14.2% | 25.2% | 26.3% | 12.4% | 5.1% | 2.3% | 1.2% | 17,618 | 18,441 | 6,516 |
| Waverley | 20.4% | 15.9% | 16.1% | 26.1% | 8.1% | 4.3% | 6.8% | 2.2% | 24,065 | 28,929 | 7,728 |
| Woking | 20.8% | 21.9% | 23.9% | 17.2% | 6.5% | 6.2% | 2.1% | 1.4% | 22,306 | 23,570 | 6,866 |
| South East | 21.7% | 21.6% | 19.3% | 18.7% | 8.8% | 3.8% | 3.2% | 2.9% | 2,206,086 | 1,603,079 | 662,614 |
| England | 20.3% | 23.4% | 21.7% | 19.3% | 7.4% | 3.1% | 2.4% | 2.5% | 14,267,450 | 8,321,252 | 3,816,512 |