Key Neighbourhoods
The 21 Health and Wellbeing Key Neighbourhoods in Surrey
Surrey’s Health and Wellbeing Strategy was refreshed in 2022 to include a particular focus on certain geographic areas of the county which experience the poorest health outcomes in Surrey. These areas were selected on the basis of the Overall deprivation score established in the English deprivation indices 2019.
The “Key Neighbourhoods” for especial prioritisation are the wards which included the most deprived “pockets” within the county. These small areas are called Lower Super Output Areas (‘LSOAs’).
Given that the most sharply focused areas of need are these LSOAs, this page provides insight summaries of each small area. There are two forms of report included: (1) an ‘easy read’ infographic two page summary of key information, and (2) a much longer and more comprehensive insight report. Each report can be accessed from the hyperlink in the table below. Similar resources have also been produced for the county as a whole and for each of the districts and boroughs in Surrey.
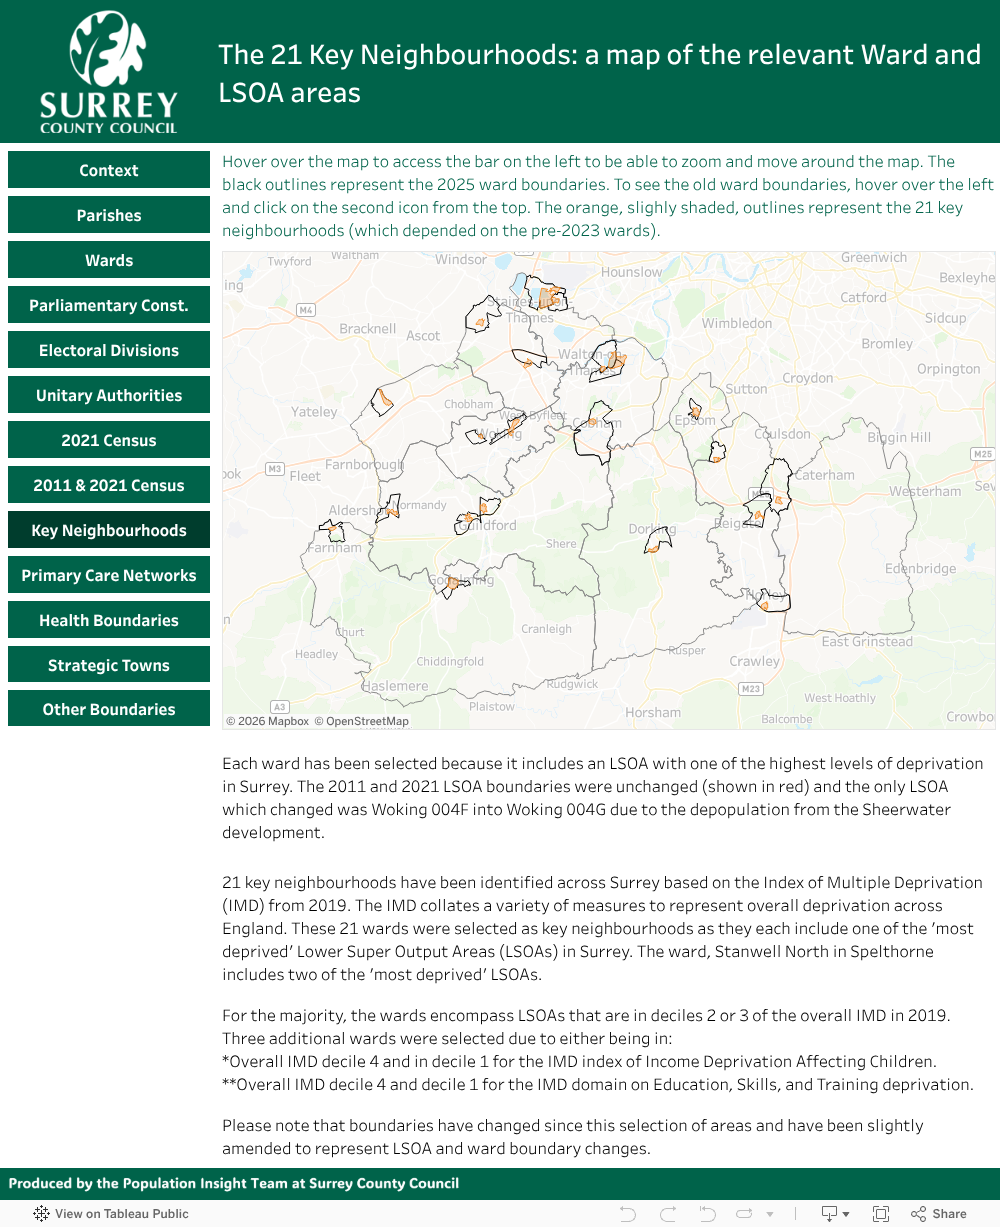
The infographic pages can also be viewed online in the screen beneath. At the bottom of this page is a mapping tool which highlights the locations of the Key LSOAs across Surrey.
Note that one of these areas (Woking 004F) has been substantially affected by redevelopment as part of the Sheerwater Regeneration Project, and consequently has a significantly reduced number of residents compared to 2019 (when the English Deprivation Indices were created). This LSOA now no longer exists for the purposes of new data releases, and has been combined following the 2021 Census with an adjoining LSOA (Woking 004C) to form a new geographic area called Woking 004G. New data releases and reports will therefore refer to Woking 004G.
The LSOAs in priority order:
| LSOA name (ranked by IMD score) | IMD Decile | Easy read insight | Detailed Insight Report | Key Neighbourhood (Electoral ward) | District / Borough | Health Area |
|---|---|---|---|---|---|---|
| 1. Reigate and Banstead 008A | 2 | Infographics | Insight | Hooley, Merstham and Netherne | Reigate and Banstead | East Surrey (SH) |
| 2. Woking 004F (LSOA is now within Woking 004G after the 2021 Census boundary changes) | 2 (rank is for the original 004F area – IMD has not been updated since boundary changes) | Infographics (uses 004G – after boundary changes) | Insight (uses 004G – after boundary changes) | Canalside | Woking | NW Surrey (SH) |
| 3. Guildford 012D | 2 | Infographics | Insight | Westborough | Guildford | Guildford and Waverley (SH) |
| 4. Guildford 007C | 2 | Infographics | Insight | Bellfields and Slyfield (previously Stoke) |
Guildford | Guildford and Waverley (SH) |
| 5. Spelthorne 001B | 3 | Infographics | Insight | Stanwell North | Spelthorne | NW Surrey (SH) |
| 6. Mole Valley 011D | 3 | Infographics | Insight | Dorking South (previously Holmwoods) | Mole Valley | Surrey Downs (SH) |
| 7. Reigate and Banstead 005A | 3 | Infographics | Insight | Tattenham Corner & Preston | Reigate and Banstead | Surrey Downs (SH) |
| 8. Epsom and Ewell 007A | 3 | Infographics | Insight | Court | Epsom and Ewell | Surrey Downs (SH) |
| 9. Spelthorne 002C | 3 | Infographics | Insight | Ashford North and Stanwell South | Spelthorne | NW Surrey (SH) |
| 10. Woking 005B | 3 | Infographics | Insight | Goldsworth Park | Woking | NW Surrey (SH) |
| 11. Runnymede 002F | 3 | Infographics | Insight | Englefield Green West | Runnymede | Windsor & Maidenhead (Frimley) |
| 12. Elmbridge 004B | 3 | Infographics | Insight | Walton South | Elmbridge | NW Surrey (SH) |
| 13. Reigate and Banstead 018D | 3 | Infographics | Insight | Horley Central and South | Reigate and Banstead | East Surrey (SH) |
| 14. Waverley 002E | 3 | Infographics | Insight | Farnham Heath End (previously Farnham Upper Hale) |
Waverley | NE Hampshire & Farnham (Frimley) |
| 14a. Spelthorne 001C | 3 | Infographics | Insight | Stanwell North | Spelthorne | NW Surrey (SH) |
| 15. Waverley 010A | 3 | Infographics | Insight | Godalming Central and Ockford | Waverley | Guildford & Waverley (SH) |
| 16. Runnymede 006D | 3 | Infographics | Insight | Chertsey St Anns | Runnymede | NW Surrey (SH) |
| 17. Reigate & Banstead 010E | 3 | Infographics | Insight | Redhill West and Wray Common | Reigate and Banstead | East Surrey (SH) |
| 18. Guildford 010C | 3 | Infographics | Insight | Ash Wharf | Guildford | Surrey Heath (Frimley) |
| 19. Elmbridge 008A | 4* | Infographics | Insight | Walton North | Elmbridge | NW Surrey (SH) |
| 20. Elmbridge 017D | 4** | Infographics | Insight | Cobham and Downside | Elmbridge | Surrey Downs (SH) |
| 21. Surrey Heath 004C | 4** | Infographics | Insight | Old Dean | Surrey Heath | Surrey Heath (Frimley) |
** Overall IMD decile 4 and in decile 1 (highest 10% nationally) for IMD domain Education, Skills and Training.
We have produced this interactive resource to help you to easily visualise the 21 Health and Wellbeing Key Neighbourhoods that have been identified for Surrey. You can zoom into this graph to see which roads/areas are included in these areas. A link to the Tableau website for the resource which is embedded below is also available.