Examples of insights provided by the Surrey Index
The Surrey Index provides information on all 11 boroughs and districts in Surrey, 187 wards, 30 Local Community Networks, and 26 Primary Care Networks, and includes the most recent data available. We capture data on 46 indicators relating to Foundations of Wellbeing, Basic Needs, Opportunity and Inclusion, and Prosperity and Growth. The indicators are then aggregated into an index, providing a score between 0 and 100 for each area, and a rank showing how the area compares to others. These scores and ranks and presented in an interactive dashboard.
To see the utility of the index we can take the examples of the neighbouring wards of Oxshott and Stoke D’Abernon in Elmbridge and its direct neighbour, Leatherhead North, in Mole Valley. These areas share a boundary in the north west of the county and Elmbridge is ranked first with an overall index score of 63.5, while Mole Valley ranks third with an overall index score of 55.4.
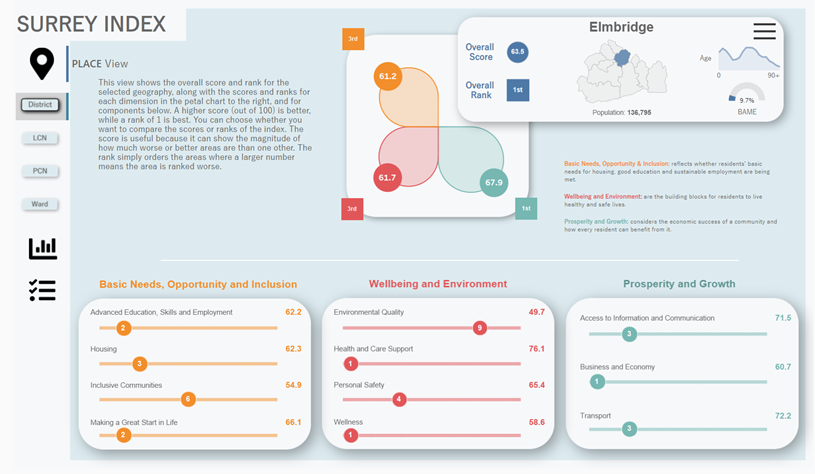
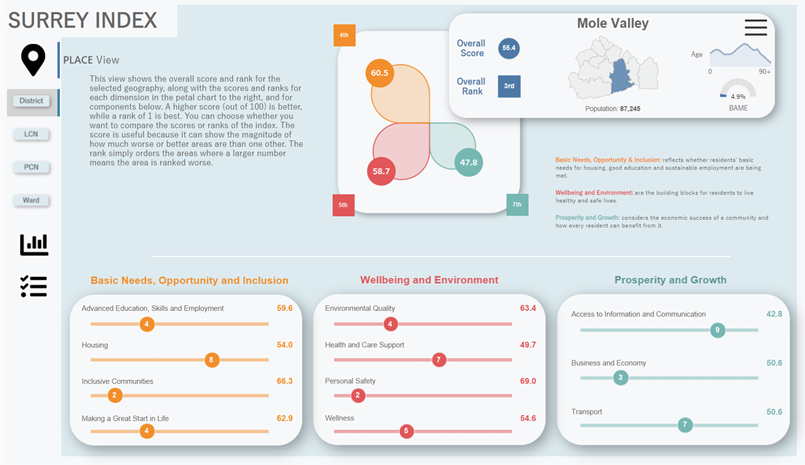
Despite very similar overall performances at the borough and district level, it is a very different story for these two neighbouring wards at several index levels. On the Wellness component these two neighbours differ by more than 30 points, with Oxshott and Stoke D’Abernon ranked 6th and Leatherhead North ranked 184th. Looking at this component a little closer we see that the difference in healthy life expectancy between these two wards is nearly 10 years in Oxshott and Stoke D’Abernon’s favour. In addition, nearly 40% of children in Year 6 in Leatherhead North are overweight compared to 18% in Oxshott and Stoke D’Abernon.
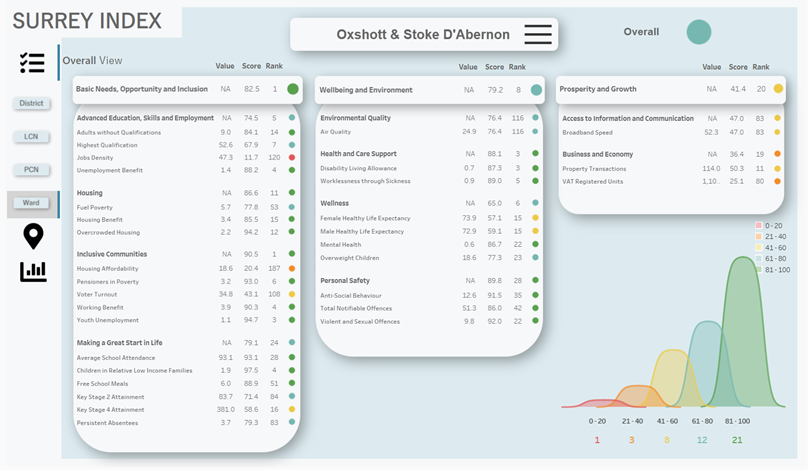
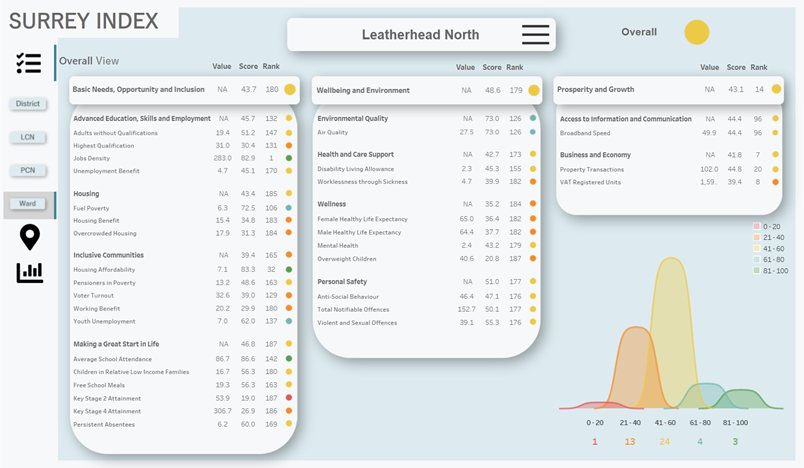
Thanks to the Index, we can see these disparate outcomes reflected in other indicators on the dashboard too; there are substantial variations in everything from education, skills and employment, to download speeds, to green spaces. The Index allows us to probe these differences further and understand the relationship between these social indicators and the unequal health outcomes we find in urban areas.
Oxshott and Stoke D’Abernon and Leatherhead North also vary significantly on Inclusive Communities, were they rank 1st and 165th respectively, with scores of 90.5 and 39.4. Looking at this component in more detail we see that in Oxshott and Stoke D’Abernon only 4% of the population are supported by Working Benefits compared to 20% in Leatherhead North; likewise, 3% of older residents in Oxshott and Stoke D’Abernon claim Pension Credit compared to 13% in Leatherhead North. Oxshott and Stoke D’Abernon is ranked last in the county for Housing Affordability.
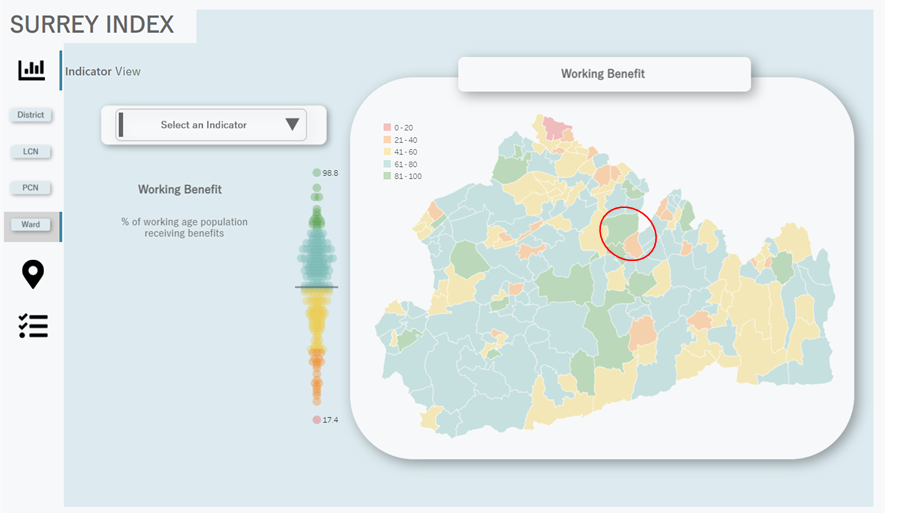
For all these examples we need to look in more detail to find the possible causes and potential solutions for the disparity, but the Surrey Index gives us a starting place to start asking important questions and think about the correlations these have with other outcomes, and to look for other patterns of relationship.
How do I find out more?
These dashboards are owned by the Insight, Analytics and Insight Intelligence team at Surrey County Council. For any questions about the tool please email [email protected]. The data was is primarily sourced from publicly available datasets.
