Understanding digital exclusion in Surrey
According to recent research, 11 million people (21%) in the UK are digitally disadvantaged, with an estimated 10 million people not able to access the Internet themselves and lacking basic digital skills needed for day-to-day life. An estimated 5.8 million people have never used the internet at all.
Why does this matter?
Being digitally excluded limits participation in many aspects of life, including access to council and government services. Digital exclusion is inextricably linked to wider inequalities in society and is more likely to be faced by people over 65, those on low incomes, and disabled people.
Since the pandemic, for the people on the wrong side of the digital divide, the disadvantages associated with being unable to access or use IT have never been more pronounced. The public health crisis currently gripping the UK stands to make the impacts of digital exclusion worse for the millions of people affected, and the poorest will be hit the hardest.
In Surrey, an estimated 200,000 people suffer from digital exclusion. In 2021, Surrey Heartlands funded a research programme to develop a better understanding of digital exclusion across the region and find ways to tackle it.
Through this project we wanted to gain a better understanding of who is currently digitally excluded in Surrey, focusing especially on the needs of highest priority groups. To do so, we have:
- Developed a ‘persona’ bank to show the different needs, experiences and barriers of people who are experiencing digital exclusion. While fictional characters, these profiles are based on research carried out and validated by residents and local stakeholders working everyday with digitally excluded people in Surrey.
- Broken down the estimated 200k people at risk of digital exclusion, using the persona bank as starting point to quantify the size of each segment. These are included in the presentation below.
- Created a Surrey’s digital exclusion map to show the geographical spread of digital exclusion indicators.
The personas
Surrey’s digital exclusion map
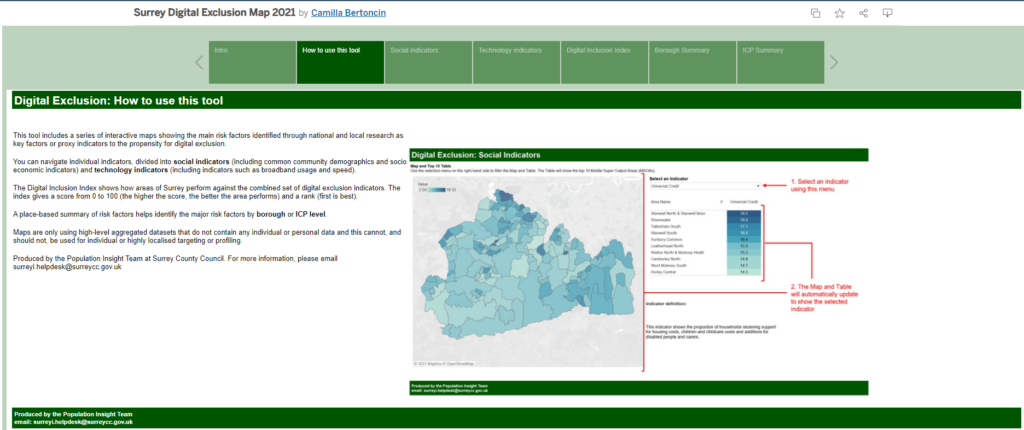
This tool includes a series of interactive maps showing the main risk factors identified through national and local research as key factors or proxy indicators to the propensity for digital exclusion.
The maps use datasets divided into social indicators (including common community demographics and socio-economic indicators) and technology indicators (including indicators such as broadband usage and speed).
There are also an overall digital exclusion index, which provides a way of understanding digital exclusion based on the whole range of social and technical outcomes in Surrey. The index highlights areas of Surrey that perform well or poorly against the combined set of digital exclusion indicators. The index gives a score from 0 to 100 (a higher score is better) and a rank (first is best) for each area.
Finally, a place-based summary of risk factors helps identify the major risk factors by district or ICS level. This will allow the different districts, boroughs and health organisations to compare, contrast and hopefully join forces to tackle digital exclusion, when appropriate.