Census 2021: Household deprivation
Household Deprivation Estimates from the 2021 Census
Headlines
- Just under half of Surrey households (42.9%) were classified as deprived in some way.
- While Surrey had lower proportions of households which were classified as deprived than England and the South East, 10,403 Surrey households (2.2%) were classified as deprived in three/four of the dimensions of deprivation.
The raw data from this Census release has been processed by the Population Insight Team and is also available on Surrey-i.
The Office for National Statistics produced interactive maps for the 2021 Census results. The ONS interactive map of the household deprivation statistics have been embedded at the bottom of this page.
Household deprivation
Household characteristics such as household size and composition have been released for the 2021 Census. Households were also classified by dimensions of deprivation and were considered deprived if they met one or more of the four dimensions of deprivation:
- ‘employment: where any member of a household, who is not a full-time student, is either unemployed or long-term sick’
- ‘education: no person in the household has at least five or more GCSE passes (grade A* to C or grade 4 and above) or equivalent qualifications, and no person aged 16 to 18 years is a full-time student’
- ‘health and disability: any person in the household has general health that is “bad” or “very bad” or has a long-term health problem’
- ‘housing: the household’s accommodation is either overcrowded, with an occupancy rating of negative 1 or less (implying that it has one fewer room or bedroom required for the number of occupants), or is in a shared dwelling, or has no central heating’
This is the first measure of disadvantage and deprivation that has been made available from the 2021 Census. Surrey, on average, had less households which were deprived than other parts of the South East and England with 57.1 per cent of households which did not meet any of the dimensions of deprivation. Overall, 42.9 per cent of Surrey households (representing 206,798 households) were deprived in at least one of the dimensions, which was lower than the national (51.6%) and regional (48.0%) averages.
Some households had a combination of disadvantage and there were 733 Surrey households which met all four of the dimensions of deprivation, and 9,670 which met three of the four dimensions.
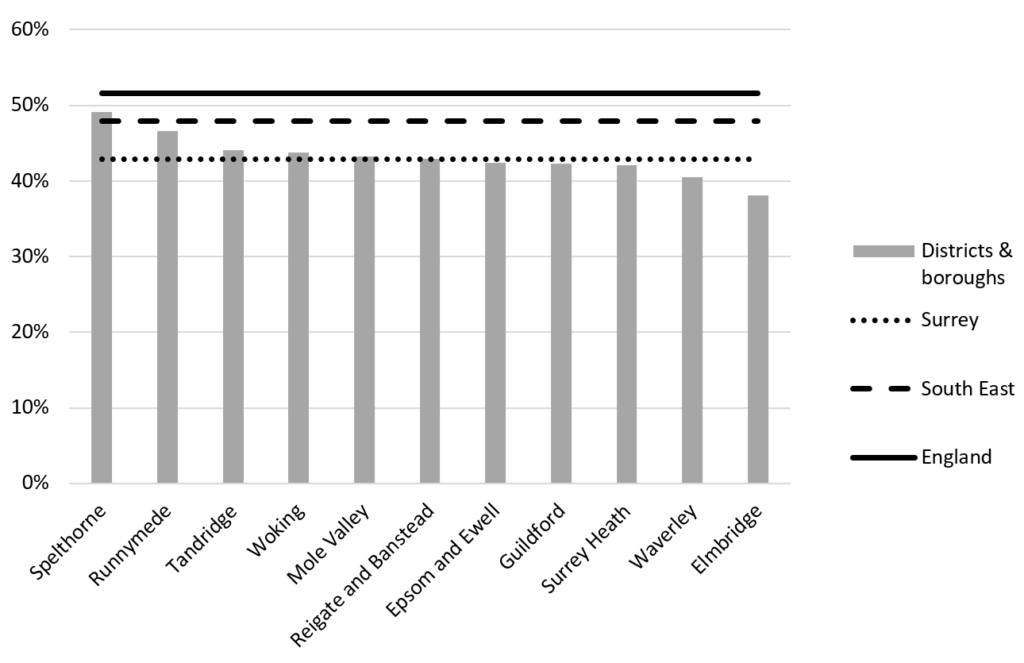
The highest proportion of households which met at least one dimension of deprivation was in Spelthorne (49.1%) and the lowest was in Elmbridge (38.1%). Every borough and district in Surrey had lower overall proportions of households which met at least one dimension of deprivation than the national average, and only Spelthorne had a higher proportion than the South East overall.
The percentage of Surrey households which were considered deprived in at least one of the four dimensions of deprivation
The distribution of Surrey households by whether they were considered deprived in the four dimensions of deprivation
| Area name | No dimensions | One dimension | Two dimensions | Three dimensions | Four dimensions | Total households |
|---|---|---|---|---|---|---|
| Surrey | 57.1% | 30.8% | 9.9% | 2.0% | 0.2% | 481,819 |
| Elmbridge | 61.9% | 28.1% | 8.4% | 1.6% | 0.1% | 55,587 |
| Epsom and Ewell | 57.6% | 30.6% | 9.8% | 1.9% | 0.2% | 31,321 |
| Guildford | 57.7% | 30.7% | 9.5% | 1.9% | 0.2% | 55,760 |
| Mole Valley | 56.7% | 31.0% | 9.9% | 2.1% | 0.2% | 37,141 |
| Reigate and Banstead | 57.1% | 30.8% | 9.9% | 2.1% | 0.2% | 59,849 |
| Runnymede | 53.4% | 32.5% | 11.8% | 2.2% | 0.1% | 34,838 |
| Spelthorne | 50.9% | 33.6% | 12.6% | 2.7% | 0.2% | 41,805 |
| Surrey Heath | 57.9% | 31.1% | 9.1% | 1.7% | 0.1% | 36,008 |
| Tandridge | 56.0% | 31.6% | 10.1% | 2.1% | 0.1% | 35,622 |
| Waverley | 59.5% | 29.9% | 8.8% | 1.6% | 0.1% | 52,448 |
| Woking | 56.2% | 31.0% | 10.4% | 2.2% | 0.2% | 41,437 |
| South East | 52.0% | 32.8% | 12.2% | 2.8% | 0.2% | 3,807,966 |
| England | 48.4% | 33.5% | 14.2% | 3.7% | 0.2% | 23,436,086 |
The Office for National Statistics has produced interactive maps for the 2021 Census results. The maps below show the distribution of households by whether they were not considered deprived or considered deprived by one to four dimensions.
Hover over the map to see each of the area names and values. Zoom in and out of these maps to see the data at smaller geographical areas.
Produced by the Office for National Statistics, 2022