

2001-2003 to 2018-2020
Next release: early 2023.
Life Expectancy
Data included: England, South East, Surrey, Surrey LAs.
Latest data included:
Life Expectancy (including inequalities) 2020 to 2022 (next release: early 2025)
Health State Life Expectancy 2020 to 2022 (next release: Spring 2025)
Summary
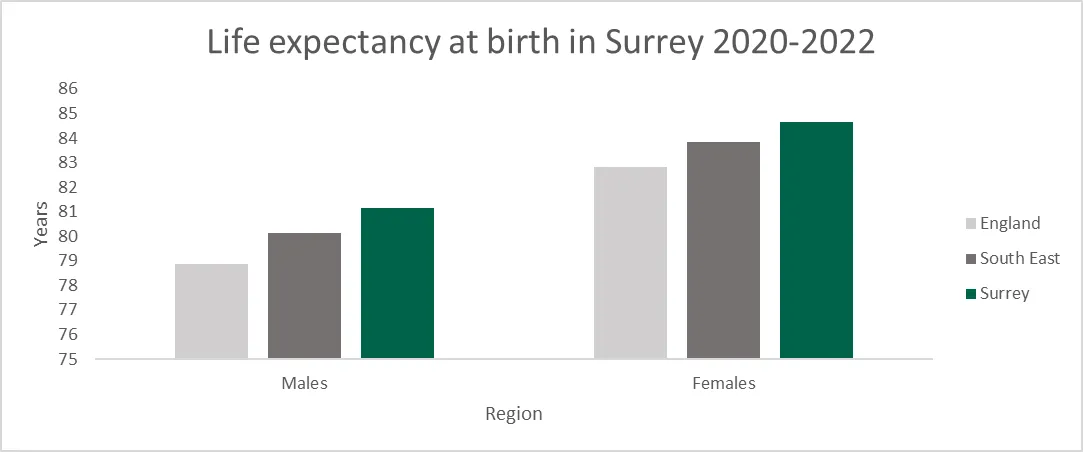
Surrey residents have longer life expectancy than the South East as a whole. This means that because the South East has longer life expectancy than England, Surrey residents have longer life expectancy than most of the country. The life expectancy at birth in Surrey for those born in 2020 to 2022 was 81.1 for men and 84.7 for women (compared to 80.1 and 83.8 for the Southeast and 78.9 and 82.8 for England).
Life Expectancy at Birth
Life expectancy trends in England have improved consistently for more than a century – reflecting better living conditions, public health interventions and medical advances, however the latest data shows a drop in that trend. Life expectancy indicators are used at a national and local level, to monitor trends in health and well being over time and between different population groups.
Life expectancy at birth is a measure of the average number of years a person would expect to live based on contemporary mortality rates. For a particular area and period, it is an estimate of the average number of years a new-born baby would survive if they experienced the age-specific mortality rates for that area and time period throughout their life. Figures reflect mortality among those living in an area in each period, rather than mortality among those born in the area. Public health data shows that residents of Surrey have longer life expectancy than people in the Southeast and England as a whole. The life expectancy at birth in Surrey for those born in 2020 to 2022 was 81.1 for men and 84.7 for women (compared to 80.1 and 83.8 for the Southeast and 78.9 and 82.8 for England).
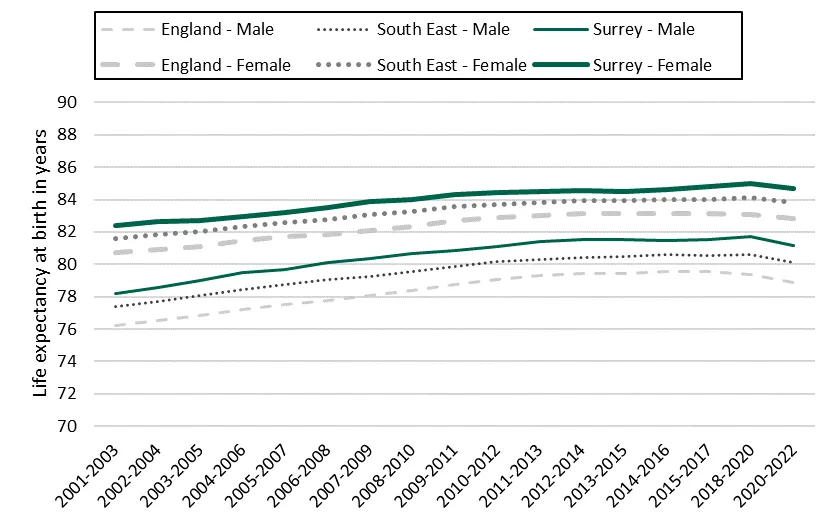
 Life expectancy at birth for Surrey has been on the increase. On average, males born in 2020 to 2022 could expect to live 2.9 years longer than those born in 2001-2003, and women 2.2 years. Although there is greater is improvement for males than females for this period, females overall have higher life expectancy at birth.
Male and female life expectancy at birth in Surrey, South East and England 2001-03 – 2018-20
There are several indicators describing life expectancy published regularly by Public Health England. Table 1 summaries the current data on life expectancy for Surrey, compared with the national average and the southeast.
Life expectancy Overview – Surrey
Since approximately 2011, the rate of increase in life expectancy has slowed. More recently the coronavirus (COVID-19) pandemic led to increased mortality in 2020 and 2021, and the impact of this is seen in the life expectancy estimates for 2020 to 2022. The reasons for the post-2011 slowdown in life expectancy improvements and 2015 fall in life expectancy have been widely debated. Discussion has centered around austerity, influenza seasons and worsening housing conditions.

Life expectancy at age 65
Life expectancy at age 65 is different to Life expectancy at birth, this metric considers as people age, their overall life expectancy increases, because they would have either avoided or survived many of the major causes of early death. For this reason, Mortality rates applied to his group are different as we expect life expectancy at 65 to exceed that predicted at birth. Life expectancy at 65 years is an indicator used to measure the extent to which people are enabled to remain healthy in older age. In Surrey, male life expectancy at 65 is currently 19.53 for males and 21.96 for females, greater than the national average.
Healthy Life Expectancy (HLE)
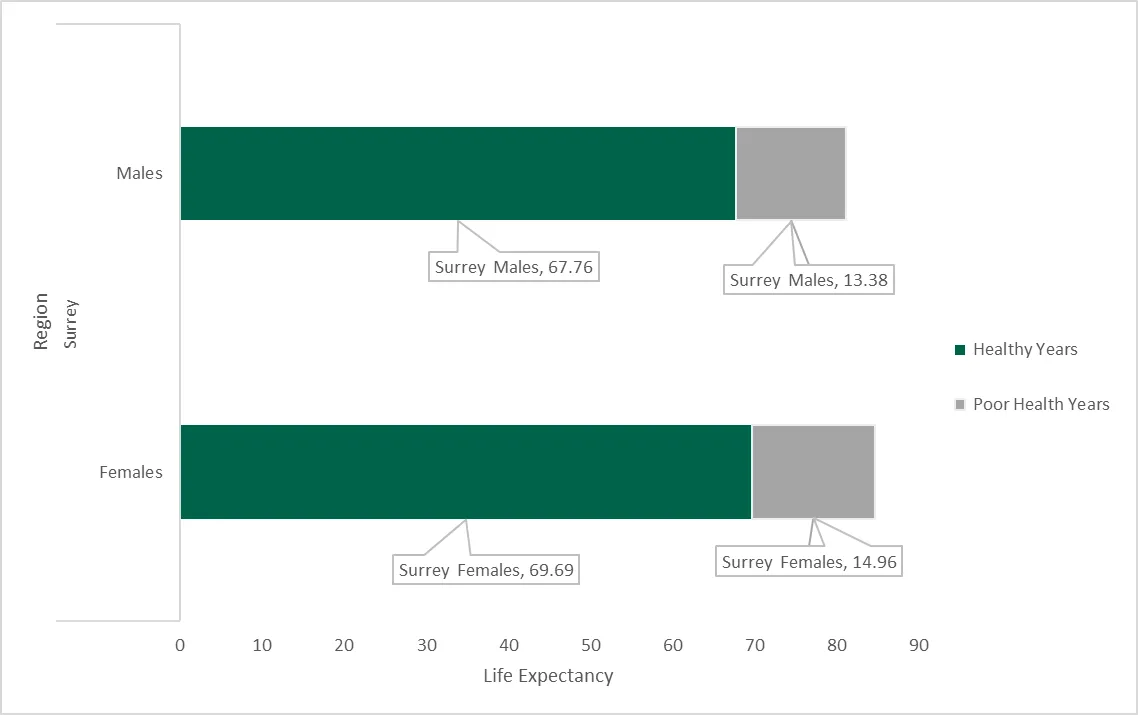
As people reach the later part of their working lives, poor health, disability and long term health conditions can affect a person’s ability to sustain employment and affect living conditions prior to pension age. There may also be increased care needs. Male HLE currently stands at 67.76 years. This means that currently men in Surrey can, on average expect 13.38 years of poor health towards the end of their lives. Female healthy life expectancy currently stands at 69.69. As women can stand to see more years spent in good health, and a longer life expectancy, they can therefore, also expect to spend longer living in poor health, with around 15 years. This is higher than both the Southeast and England. Improving HLE remains a priority across government. There is a need to better understand what drives HLE to help inform policy. HLE is calculated using two factors: self-reported good health in the population and mortality rates.
COVID-19 & Social Inequalities in Life Expectancy
Many of the factors contributing to inequality in life expectancy are preventable.3 Inequalities can also exist through specific characteristics such as sex, ethnicity, disability and social exclusion. These inequalities were made very clear in the recent COVID-19 pandemic where mortality rates were often highest in groups which already experienced poorer overall outcomes. The Covid-19 epidemic caused life expectancy in 2020 to fall to its lowest levels in a decade and has affected the population disproportionally across different geographic and socio-economic groups Surrey.
Geographic inequalities exist for male and female life expectancy across England and the South East. However, these inequalities have changed over time. In 2017–19 the gap in life expectancy at birth in Surrey was 3.3 years. In 2020–22, the gap widened to 3.51 years. This partly reflects higher male mortality rates in the pandemic.
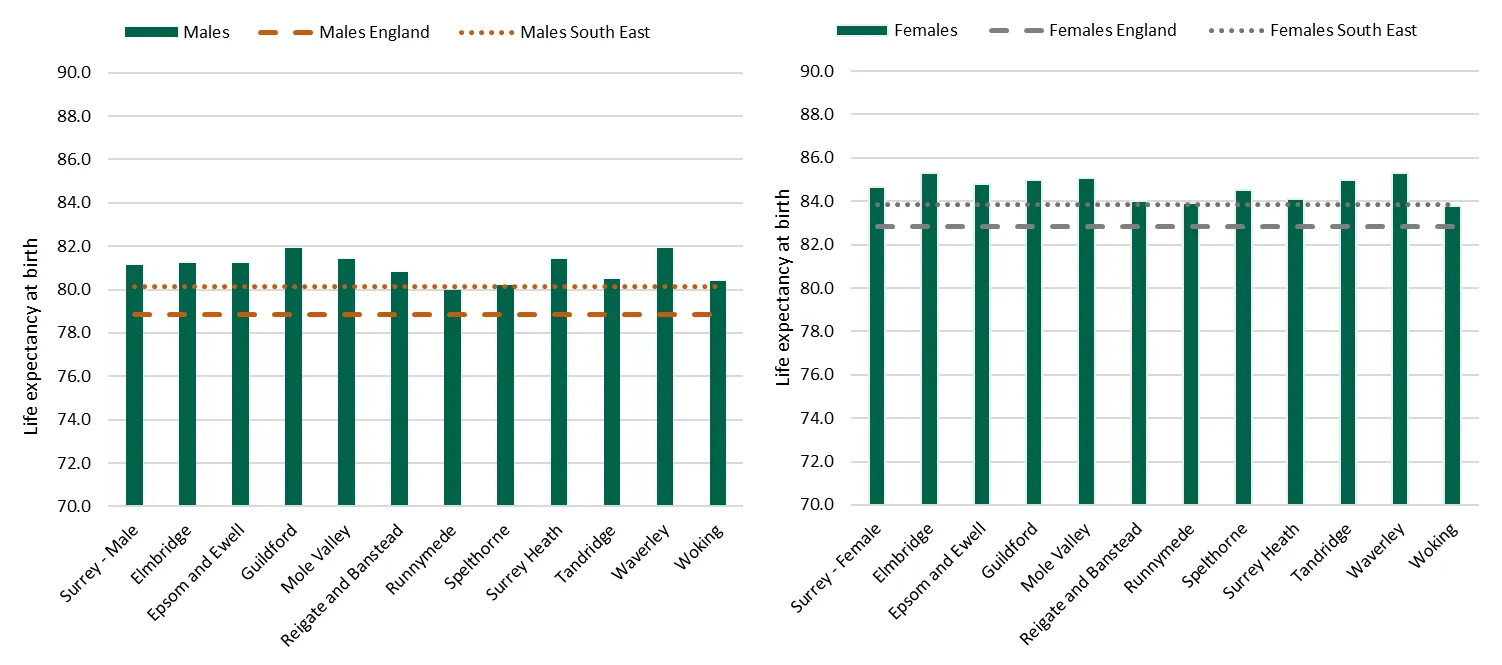
Life expectancy (2020–22) for males is lowest in Runnymede (80 years) and highest in Elmbridge (82.1). Life expectancy for females (2020–22) is also lowest in Runnymede (84.2 years) and is highest in both Elmbridge, and Waverly (85.3 years). Additionally, inequalities in life expectancy exist between the most and least deprived areas nationally and in Surrey. The range in years of life expectancy across boroughs in Surrey is 2.1 years for males and 1.5 years for females.
The pattern and distribution of life expectancy at birth across Surrey reflects the distribution of deprivation in the local area.
Due to major achievements in healthcare and societal changes, people in the UK are living longer than ever before. Older people make up a growing proportion of the population, making an increasing contribution to society – so in addition to increasing life expectancy it is important our older people live their years in good health. Without developments in healthy life expectancy or in the productivity of the national health service, the UK’s health and care costs will continue to increase as the population ages. Interventions throughout a person’s lifetime, such as those promoting healthy living and decreasing social isolation, have significant potential to affect their health in old age.
Due to this demographic shift, there will be increased demand for health and care services which has great implications for public expenditure in the future. The Office for Budget Responsibility (OBR) highlights health and long-term care as two of the “main drivers of the increase in non-interest spending… due mainly to the ageing population”. They project expenditure on health to grow from 7.3 to 8.3% of GDP. All public sector organisations have a role to play in addressing health disparities and health inequalities. Action from Surrey County Council requires addressing the root causes, preventing harmful environmental influences, and reducing its adverse effect on people.
While life expectancy have improved drastically since records began, an individual’s chance of attaining this age is still affected by their own characteristics and personal circumstances. Overall, the data shows that inequalities in life expectancy have existed across Surrey for a long time and have worsened over the past decade and throughout the pandemic. Good health and well-being in Surrey is very important – this enables people to achieve their potential, supports economic growth and helps to build a stronger society. Reducing health inequalities and increasing longevity at older ages in Surrey is not just about improving health care towards end of life but also means making sure health is maintained through the lifetime by ensuring the building blocks of health are in place – such as decent housing, good work and an adequate income.
Reference links:
ONS: Life expectancy estimates, all ages, UK - Office for National Statistics (ons.gov.uk)
Easier to use version: Public health profiles - OHID (phe.org.uk)

2001-2003 to 2018-2020
Next release: early 2023.
2017-2019
Next release: Spring 2022.
Life expectancy, healthy life expectancy, disability-free life expectancy
2010-12 to 2018-20
Next release: early 2023.
This represents the range in years of life expectancy across the social gradient from most to least deprived, based on a statistical analysis of the relationship between life expectancy and deprivation across all deprivation deciles.