Emotional and Mental Wellbeing in Surrey Adults
Emotional and Mental Wellbeing in Surrey Adults
Publication date
This chapter was published in March 2023.
Contents
- Common Mental Health Problems
- Incidence Adult Mental Health Problems
- Index of Multiple Deprivation – Mood and Anxiety Indicators
- Self-reported Wellbeing
- QOF: Depression
- Long Term Mental Illness
- QOF: Severe Mental Illness (SMI)
- Suicide and Injury Undetermined
- Eating Disorders
Socio-economic, Cultural and Environmental Conditions: The Current Context
Living and Working Conditions
Community Safety and Feeling Safe
Workplace and Employment
Health Environment
Social Isolation and Loneliness
- Populations at Risk
- Young Adults
- Adults
- Perinatal
- Older People
- Carers
- Ethnicity
- Gypsy, Roma, Traveller (GRT) Communities
- People with Learning Disability
- Neurodivergence
- Asylum Seekers, Refugees and Migrants
- Adverse Childhood Experiences/Life Events
- Experience of Bereavement
- Relationship Breakdown
- Multiple Adverse Life Events
- Sexuality/LGBTQ+
- Armed Forces Community Veterans
- Physical Health and Health Behaviours
- Physical Health
- Access to Healthcare
- Health Behaviours
- Substance Use
- Hospital Admissions due to Alcohol
- Gambling
Universal Services
- Adult Social Care Mental Health Team
- Digital
- Local Insights
- Social Prescribing
- Green Social Prescribing
Primary Care
Secondary Care
- Acute Mental Health Hospital Admissions
- Emergency Mental Health Hospital Admissions
- Detentions under the Mental Health Act
- Section 136 Detentions
- Emergency Admissions for Self-Harm
- Avoiding admission to mental health hospitals, and how discharges could be safely made more quickly.
- Concurrent Contact Mental Health and Substance Use Services
- Factors Supporting Recovery: Addressing Stigma
- Factors Supporting Recovery: Employment
- Factors Supporting Recovery: Care Planned Approach
- Factors Supporting Recovery: Wellbeing
- Recommendations for Policy Makers and Commissioners
- Area 1: Population prevention. Tailor, develop and promote place-based population wellbeing approaches including the determinants of wellbeing.
- Area 2: Communities. Utilise research and coproduction of wellbeing and mental health services with people with lived experience, residents (via community development) and VCSE sector provision.
- Area 3: Address current and predicted unmet need with further equality impact assessments in key areas.
- Area 4: Develop pathways that support holistic approaches including escalation and de-escalation across the system.
- Area 5: Ensure seamless read across with Children and Young People’s needs assessment to inform whole family responsive pathways.
Appendices
- A – References
- B – Health and Wellbeing Board Matric
- C – Common Mental Health Conditions
- D – Prevention Interventions
Overview
This chapter explores the emotional and mental wellbeing of residents of Surrey. The chapter considers social and environmental influences on the mental health of residents in Surrey. This is followed by an overview of services in place in Surrey. The chapter also consider mental health for key population groups in Surrey, many of which form part of the Surrey Health and Wellbeing Strategy Priority Populations.
This chapter is one of four current chapters considering Mental and Emotional Wellbeing in Surrey Residents across the life course.
| Starting Well (0-4) | Perinatal |
| Developing Well (5-16) | Emotional Wellbeing and Mental Health Children & Young People |
| Transitioning to Adulthood (17-24) | Both the Adult and the Children & Young People chapters |
| Living Well (25-64) | Emotional and Mental Wellbeing in Surrey Adults |
| Aging Well (65+) | Dementia |
A chapter on Loneliness and Social Isolation was published in 2024: JSNA Loneliness and Social Isolation | Surrey-i (surreyi.gov.uk)
This chapter is based on the latest available population data at October 2022. The chapter is informed by the Mental Health Tableau Dashboard which has been developed locally by the Public Health Intelligence and Insight Team in Surrey County Council. It will be replaced with an expanded Dashboard that is being developed. The Public Mental Health Dashboard developed by Office for Health Improvement and Disparities (OHID) for use by local authority Public Health teams and others has also been applied throughout this chapter.
1. Executive Summary
The chapter outlines the most up to date intelligence of expressed and expected need for mental and emotional wellbeing in Surrey. The key protective factors for good emotional and mental wellbeing are considered alongside data sources which can support further exploration of opportunities for intervention at place. The following key strategic drivers for mental and emotional wellbeing in Surrey, were considered in the writing of this chapter.
- Health and Wellbeing Strategy.
- The Fuller Stocktake recommendations for community led action.
- CORE20Plus5 for adult mental and emotional wellbeing are considered.
The chapter is informed by the Mental Health Tableau Dashboard which has been developed locally by the Public Health Intelligence and Insight Team in Surrey County Council (SCC). The tableau dashboard for mental and emotional wellbeing provides links to graphs and intelligence on demand for services and intelligence on vulnerable populations. The body of the chapter draws out the factors related to risk and protection of good emotional and mental wellbeing which can be applied to data sets on geographies as required for targeted intervention design. The Public Mental Health Dashboard developed by Office for Health Improvement and Disparities (OHID) for use by local authority Public Health teams and others has also been applied throughout this chapter.
The mental health system partnership collaboratively developed the chapter drawing on nationally available and local datasets to provide a repository of portals for accessing up to date information for surrey.
The chapter outlines specific tools and data sources to inform the development of place-based plans for primary, secondary and tertiary prevention and treatment, reviewing services for equity of access and outcomes. The chapter outlines key information for delivery of the health and wellbeing within Surrey.
Area 1: Population prevention: Tailor, develop and promote place-based population wellbeing approaches including the determinants of wellbeing.
Area 2: Communities. Utilise research and coproduction of wellbeing and mental health services with people with lived experience, residents (via community development) and VCSE sector provision.
Area 3: Address current and predicted unmet need with further equality impact assessments in key areas
Area 4: Develop pathways that support holistic approaches including escalation and de-escalation across the system.
Area 5: Ensure seamless read across with Children and Young People’s needs assessment to inform whole family responsive pathways.
2. Background
The World Health Organisation (WHO) defines mental health as “a state of well-being in which the individual realizes his or her own abilities, can cope with the normal stresses of life, can work productively and fruitfully, and is able to make a contribution to his or her community”. This document will consider mental health in adults. This will include factors which protect mental health and risk factors. The expressed need of residents in Surrey will be explored and recommendations made for addressing any gaps.
The Surrey Health and Wellbeing Board identified mental health as a priority to understand the need in Surrey to inform policy making and commissioning decisions.
3. JSNA Process
Aims
This Joint Strategic Needs Assessment (JSNA) for Emotional and Mental Wellbeing in Surrey provides an overview of the mental and emotional wellbeing needs in Surrey to implement the OHID Toolkit A – Place Based Planning. This should enable population health system planning to meet the needs at scale.
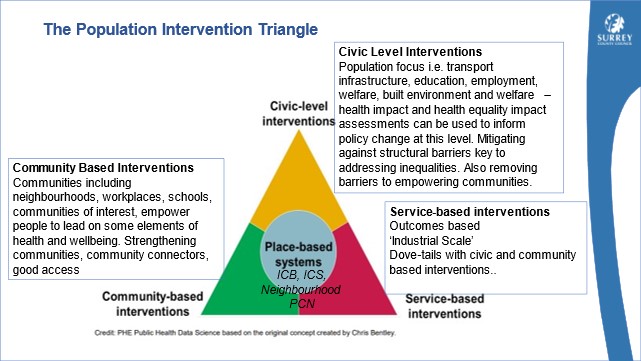
Figure 1. OHID Population Health Triangle
This JSNA should be used alongside the OHID Toolkit B – Civic Support to Communities and Toolkit C – Service to community, to ensure needs based, segmentation and coproduced planning at place. This JSNA should also be used to inform next steps taking into consideration the principle of ‘proportionate universalism’, resourcing and delivering of universal services at a scale and intensity proportionate to the degree of need.
Governance
The JSNA governance is defined and organised at four levels: Health and Wellbeing Board (HWB), JSNA Oversight Group (OG), JSNA Working Group and JSNA chapter delivery groups. The HWB has a statutory requirement to produce a JSNA and delegates the responsibility and management for the JSNA to the JSNA OOG.
The JSNA OG chaired by the Director Public Health provides senior management and executive leadership to the JSNA implementation and ensures that the JSNA remains aligned to the strategic joint priorities for the Surrey HWB and supports partnership working at different levels within Surrey.
Below the JSNA OOG and reporting to it is the JSNA Working Group. This consists of the lead officers of each of the JSNA chapters in production and is chaired by the Public Health Analyst Team Lead. The Working Group meets every three weeks to monitor chapter progress and share best practice. Daily the Chapter Delivery Group leads on chapter production, agreeing the scope, timelines, contributing authors and reported on progress to the working group.
Strategic Drivers and Evidence Base
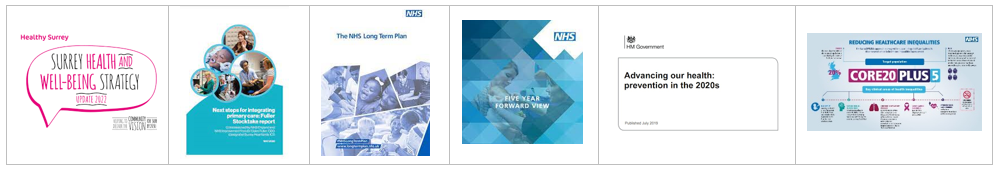
Surrey Health and Wellbeing Strategy
Next steps for integration primary care: Fuller Stocktake report
Advancing our health: prevention in the 2020s
Core20PLUS5 (adults) – an approach to reducing healthcare inequalities
As outlined in both the JSNA Chapter ‘Surrey Context: People and Places’ and the Surrey Health and Wellbeing Strategy (HWBS), 21 Surrey wards have been identified as containing the most deprived Lower Super Output Areas (LSOAs) and are being prioritised in strategies and action plans. The HWBS also has people with Severe Mental Illness (SMI) as a priority population group.
The evidence base for interventions are considered across the life course:
| Living Well | New Economics Foundation (NEF) commissioned by central government’s Foresight Report which includes interventions to support own wellbeing (Five Ways to Wellbeing: the Evidence) and direction on how this could be used at scale for population level impact (The results of a scoping exercise to see how the Five Ways are being used) |
| Working Well | NICE Guidance for Promoting Wellbeing at Work 2022 (PH22) outlines strategic drivers, offers for the workforce and training to enhance wellbeing (Mental health and work, 2007, FPH) |
| Ageing Well | NICE guidance on mental wellbeing and older people (PH16) Older people: independence and mental wellbeing Mental wellbeing of older people in care homes Quick guide to promoting positive mental wellbeing for older people |
Interpreting data
The contents of this JSNA have been informed by OHID JSNA toolkit Mental Health and outcomes for Surrey Health and Wellbeing Strategy, Priority 2: Supporting people’s mental health and emotional well-being by preventing mental ill health and promoting emotional well-being (Appendix 1). Where possible data is presented at Surrey County level and District & Boroughs level and compared to national, regional and where available Combined Intelligence for Population Health Action (CIPHA) will be used, for comparative data with the closest neighbour.
4. Mental and Emotional Wellbeing in Surrey
Common Mental Health Problems
Common mental health problems cover a broad range of individual mental health conditions. NICE lists depression, anxiety disorders and post-traumatic stress disorder (PTSD) in their definition of common mental health disorders. They are labelled as common as they affect more people than all other mental conditions combined. This section provides an overview of the prevalence of common mental health problems throughout Surrey, the impacts they have and the influence of wider determinants on their prevalence across Surrey. Other JSNA chapters such as the Substance Use chapter explore these conditions in more detail.
Up to date information is available on the Mental Health Dashboard: JSNA Mental Health Published Tableau Dashboard
Incidence Adult Mental Health Problems
The national Adult Psychiatric Morbidity Survey (APMS) is the only data source to assess/ screen for the prevalence of both treated and untreated mental disorders in England. This includes both people with diagnosed disorders and people who have not received a formal diagnosis. For this reason, the prevalence reported in the APMS is higher than those based on service data below.
The APMS demonstrates there is a considerably higher prevalence of mental health problems among the general population than the number of people receiving treatment. Often the stigma that surrounds mental health can make it harder for people to seek help from services, hence the importance of widely available self-help information and anti-stigma interventions.
The APMS Survey Common Mental Disorders (CMD) are listed as depression, Generalised Anxiety Disorder (GAD), Panic Disorder, Phobias, Obsessive Compulsive Disorder (OCD) and CMD-Not Otherwise Specified (CMD-NOS).
The APMS survey uses the Clinical Interview Schedule – Revised (CIS-R) to assess for the prevalence of CMDs. The CIS-R is a standardised, structured assessment interview used to measure the presence of nonpsychotic symptoms.
Key national findings on Common Mental Disorders (CMDs), from the Adult Psychiatric Morbidity Survey (APMS):
- 18.9% of adults aged 16-64 in 2014 reported having a CMD in the past week. This rate increased from 17.6% in 2007.
- More women than men reported having a CMD in the previous week (23.1% vs 14.7%) (2014).
- Of the 9 England regions, the South East had the lowest age-standardised and observed rates of people with any CMD in 2014 (13.6% & 13.6% respectively).
- Gaps in self-diagnosis and professional diagnosis have been observed. In 2014, 43.4% of respondents stated they had at some time, self-diagnosed a CMD, whereas only 27.4% reported ever being professionally diagnosed for a CMD.
One measure of the severity of neurotic symptoms is the CIS-R score. A score of 12 or greater indicates symptoms of anxiety and depression of a level likely to benefit from acknowledgement and possible intervention.
The number of people aged between 16-64 report scores of 12 or greater rose from 14.1% in 1993 to 17.5% in 2014.
The proportion of people aged 16-64 in 2014 with CIS-R scores of 12 or greater was larger in women than men, 21.4% vs 13.6%.
National key CMD findings from the APMS pertaining to the wider determinants of health:
Prevalence of any CMD in last week by household type varied greatly.
- Prevalence was highest among 16-59 year olds living in a single adult house with no children (29.4%)
- Prevalence was lowest in those living in households of 2 adults, one or both 60+, with no children (10.4%)
Prevalence of any CMD in last week by employment status varied greatly.
- Those in full-time employment with 2.1 times less likely to experience a CMD in the previous week, compared to the economically inactive.
- Prevalence of any CMD in the last week by benefit status also varied
- Respondents receiving Employment and Supporting Allowance were 3.8 times more likely to report experiencing a CMD in the last week than those that did not
- Those receiving out-of-work benefits were 2.9 times more likely to report a CMD in the last week and those receiving Housing benefit were 2.5 times more likely to report a CMD in the last week.
[It is recognised that this data is historic, when 2021 data is available from OHID it will be added here. There is currently no indication of publication date.]
There was a predicted 1.3% increase in mental disorder (diagnosed and undiagnosed) in 16-64 years between 2017/ 2020.
Number of people in Surrey aged 16-64 predicted to have a mental disorder
| Indicator | 2014 | 2017 | 2020 | % Change |
| Estimated number predicted to have these conditions | 180,346 | 182,747 | 1.3% | |
| Estimated population 16-64yrs | 733,113 | 742,872 | 1.3% | |
| Have borderline personality disorder | 2.4% | 17,595 | 17,829 | |
| Have a common mental disorder | 18.9% | 138,558 | 140,403 | |
| Have an antisocial personality disorder | 3.3% | 24,193 | 24,515 | |
| Have a psychotic disorder | 0.7% | 5,132 | 5,200 |
Table 1. Number of people 16-64 years in Surrey predicted to have mental disorder Source: OHID Fingertips
Index of Multiple Deprivation (IMD) – Mood and Anxiety Disorders Indicator
Common mental ill health is defined as suffering from mood (affective), neurotic, stress-related and somatoform disorders. The prevalence of these are based on prescribing, suicides and hospital admissions data.
The IMD Mood and Anxiety Disorders indicator is used widely to analyse patterns of common mental ill health by Lower Super Output Area (LSOA). These are areas of roughly 1,500 residents. A score of zero represents the average prevalence across all LSOAs in England. A score above zero indicates that a higher prevalence of mental health problems is evident in an area than expected, given the age and gender distribution. A higher score for the indicator represents a higher level of mood and anxiety deprivation.
In 2019, indicator values in England ranged from 3.095 to -3.045. In Surrey, values ranged from 1.203 to -1.915. Overall common mental health needs in Surrey are relatively lower than across England as a whole. The data visualisation shows the level of deprivation across LSOAs within Surrey, as measured by the IMD Mood and Anxiety Disorders indicator (2019). The five LSOAs with the highest levels of mental health needs are in Reigate and Banstead. In descending order, they are.
Reigate and Banstead 008A – Hooley, Mersham & Netherne
Reigate and Banstead 016E – Horley West & Sidlow
Reigate and Banstead 015E – South Park & Woodhatch
Reigate and Banstead 005A – Tattenham Corner & Preston
Reigate and Banstead 008B – Hooley, Mersham & Netherne
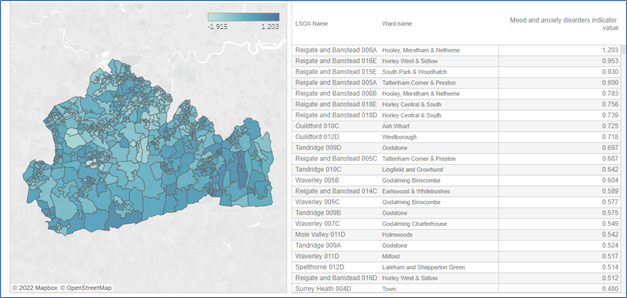
Figure 2. Mood and Anxiety Disorders by Lower Super Output Areas in Surrey 2022 Source: OHID Fingertips
Three of the LSOAs with the highest mood and anxiety disorder indicator scores lie within wards identified as being Key Neighbourhoods. Reigate and Banstead 008A and Reigate and Banstead 008B both lie within Hooley, Merstham & Netherne, Reigate and Banstead 008B lies within Tattenham Corner & Preston.
Self-Reported Wellbeing
The Office for Health Improvement and Disparities (OHID) has developed three key indicators for self-reported wellbeing, including life satisfaction, happiness and anxiety. Self-reported wellbeing in Surrey was comparable to regional and national wellbeing 2020/21. Of Surrey residents, 5.3% reported a low life satisfaction score (6.1% Nationally), and 6.8% reported a low happiness score comparative to 9.2% nationally. Scores for high self-reported anxiety were observed in more of the population than the other wellbeing measures, 22.5%, slightly lower than that reported regionally 23.6% and nationally 24.2%.
Engagement is underway with priority places (as identified by the Health and Wellbeing Board) to measure wider health and wellbeing indicators. Findings will be published here as they become available, in early 2023.
QOF: Depression
Primary care Quality and Outcome Framework (QOF) data report the prevalence of depression, psychoses and dementia diagnosed in people registered with GPs. While covering most of the UK population, QOF data may not fully represent all groups and relies on accurate disease registers and diagnosis of mental health problems. We know through feedback from service users, that not everyone with common and/or severe mental illness is on their local QOF register. As a result, prevalence of health conditions represented by QOF data should be viewed with caution as a higher prevalence does not necessarily mean that the condition is genuinely more prevalent within that area but rather that the GP practices may be better at recording it.
Prevalence of depression recorded in the QOF register has risen rapidly over the past five years as can be seen in the Table 2 below. From 2014/15 to 2020/21 the prevalence of depression across England, the South East and Surrey has risen dramatically. Across England the prevalence has risen from 7.3% to 12.3%, an increase of 5.0%, Across the South East the prevalence has risen from 7.3% to 13.0%, an increase of 5.7%, and across Surrey the prevalence has risen from 6.2% to 11.1%, a rise of 4.9%.
| Area | 2014/15 | 2015/16 | 2016/17 | 2017/18 | 2018/19 | 2019/20 | 2020/21 |
| England | 7.3% | 8.3% | 9.1% | 9.9% | 10.7% | 11.6% | 12.3% |
| South East | 7.3% | 8.4% | 9.3% | 10.1% | 11.0% | 12.0% | 13.0% |
| Surrey | 6.2% | 7.2% | 8.3% | 8.9% | 9.7% | 10.4% | 11.1% |
Table 2. QOF registered Depression 2014/15 – 2020/21
The data visualisation shows that Surrey has a significantly lower prevalence of depression among adults aged 18+ than England (11.1% vs 12.3%) (2020/21). JSNA Mental Health Published Dashboard
Across Surrey local authorities in 2020/21, the prevalence of recorded depression ranges from the lowest value in Elmbridge of 9.8% to the highest in Waverley with 12.7%.
Long Term Mental Illness
Long term or chronic mental illness generally refers to mental ill health lasting greater than 12 months or with persistent life function limiting symptoms. Persons suffering from long term mental illness may find it hard to perform everyday tasks such as forming relationships, attending work, or completing household tasks. Different mental illnesses have different long-term effects. A Danish study found that the mental health condition that had the greatest Years Lived with Disability (YLD) was schizophrenia, followed by personality disorders for both males and females. The illnesses causing the third highest number of YLDs were anxiety disorders for females and Alcohol Use Disorder (AUD) for males.
In the 2022 GP Patient Survey (GPPS), of those respondents registered with a GP in NHS Surrey Heartlands Integrated Care System, 9.1% reported having a long-term mental health condition. This is the lowest value in all ICSs across the South East commissioning region, and less than the England reported value of 12.3%.
QOF: Severe Mental Illness
SMI refers to mental health problems so significant, they impact a person’s functional ability as well as their ability to work, attend education or in other ways achieve their potential. The SMI register includes patients with a diagnosis of schizophrenia, bipolar affective disorder and other psychoses, and other people on lithium therapy. SMIs are further problematic because they are often associated with physical health problems (co-morbid) or co-exist with other mental or physical long-term problems or conditions (multimorbid). There are several NICE guidelines covering a range of conditions such as psychosis and schizophrenia, bipolar disorder, severe depression, personality disorder or eating disorders. More detail on people in Surrey living with an SMI can be found in the JSNA Chapter on the Surrey Context.
Proportion of count of comorbidities for SMI cohort and the comorbidity proportion.
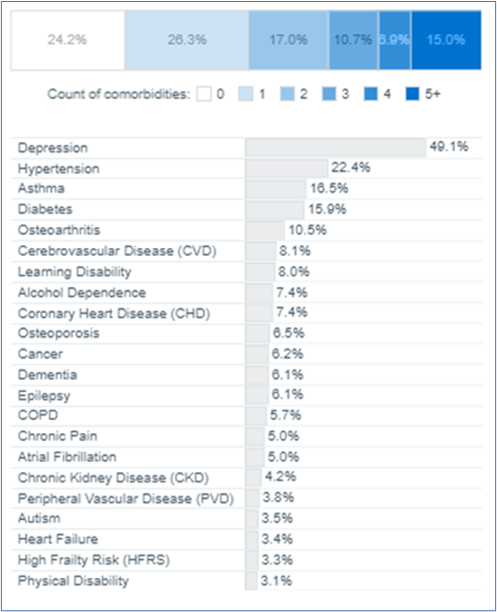
Figure 3. Source: Population and Person Insights Dashboard, NHS England
Total SMI Population by Age Band (% per Age Band in Place)
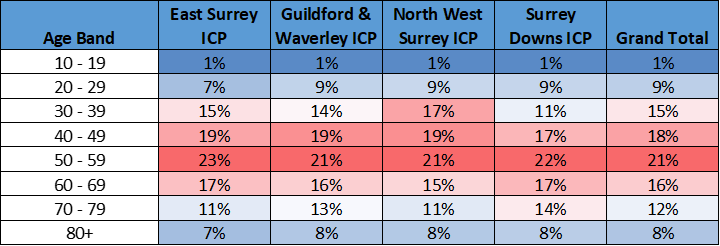
Table 3. Source: Surrey Heartlands NHS, Graphnet
In the last recorded data available (2020/21) Nationally by ICS area, Surrey Heartlands had significantly lower (the lowest) recorded (QOF schizophrenia, bipolar disorder, and other psychoses) Serious Mental Illness (all age). In 2020/21 0.87% (compared to 0.95% nationally) of people were on the SMI register for Surrey Heartlands ICB. This equals to approximately 8,417 individuals. A lower than national SMI prevalence was also observed in Frimley with 6,094 individuals registered 0.76% compared with 0.96% nationally. Across NHS Surrey Heartlands ICS there is a high level of variance in the prevalence of the above disorders at a Primary Care Network (PCN) level. In 2020/21 the PCN with the highest prevalence was Dorking PCN (0.94%), the PCN with the lowest prevalence was Woking Wise 1 PCN (0.58%). In 2019/20 Dorking PCN had the highest prevalence (0.94%) and Weybridge & Hersham PCN had the lowest (0.58%). However, the prevalence of SMI was 28% higher in the most deprived decile compared to the least deprived decile.
A report commissioned by Public Health England (PHE) found that people with an SMI die significantly younger than people without an SMI, and this is partly attributed to the co-occurrence of other long-term conditions. In Surrey (2019/20), these rates are significantly worse than England. The under 75 excess death rate in adults with an SMI is 523.7%. Similarly, there are worse rates in Surrey (compared to England) for under 75 excess death rates attributable to CVD (410%), cancer (143%), liver disease (677%) and respiratory disease (998%).
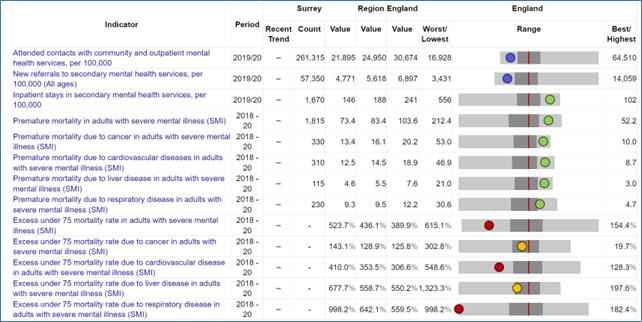
Figure 4. Serious Mental Illness in Surrey, South East and England Source: OHID Fingertips
In Surrey, (2019/20) there were 21,895 per 100,000 contacts with community and outpatient mental health services (compared to 30,674 per 100,000 in England). The rate of new referrals to secondary mental health services was 4,771 per 100,000 (compared to 6,897 per 100,000 in England). Some challenges found through engagement workshops by where there are no ways for people to be taken off the SMI register; and diagnoses given in secondary care are sometimes vague or given as suspected, which can cause confusion with admin teams leading to people being missed off the register.
In 2022 an independent review of SMI and Health Inequalities in Surrey was commissioned by Surrey Heartlands ICS.
In December 2022 SMI Physical Health Checks[1] (PHC) data shows that in Surrey Heartlands ICS 50% of people on the SMI register received their PHC in the last 12 months (NHSE PHC SMI 2022). As the national target is 60%, it key to understand what gaps there are in meeting this.
National findings suggest that there is a link between PHC uptake and deprivation (PHE SMI 2018). There is ongoing work both nationally and in Surrey to understand the physical and engagement barriers to PHC uptake. A previous piece of work done carrying out lived experience engagements in the region focussed on understanding engagement with PHCs. There were 5 main barriers identified:
- Perceived lack of quality follow-up support.
- Unaware of need for physical health check.
- Belief that a PHC would negatively impact mental health.
- Unable to arrange PHC appointment.
- Belief that a PHC would not positively impact physical health.
Total SMI Population by Deprivation Band (% per Deprivation Band in Place)
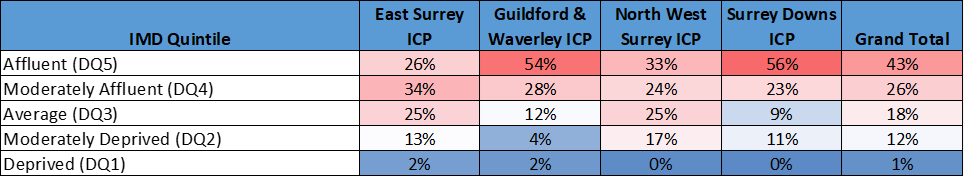
Table 4. Source: Surrey Heartlands NHS, Graphnet
The report found a significant relationship between the distance to the nearest GP practice and PHC uptake. As can be seen from Figure 5, below, there is a negative relationship between the distance to the nearest GP and PHC uptake (correlation coefficient = -0.18). Regression analysis found that for every increase of 1 km in the average distance a patient lived to their GP practice, the percentage receiving a full PHC decreased by 2%. This is equivalent a decrease in 2 patients per GP practice. This means is that as distance to GP practice increase, the PHC uptake decreases
Distance to Nearest GP and PHC Uptake
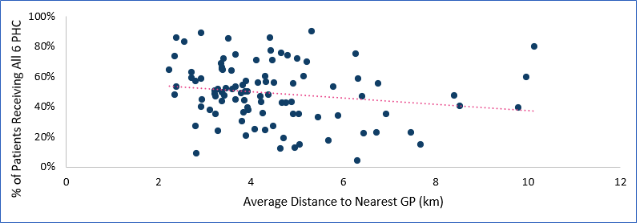
Figure 5. Scatter graph of distance to nearest GP practice (Access to Healthy Assets and Hazards (AHAH[2])) and PHC uptake in Surrey, for GPs in Surrey.
There is national research to suggest that deprivation has a negative impact on mental health and SMI. In Surrey this is also the case. The effect of deprivation on SMI prevalence, as measured by the register size can clearly be seen. A decile comparison between areas scoring in the top 10% of deprivation IMD scores, when compared against areas in the bottom 10% of IMD scores shown a substantial difference.
This finding was further supported through engagements with service providers and lived.
A summary of the key findings of the report is copied below.
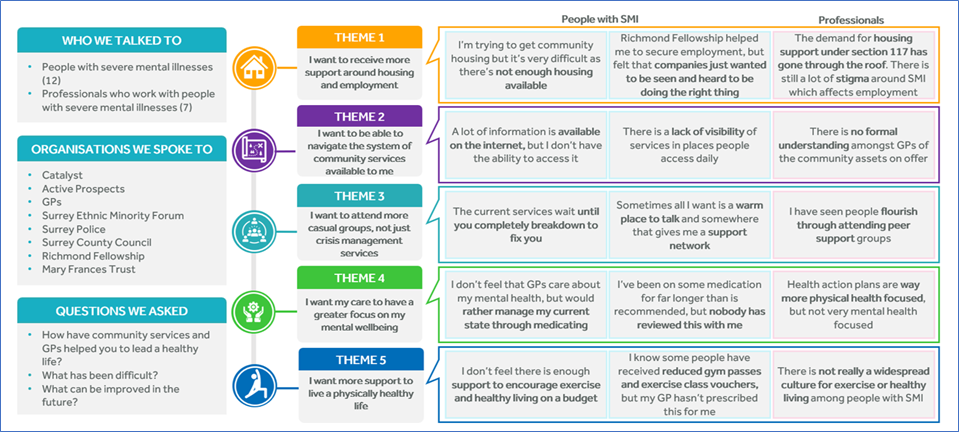
Figure 6. Engagement findings summary
Suicide and Injury Undetermined
There has been a slight increase in the directly age-standardised suicide rate across both England and Surrey, comparing the three-year average in 2008/10 with 2018/20. The rate in Surrey grew from 9.6 to 10.0 per 100,000 and in England it grew from 9.4 to 10.4 per 100,000. For the period 2008/10 the rate was higher in Surrey than England. However, since 2009/11 the directly age standardised rate across Surrey has been below England’s (15). Given the low comparative prevalence of common mental disorders in Surrey it is surprising that suicide rate is only marginally lower than that observed nationally. This may be explained by historic data availability on CMD in Surrey and may indicate a change in prevalence. This requires further exploration.
The latest three-year average data (age standardised rate per 100 000) shows that:
- Surrey has the sixth lowest rate of suicide among its 15 Combined Intelligence for Population Health Action (CIPFA) nearest neighbours (CIPHA range: 8.4 – 14.3) (2018-20).
- The rate of suicide across Surrey was roughly 3 times higher in males than females (15.2 vs 5.1) (2018-20). Nationally there has been a reported increase in female suicides.
- The rate of suicide varied across Surrey local authorities with Epsom and Ewell having the highest rate of 14.0 per 100,000 and Spelthorne having the lowest rate 7.6 per 100,000 (2018-20).
Some key statistics relating to suicide within Surrey can be found below:
- The number of suicides in Surrey between 2018-20 was 312, an average of 104 per year and over 8 per month (2018/20).
- 74% of suicides were amongst Males (231) and 26% among Females (81) (2018-20).
Each suicide has far reaching consequences, affecting a number of people directly and many others indirectly, and with those affected often impacted economically, psychologically and spiritually. Family, friends, and carers of those who die by suicide have a 1 in 10 risk of making a suicide attempt after experiencing loss.
Suicide is often the end point of a complex history of risk factors and distressing events. The prevention of suicide strategies have to address this complexity. As there is no single risk factor for suicide, the prevention of suicide does not sit with any single organisation.
Suicide rate – Surrey and England
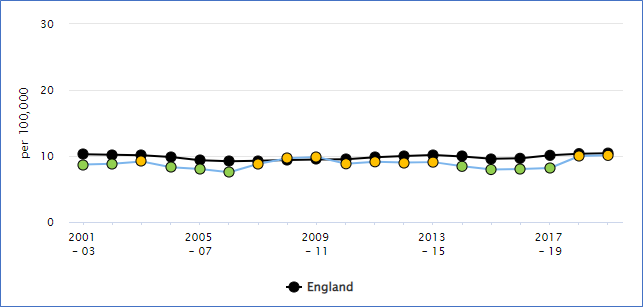
Figure 7. Suicide rate (Persons) Directly standardised rate – per 100,000 Source: OHID Fingertips
Suicide rate – Surrey, South East and England
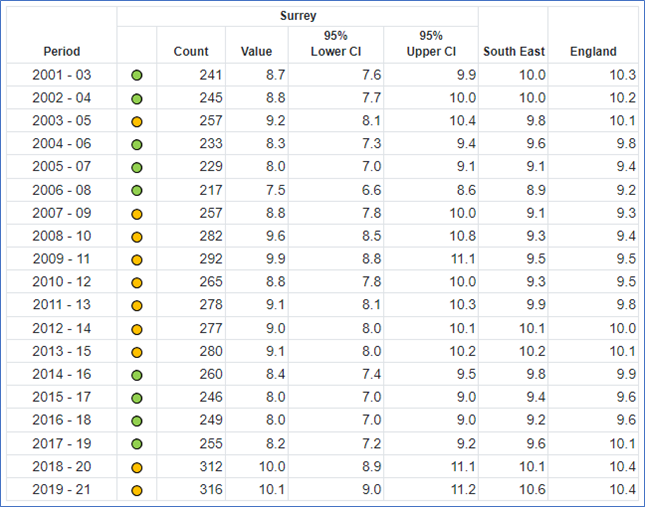
Table 5. Suicide rate (Persons) Directly standardised rate – per 100,000 Source: OHID Fingertips
Over the last 20 years the suicide rate in Surrey has been between 8- 10 per 100,000 of population. During the 2008-2010 financial recession the suicide rate in Surrey increased and this was a pattern also seen in England. Recession increases the risk factors for poor mental health. Therefore, if England again enters a recession, it is expected that the suicide rate in Surrey would increase.
Suicide rate – England, Surrey, District & Boroughs
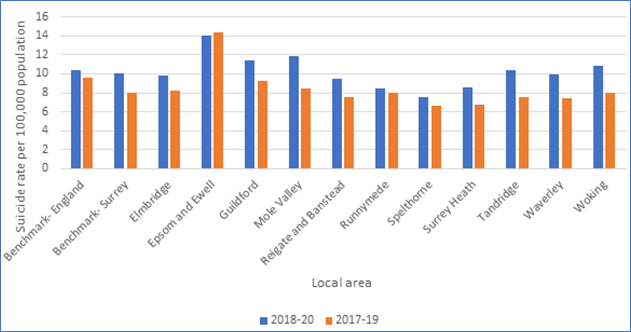
Figure 8. Comparison Suicide rate, all persons in Surrey 2017- 2020
In 2021 an audit of the Surrey Coroner’s Records of Deaths identified as Suicides was completed for death in 2017- 2020. This covered four calendar years and cases that had a completed inquest. Between 2017 and 2021 there were 258 deaths by suicide in Surrey. In 2021 Surrey Public Health Team commissioned a suicide audit. Coroners’ files were reviewed to understand the key contributing risks to suicide, access to services and opportunities for suicide prevention.
In Surrey, a quarter (28%) of people visited a GP in the three months prior to death. The reasons for the visit varied between a mental health issue, a physical issue, both issues and/or just a routine appointment. 71% of people who died by suicide in Surrey identified as White British. The mean age at death was 53 for males and 41 for females (48.2 overall), with the highest number of deaths, one third, in the 45-59 years age bracket.
36% of people who died lived alone, and 36% were not in a long-term relationship of any sort. Approximately a quarter (27%) of Surrey residents live alone according to the 2011 census.
Nationally it is estimated that around one third of those who die by suicide in England have been in contact with mental health services in the 12 months leading up to their death, a further third have seen their GP but are not receiving specialist mental health support (Department of Health, 2017). In Surrey a quarter of individuals who died by suicide were in contact with a mental health service at the time of their death.
By far the most common mental health condition that individuals had who died by suicide was depression. Over half had either a clinical diagnosis of depression or had documented in their clinical notes that episodic periods had occurred over their lifetime. A third had an anxiety condition.
The National Confidential Inquiry into Suicide and Safety in Mental Health, Social and Clinical Characteristics of Mental Health Patients Dying by Suicide in the UK shows the main social features of patients dying by suicide in the UK. There were high rates of social adversity and isolation. 53% of patients had a comorbid diagnosis. 64% of patients had a history of self-harm. 47% of patients had a history of alcohol use and 27% had drug use
Self-harm (including attempted suicide) is the single biggest indicator of suicide risk and approximately 50 per cent of people who have died by suicide have a history of self-harm (Department of Health, 2017).
Although the circumstances of every death are unique, through the audit we can begin to see factors in common across the cases, the key contributing factors mentioned in the notes were:
- 50% – Mental illness
- 32% – Relationship problems
- 19% – Bereavement
People born in the 1960s and 1970s are known as Generation X. Now in their 40s and 50s they are dying in greater numbers by suicide or drug poisoning than any other age group. Research shows that Generation X show poorer physical health, increased rates of depression and anxiety, and higher levels of unhealthy behaviours, such as alcohol use and smoking, compared to previous generation.
Compared with people who have been bereaved through other causes, individuals who are coping with a loss from suicide are more likely to experience increased risk of psychiatric admission, depression, and grief beyond 6-12 months of bereavement which severely disrupts the person’s ability to carry out normal activities such as work, relationships, and social functioning. Estimates vary on how many people are affected by each suicide – ranging from six to 60 people. A conservative estimate of 10 people directly affected by each of these deaths suggests almost 50,000 people annually in England could benefit from support after suicide. In Surrey around 920 people could benefit from support in one year, although it is unlikely that all people bereaved by suicide would come forward for support. Some may feel that they do not need support, others may feel concerned about the stigma of suicide.
Eating Disorders
The Health Survey for England 2019 Eating Disorders report found that adults who screened positive for a potential eating disorder were more likely than others to have consulted their GP for a mental health, nervous or emotional problem (24%, compared with 10%). They were also more likely to have received counselling or therapy (16%, compared with 7%).
Why are eating disorders important?
Approximately 1.25 million people in the UK have an eating disorder. It is estimated that between 10% and 25% of those with an eating disorder are men. Most eating disorders develop during the late teens to the mid-twenties. However, it is not uncommon for eating disorders to affect people of all ages.
Having an eating disorder is linked to long term health implications including obesity, poor functioning of the body, infertility, stunted growth, brittle bones, damage to internal organs and low levels of essential vitamins. Having an eating disorder can also manifest psychologically including sleep problems, difficulty concentrating, feeling down, loss of interest in others and obsessive behaviours. It is common that eating disorders can occur alongside mental health conditions such as depression, personality disorders and substance abuse. Often an eating disorder is one of several conditions that is having a significant impact upon individuals and their quality of life.
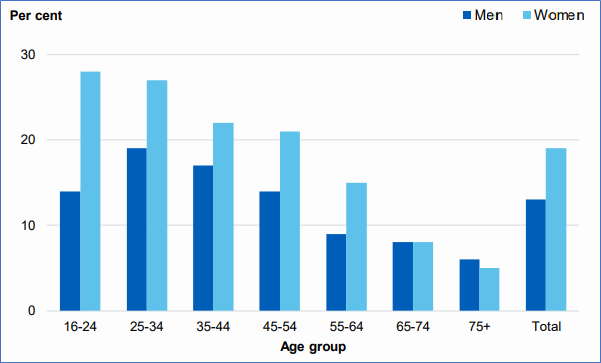
Figure 9: Screened positive for possible eating disorder in past year, by age and sex. Men Women Source: Health Survey for England 2019 Eating Disorders, NHS Digital Source: NHS Digital Base: Aged 16 and over
5. Prevention and Protection of Emotional and Mental Wellbeing
It is known that those living in areas of deprivation and or impacted by socio-economic and environmental inequalities are at greater risk of poor mental health. There is a complex interplay between socio-economic and environmental inequalities, those living in deprivation and their mental health status, each being a possible cause or consequence. Often these same groups of people have less access to effective and relevant support for their mental health, and if they do get support, their experience and outcomes are often poorer. A lack of access to resources such as adequate housing and exposure to negative stressors such as violence, crime or lack of public green space are significant contributors.
Pattern of risks affecting health and wellbeing
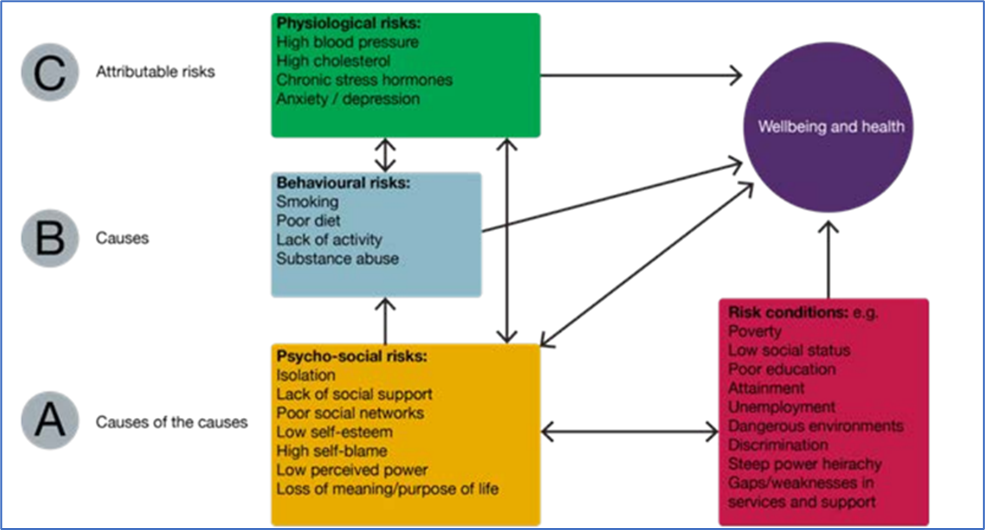
Figure 10. Source: PHE, Reducing health inequalities: system, scale and sustainability
Risk and protective factors at individual and community level are illustrated below.
Common risk and protective factors for mental wellbeing at individual and family/community level
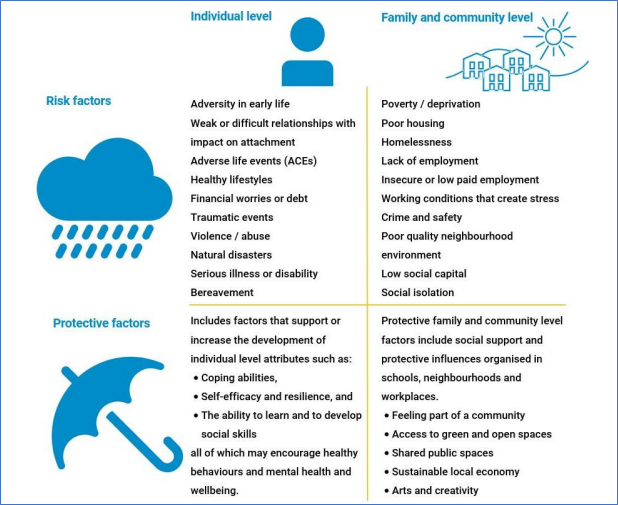
Figure 11. Source: OHID, Disparities Mental health JSNA toolkit, prototype Mental, Health tool and The Mental Health Wellbeing Impact Assessment Toolkit
The Dahlgren and Whitehead Model provides a useful framework to consider these risk factors and conditions and will be applied to the structure of this chapter.
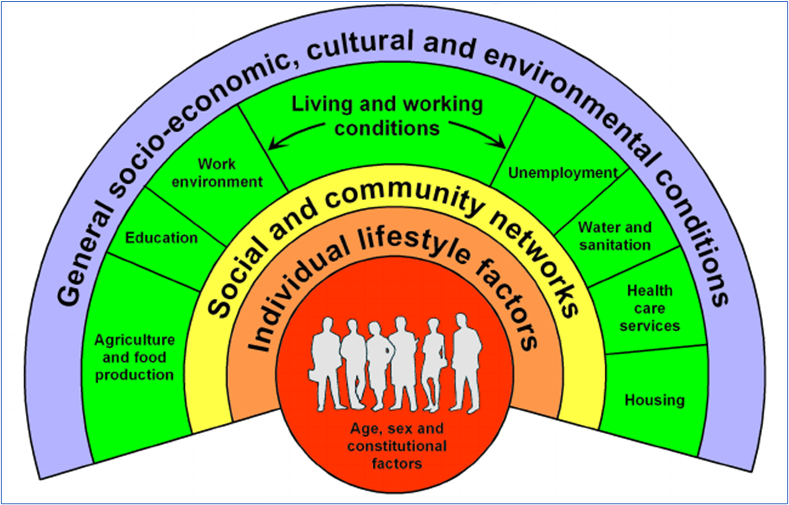
Figure 12. Dahlgren & Whitehead Model of the Health Determinants
Socio-economic, Cultural and Environmental conditions: The Current Context
Cost of Living Crisis
Recently, there has been an increase in the rates of people experiencing food insecurity, this is now estimated at 4.7 million across the UK (Kings Fund 2022). Other wider factors such as increase in energy prices, combined with rising inflation, stagnant wages and uncertainty about benefits further lead to an increase in people living with food insecurity or fuel poverty. These factors combined with the uncertainty can cause considerable anxiety. People already experiencing poor mental health (for example those living with an SMI) or living with a disability are more likely to be affected. In addition, the uncertainty of the benefits system, and the negative emotions such as stigma associated with accessing food banks further lead to poor mental health. Fuel poverty has been found to correlate with a variety of well-being outcomes, even when controlling for lifestyle factors. Two thirds of therapists in a national survey say cost of living concerns are causing a decline in people’s mental health. British Medical Journal research says that the surge in prices over recent months is exacerbating insecurity and harming people’s mental health
Another issue related to financial uncertainty is debt; debt is significantly linked to poor mental health. Those with problem debt are three times more likely to consider suicide. Around 60% of those who had 3 or more debts experienced mental health problems. Research has found that multidisciplinary interventions are successful if they aimed at improving social circumstances for individuals with mental health problems (including employment, education, and social isolation).
The Health and Wellbeing Board has identified 21 priority areas across Surrey where substantial opportunities for population-wide health and wellbeing improvements exist. We know poverty and its associated effects are a key health and wellbeing risk factor, so the importance of understanding these communities has only become more acute as a result of the rising cost of living.
There are already a lot of health and wellbeing interventions active in these communities. Surrey County Council will be undertaking mixed methods research in early 2023 to better understand health and wellbeing issues in these communities as well as understand what assets they define as valuable. This will help us develop a measure for healthy and thriving neighbourhoods to help us focus our resources on what will have the most impact.
The specific aims of the project are:
- To measure how those living in priority areas in Surrey feel about their neighbourhoods, using ‘meaningful’, predefined metrics co-designed with residents and other stakeholders.
- To understand what it is like to live in five of the priority areas in Surrey, and how the cost-of-living crisis is impacting this.
- To understand whether the needs and ambitions of the neighbourhoods are being met by the current programmes of work, including emergency interventions that have been implemented.
As findings become available, they will be published here.
COVID-19
The first case of Coronavirus Disease – 19 (COVID-19) recorded in the United Kingdom (UK) was on January 29th 2020. On March 23rd 2020 the Prime Minister announced the first nationwide lockdown ordering people to ‘stay at home’. During 2021-21, the UK would enter numerous nationwide lockdowns along with several more localised lockdowns. The lockdowns imposed bans on nearly all social gatherings, encouraged people to work from home and to practice social distancing whenever possible. The nature of the laws enacted meant that the population’s lives were impacted on a multitude of levels of which many related to a person’s mental wellbeing.
Throughout the pandemic there was greatly increased pressure on the NHS which led to many routine operations being either delayed or cancelled. There was also a move towards digital and socially distanced appointments. All of this had knock-on effects of the levels of and access to care received by patients across the UK.
Several studies into the effects of COVID-19 on mental health have been carried out, three of which have been used to guide this report. Overviews of each study are in Table 6 below.
| Study | Summary |
| Mind, a UK-based mental health charity, carried out two surveys of nearly 12,000 UK residents at both the start and one year into the COVID-19 pandemic. | The survey sought to understand how the lockdowns and changes associated with COVID-19 had affected people’s mental health |
| ‘Mental health before and during the COVID-19 pandemic in two longitudinal UK population cohorts’ (6). Two cohorts were reviewed in this paper, one comprising of Scottish residents and the other, the Avon Longitudinal Study of Parents and Children (ALSPAC), focused on parents and their children (13-24 year olds) residing in Avon, South West England. | Avon was a previous unitary authority that split into four further local authorities, one of which, Gloucestershire is a Chartered Institute of Public Finance and Accountancy CIPFA nearest neighbour to Surrey. Results from the ALSPAC study are quoted due to the greater similarity with Surrey. |
| GOV COVID-19 mental health and wellbeing surveillance: report | Throughout the pandemic, the UK Government published the ‘COVID-19 mental health and wellbeing surveillance report’, a high-level summary of the COVID-19 pandemic’s impact on the mental health and wellbeing of the population in England. It compiles routinely updated indicators from multiple sources and summarises important recent findings from a pre-defined set of studies. It broadly covers three key areas: ‘Important findings’, ‘Measure of anxiety, depression, loneliness and life satisfaction’ and ‘Children and young people’ |
| COVID-19 Impact on Mental Health Service Users Surrey: Rapid Needs Assessment | Qualitative insights into service users in Surrey’s experience of the pandemic and impact on mental health. |
Table 6. Studies into the effects of COVID-19 on mental health
The findings in Table 7 below, highlight a population level decrease in overall wellbeing especially in geographies of greatest need.
| Key Themes | Summary |
| Over the course of the pandemic mental health burden varied. | From April 2019 to April 2020 the proportion of adults over 18 reporting clinically significant levels of psychological distress increased from 20.8% to 29.5%. This number had fallen to 21.3% by September 2020, by January 2021 it was back at 27.1% and by March 2021 it fell again 24.5%. |
| People who already struggled with mental health issues before the pandemic experienced the greatest impact on mental health. | This could be a particular issue for areas of Surrey with higher prevalence of Schizophrenia, Bipolar disorder, and other Psychoses; as observed in Dorking PCN, which had the highest QOF registered incidence in FY 2019/20. |
| COVID-19 has heightened inequality | COVID-19 has heightened inequalities in mental health such as the association of higher levels of deprivation with increased mental health burden. This could lead to negative outcomes for persons living in the key neighbourhoods outlined in the Surrey Health and Wellbeing strategy 2022. |
| Young people (13-24) are finding it hard to cope | Young people who are struggling with their mental health are more likely to use unhealthy coping strategies such as self-harm than adults. This could be a particular problem in Guildford, which has the highest population of 13–24 year-olds across Surrey District & Boroughs. |
| Cohorts/sub-populations | Aside from the overall trends in mental health mentioned above, the three studies highlighted several key populations that suffered to different extents during the pandemic. The below text aims to highlight these inequalities. |
| Gender | It was found that females were more likely to experience depression or anxiety during the COVID pandemic than males. A possible reason is that women are more like to have family and caring responsibilities, which required large adjustments over the course of the pandemic, particularly to manage housework and childcare during lockdowns. Woldingham in Tandridge has the highest proportion of females in Surrey and is the only ward where this proportion is over 55%. |
| Age | Age is a complicated factor with respect to its impact on mental health during the pandemic with several studies reporting different conclusions, some of which are summarised below. The prevalence of probable depression during the pandemic was highest for younger individuals (18-40 year-olds) and decreased with older age. Young adults (18-30 year olds) with a pre-existing risk of experiencing loneliness are now at even greater risk of experiencing loneliness. Being a university student had a potential link to increased risk of loneliness. This could be a particular issue within the Guildford Borough which has the highest proportion of young adults across Surrey and is home to three universities. Amongst older adults, being asked to shield was associated with increased levels of depression, anxiety and loneliness. |
| Ethnicity | Linking ethnicity with mental health outcomes directly during the pandemic has proved difficult. Associations between ethnicity and mental health are influenced by many variables such as employment and income protection, community, gender and deprivation which may have greater influence. Most studies conducted so far do not have enough representation of minority groups to produce any meaningful insight. |
| Employment and Income | The three studies reviewed found that a person’s employment and income are strong predictors of someone’s mental health outcomes during the pandemic. Unemployment and lower household income have been linked to higher levels of psychological distress, anxiety, depression and loneliness, and lower levels of happiness and life satisfaction during the pandemic. Runnymede and Woking districts and boroughs have the lowest levels of employment in Surrey amongst 16-64 year olds (74.7% & 74.9% respectively), therefore problems with mental health may be more pronounced in these areas. |
| Urbanisation | There has been conflicting research on the how living in an urban versus rural location effected mental health during the pandemic. One study reported adults living in urban areas reported worse and increasing loneliness. However, another found no evidence of a difference in depression and anxiety between rural and urban areas. Out of the eleven District & Boroughs in Surrey, only Mole Valley and Tandridge are classified as ‘urban with significant rural’ and Waverley as ‘Largely rural’, while the rest are classified as either ‘Urban with major conurbation’ or ‘Urban with city and town’. The differing levels of urbanisation across the county could have had an impact on the prevalence of mental health problems during the pandemic. Another study found that ‘Between April and June 2020 levels of hedonic (feeling good) and evaluative (life satisfaction) wellbeing decreased. However, for those living in more deprived neighbourhoods the level of hedonic wellbeing decreased more than for those living in more affluent areas.’ The effect that local area deprivation has on mental health would have been a particular issue for the 21 key neighbourhoods outlined in the Surrey HWB Strategy. |
| Long Term Conditions | It was found that ‘during the pandemic, adults with long term physical health conditions reported worse levels of depressive symptoms than adults without long term physical health conditions.’ Summaries of specific research findings are below. Having asthma increased the likelihood the person would suffer with anxiety or depression during the pandemic. There was an increased risk of depression in adults that suffer with breast, prostate, or blood cancer but not other types of cancer. Having a long-term physical health condition was associated with worse levels of depressive symptoms. |
| Referrals to Improving Access to Psychological Therapies (IAPT) | For the first time in 2020/21 both the number of referrals and referrals starting treatment fell for IAPT, this could either be due to fewer patient presenting at their GP or fewer referrals being made following appointments. During this year, the system failed to meet its target of delivering timely access to at least 15% of the community prevalence of depression and anxiety disorders. This creates pressure for more referrals and appoints to be delivered if the target it to be met over the coming years. The number of referrals to the IAPT programme across England fell from 133,191 in April 2019 to just 57,814 in April 2020, the number of referrals to secondary mental health, learning disabilities and autism services fell from 303,373 in April 2019 to 208,829. This drop was short lived, by July 2020 the referrals to IAPT where at 128,988 and referrals to secondary mental health, learning disabilities and autism services where at 339,522. |
Table 7. Decrease in overall wellbeing
Climate Change
The Independent Assessment of UK Climate Risk (2021) and the government’s UK Climate Change Risk Assessment (2022) shows that the UK faces risks from climate change to its natural environment, food, water supplies, infrastructure and the health and wellbeing of its population. The Adaptation Sub-Committee of the Committee on Climate Change (2017) commissioned regional assessments of climate change risk. Risks were identified for the South East of England region until 2050 including risks of impacts on residents’ wellbeing from disruption to health, social care and emergency management services and school provision, from flooding, heatwaves and storms and excess deaths and illness from overheating.
Surrey’s Climate Change Strategy (2020) recognises that Surrey faces an increased frequency and severity of adverse weather events, notably flooding and heatwaves. These severe weather events have the potential to have a significant impact on local services and infrastructure such as highways, and to the health and wellbeing of residents, particularly those in vulnerable groups.
Data lacks to show how Surrey residents’ emotional and mental wellbeing is impacted by the experienced climate. Existing population vulnerabilities may be exacerbated by climate hazards and long-term climate risks, resulting in increased inequities. The effects of climate change have considerable implications for mental health, wellbeing and required service provision.
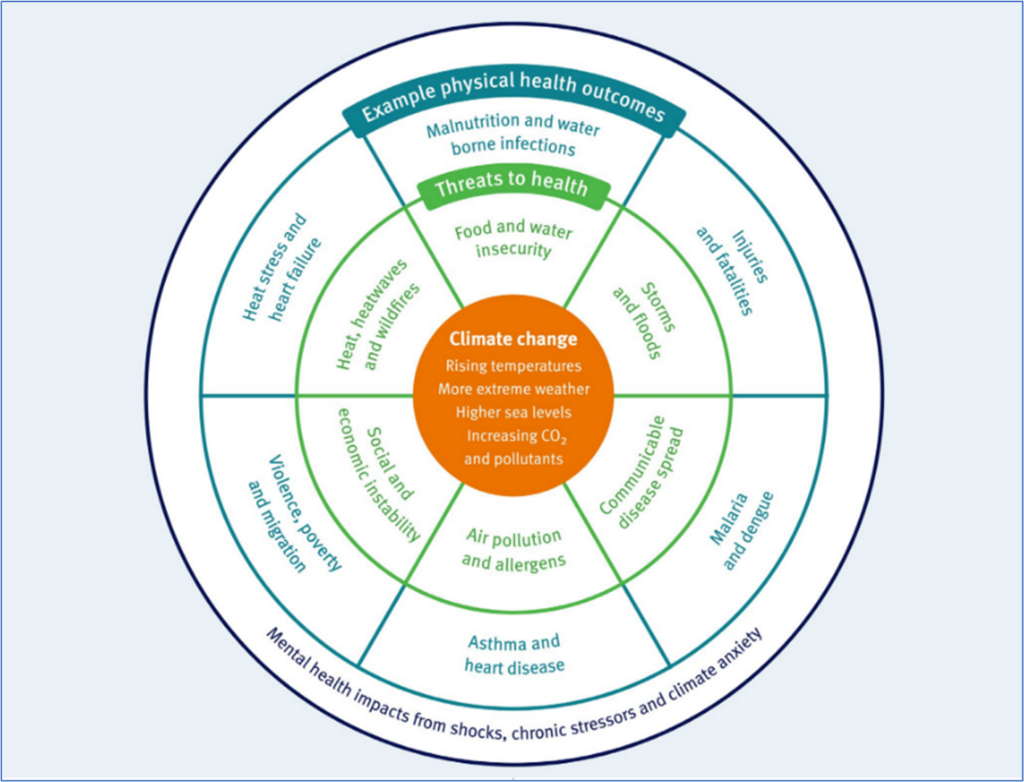
Figure 13. The health threats resulting from current and anticipated climate change impacts Source: Imperial College London, Grantham Institute briefing paper no. 36 (May 2021)
Social Media
Social media presents a modern challenge to enhanced mental and emotional wellbeing. Social media on one hand enables instantaneous connectivity with friends and families anywhere in the world. On the other, social media, driven by algorithms for continuous benchmarking success on comparison to others which is known to cause anxiety and have a negative impact on mental health. The negative impact of social media has been observed primarily in Children and young People and will be explored thoroughly in the JSNA Children and Young People emotional wellbeing chapter.
Who accesses social networking websites and apps?
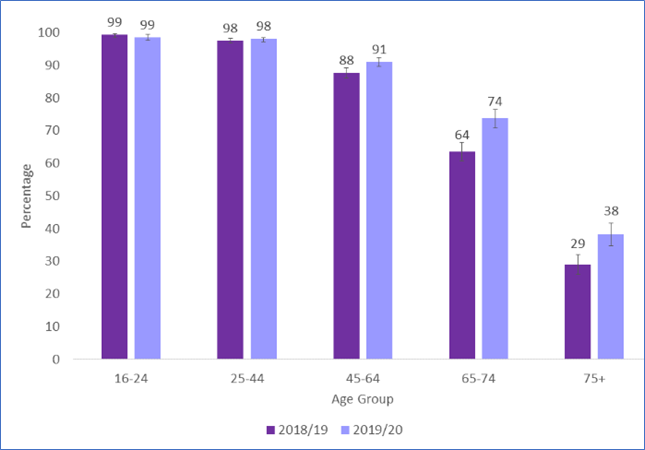
Figure 14. Reported frequency of using social networking websites or apps by age, 2018/19 – 2019/20 Source: National Statistics, Social Networking – Taking Part Survey 2019/20 dated 16 Sep 2020
In the Social Networking – Taking Part Survey 2019/20, 80% of adults reported using social media every day, whilst just 2 percent said that they used it less than once a month. The use of social media is highest in the 16 to 44 age band at 99% dropping to 38% for 65+. There are only small insignificant differences of use between genders and those in different Indexes of multiple deprivation.
The rapid growth and use of social media has had both negative and positive impacts on mental health. There have been some suicides in England where the use of social media has been identified as a contributing risk factor. The Online Safety Bill is proposed legislation in the UK Parliament intended to improve internet safety. The Bill would create a new duty of care for online platforms towards their users, requiring them to act against both illegal and legal but harmful content. At the time of writing this report the Online Safety Bill was at the House of Commons stage and was yet to pass through the House of Lords.
Deprivation
More detail is available in the Surrey Context: IMD and Healthy Life expectancy at birth.
The Indices of Multiple Deprivation are a unique measure of relative deprivation at a small local area level (Lower-layer Super Output Areas). The Surrey place tableau dashboard shows that the majority (68.5%) of Lower Super Output Areas (LSOA) in Surrey are in in the least deprived deciles 8, 9 and 10. There are no Surrey LSOAs in decile 1 of the overall Index of Multiple Deprivation, and just 4 (0.6% of areas) in decile 2. These are parts of Westborough and Stoke wards (in Guildford), Hooley, Merstham and Netherne ward (Reigate & Banstead) and Canalside ward (Woking). Surrey has a population of contrast with large populations representing the most affluent deciles. Populations with large differences in wealth and resource between individuals are associated with higher levels of poor health and mental health problems.
Air Quality
More detail is available in Surrey Context and Air Quality chapters.
In Surrey the fraction of mortality attributable to particulate air pollution (new method) was 6.2% in 2020, which is higher than the South East at 6.0% and England’s average at 5.6%. Data does not show the attributing factors for the mortality rates and there is a close link between poor physical and poor mental health. Despite the complex link between cause and consequence for physical and mental health, evidence suggests that air quality can adversely affect the brain and increase risk for psychiatric disorders such as schizophrenia and depression and increase the use of antidepressants and benzodiazepines. One study in South London and Maudsley NHS Foundation Trust shows that continual exposure to air pollution (assuming causality) has also been associated with increased mental health service use amongst those recently diagnosed with psychotic and mood disorders. Air pollution can also contribute to a decline in mental ability and vascular dementia in older people.
Local data exploring this link is not available, therefore, exploration of the link between air quality and the impacts of this on Surrey’s residents’ mental health is now required.
Living and Working Conditions
Housing
The importance of safe and settled accommodation is well documented as a determinant of good mental health and wellbeing. Public Health England’s Joint Strategic Needs Assessment (2019) and the Five Year Forward View for Mental Health (2016) outline that housing is critical to the prevention of mental health problems and the promotion of recovery.
Insecure, poor-quality housing and overcrowding can cause a decline in an individual’s mental wellbeing with 19% of adults living in poor quality housing in England having poor mental health outcomes. This includes those living in hostels, shelters, refugees, unsuitable accommodation, and those sofa surfing. It is known that 3.43% of Surrey’s population lives in overcrowded accommodation, that is, they had fewer bedrooms than they needed to avoid undesirable sharing, which is similar to that of the South East Region.
The impact of housing is also important to consider in forward planning as a preventative factor against poor mental health, as it is known to impact on wellbeing for children and young people and consequently for future generations.
See fuel poverty section below for more information regarding how cold homes impact mental health.
Stable, good quality housing is a protective factor against poor mental health and vital for recovery. In Surrey (2020/21), less than half (48%) of adults who are in contact with secondary mental health services live in stable and appropriate accommodation compared to over 60% nationally. Over half of mental health service users lack housing security which could negatively impact their recovery journey. The data illustration shows how stable accommodation in 2020/21 had declined significantly since 2017/18.
Stable accommodation
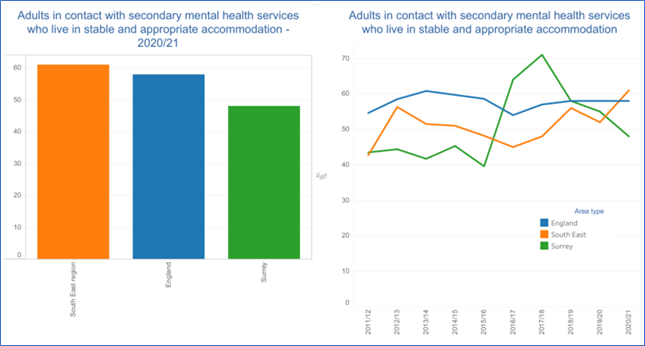
Figure 15. Adults in Contact with Mental Health Services who live in stable accommodation Source: Mental Health Tableau Dashboard
There is anecdotal evidence from the frontline in Surrey that the absence of stable housing options in Surrey delays hospital discharges. In turn, there is an absence of escalation pathways to support housing officers to refer people back to secondary care services when required, which may have detrimental effects on recovery.
People open to an Adult Social Care Mental Health Team in Surrey as a service user, excluding unknown addresses and under 18s, by Accommodation Status
| Area | Living Independently | Not Living Independently | Unknown |
| Elmbridge | 58.9% | 7.7% | 33.3% |
| Epsom and Ewell | 58.7% | 13.0% | 28.3% |
| Guildford | 73.2% | 10.5% | 16.3% |
| Mole Valley | 64.3% | 7.7% | 28.1% |
| Reigate and Banstead | 63.8% | 14.4% | 21.8% |
| Runnymede | 49.8% | 10.9% | 39.3% |
| Spelthorne | 60.3% | 13.7% | 26.1% |
| Surrey Heath | 57.2% | 12.1% | 30.7% |
| Tandridge | 68.7% | 7.5% | 23.8% |
| Waverley | 67.4% | 13.8% | 18.8% |
| Woking | 67.3% | 8.4% | 24.3% |
| Out of County | 54.5% | 35.2% | 10.2% |
| Not mappable | 14.3% | 61.9% | 23.8% |
| Grand Total | 62.2% | 13.6% | 24.2% |
Table 8. Accommodation status Source: SCC ASC
Fuel Poverty
Overall, Surrey had smaller proportions of households in fuel poverty (6.9%) than the English average (13.2%) in 2020. Guildford had the highest proportion of households in fuel poverty at 7.9% alongside Waverley and Epsom & Ewell with 7.3% in fuel poverty. Surrey Heath had the smallest percentage of households in fuel poverty at 5.8%. (Source: Fuel Poverty & related statistics, Surrey-i)
Mortgage and Landlord Possession
The Ministry of Justice produces quarterly national reports on mortgage and landlord possession.
| Mortgage claims, orders, warrants and repossessions have increased significantly when compared to the same quarter in 2021. | Compared to the same quarter in 2021, mortgage possession claims increased from 2,570 to 3,160 (23%), orders from 1,650 to 2,482 (50%), warrants from 1,121 to 2,112 (88%) and repossessions by county court bailiffs increased from 313 to 733 (134%). |
| Landlord possession actions have all increased significantly. | The pattern is repeated for landlord possession actions. When compared to the same quarter in 2021, landlord possession claims increased from 14,436 to 20,460 (42%), orders from 6,865 to 16,158 (135%), warrants from 4,285 to 8,717 (103%) and repossessions from 2,729 to 5,409 (98%). |
Table 9. Source: National statistics, Mortgage and landlord possession statistics: October to December 2022
Published 9 February 2023
Quarterly data is available by District & Boroughs councils with the use of webtool Mortgage and Landlord Possession Statistics: data visualisation tool.
Homelessness
More detail is available in Surrey Context’s chapter relating to homelessness.
Poor mental health is both a cause and consequence of homelessness. Those who are homeless are known to be at an increased risk of poor mental health outcomes, when compared to the general population. In the UK 45% of people experiencing homelessness have been diagnosed with a mental health issue. This is increased further for those caught in the ‘revolving door’, between hostels, prison, hospitals and the streets. Compared with the general population, homeless people are twice as likely to have a common mental health condition, and psychosis is up to 15 times more prevalent. They are also over nine times more likely to complete suicide. People experiencing homelessness find it difficult to access health services, including mental health care.
The 2016 Surrey Homeless Health Needs Audit highlighted that locally approximately 76% of respondents had at one time been told by a doctor or health professional that they suffer from depression, with the majority having been diagnosed in the previous 12 months. The audit also highlighted the clustering of factors that often occurs alongside homelessness and mental health as 40% indicated they used alcohol and/or drugs as a coping mechanism. In relation to access, 33% of respondents indicated that there was at least one occasion when they felt they needed an assessment or treatment for mental health but didn’t get it. The main reasons given for this varied from their own substance misuse, simply not being able to get an appointment or being on the waiting list.
Community Safety and Feeling Safe
Perceived safety or feeling safe in the community is central to wellbeing. Evidence highlights the physiological response to the stressor and coping behaviours have a detrimental impact on both mental and physical health. Surrey County Council is developing a survey linked to the new resident’s survey. Findings are to be added here when available.
Domestic Abuse
Being a victim of intimate partner violence or domestic abuse increases the risk of mental health problems and there are high rates of mental health conditions (particularly post-traumatic stress disorder (PTSD)) among people who have been raped and among immigrant women who have undergone female genital mutilation.
The Office for National Statistics (ONS) estimates that 1.2 million women and 700,000 men experience domestic violence. The rate of domestic abuse related incidents and crime in Surrey is 14.0 (per 1000), compared to 25.9 in the South East region and 30.3 in England. Other indicators are the rate of children on protection plans, 33.7 (per 10,000) in Surrey, compared to 25.9 in the region and 41.4 in England. These data only relate to official reports of violence, so real figures of domestic abuse are likely to be much higher. Research suggests that women experiencing domestic abuse are more likely to experience mental health problems, and conversely women with mental health problems are more likely to be victims of abuse. A systematic review found correlations between domestic violence and depression, anxiety PTSD, and substance use. Children exposed to domestic violence are more likely to have poorer educational outcomes and higher levels of mental ill health.
Domestic abuse-related incidents and crimes
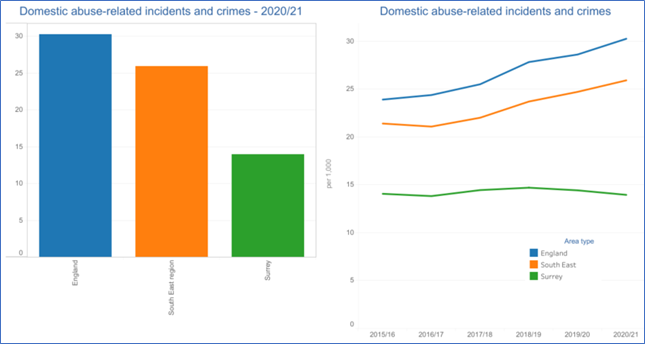
Figure 16. Domestic abuse-related incidents and crimes – 2020/21Source: Mental Health Tableau Dashboard
Violent Crime Offences
More detail is available in the JSNA Chapter Community Safety.
Surrey is among the top 5 safest counties in England. The overall crime rate in Surrey in 2021 was 49 crimes per 1,000 people, and the most common crimes were violence and sexual offences, experienced by 20 out of 1,000 residents. Hospitalisations due to violent crime (including sexual violence) are experienced by 25.8 per 100,000 in Surrey, compared to 29.4 in the South East region and 41.9 in England. In Surrey, the highest rate is in Reigate and Banstead (34.6 per 100,000), and the lowest in Runnymede (17.1 per 100,000).
There is high prevalence of mental health needs among people in contact with the criminal justice system. 16% of prisoners report symptoms indicative of psychosis, a much higher proportion than in the general population. These disorders are more severe and complex and are often combined with poor physical health and substance misuse. There are high levels of mental health conditions amongst people on probation and among male gang members.
People in contact with the criminal justice system have substantially more risk factors for suicide (increased prevalence of mental health conditions, substance misuse and socioeconomic deprivation) and are recognised as a priority group in the cross-government suicide prevention strategy. The risk of suicide is highest in the 28 days following release from prison.
Many people in contact with justice services with mental health problems will additionally be experiencing other issues such as difficulty accessing good quality homes, employment and income. This may result in their mental health deteriorating. Many have been victims of abuse and crime themselves.
Being a victim of crime, or exposure to violent or unsafe environments can increase the risk of developing a mental health problem. The most serious example at a young age is child abuse, which can have a sustained detrimental effect on mental health through to adulthood.
Workplace and Employment
Unemployment
The ONS review of labour markets identify 2.6% unemployed in Surrey comparative to 3.3% in the South -East and 3.8% in England for the period July 2021 – June 2022. In October 2022, 2.1% (15,505) of Surrey residents were claiming job seekers allowance in comparison to 2.9% South East and 3.6% Nationally. Surrey has the third lowest rate of Employment Support Allowance claimants for mental and behavioural health disorders (2019) among its CIPHA comparable areas in the South East of England (16.4 per thousand which is significantly lower than the 20.4 average for comparable areas and 27.3 for England).
The percentage of the population with physical or mental long-term conditions in employment (2021/22) (aged 16-64) was 74.5% in Surrey, comparably higher than the South East, 70% and England 65.5%. It is important to note that this information is Surrey-wide and may mask pockets of high unemployment rates.
Workplace Stress and Burnout
Work-related stress, depression or anxiety is defined as a harmful reaction people have to undue pressures and demands placed on them at work. The Health and Safety Executive report on work related stress, anxiety and depression statistics in Great Britain (2021) cites that the main work factors cited by respondents as causing work-related stress, depression or anxiety were: workload pressures, including tight deadlines and too much responsibility and a lack of managerial support.
By industry sectors, stress, depression, or anxiety is most prevalent in (in descending order):
- Public administration, defence, compulsory social security
- Human health and social work activities
- Education
Although there is no Surrey data, the latest national Labour Force Survey (2020-21) data shows that:
- Stress, depression, or anxiety accounted for 50% of all work-related ill health cases.
- 822,000 workers were suffering from work-related stress, depression, or anxiety (new or long-standing), a prevalence rate of 2,480 per 100,000 workers. Of this total, an estimated 449,000 reported that this was caused or made worse by the effects of the Coronavirus pandemic.
- In 2020/21 the rate was higher than the 2018/19 pre-coronavirus levels.
- Health and Safety Executive (HSE) data shows that stress, depression or anxiety and musculoskeletal disorders accounted for the majority of days lost due to work-related ill health in 2021/22. 17.0 million days were lost for stress, depression or anxiety and 7.3 million days were lost due to musculoskeletal disorders.
- On average, each person suffering took around 21.6 days for stress, depression, or anxiety.
National suicide prevention policy advises consideration of unskilled manual workers and health and social care workforce.
Number of Surrey enterprises by group.
| Industry Group | England | South East | Surrey | |||
| Count | % | Count | % | Count | % | |
| Agriculture, forestry & fishing | 93,195 | 3.9% | 11,095 | 2.7% | 825 | 1.3% |
| Production | 131,765 | 5.5% | 20,750 | 5.0% | 2,420 | 3.8% |
| Construction | 327,615 | 13.6% | 61,355 | 14.9% | 8,890 | 14.0% |
| Motor trades | 69,475 | 2.9% | 11,570 | 2.8% | 1,555 | 2.4% |
| Wholesale | 96,705 | 4.0% | 14,860 | 3.6% | 2,165 | 3.4% |
| Retail | 195,395 | 8.1% | 30,245 | 7.3% | 3,730 | 5.9% |
| Transport & Storage (inc. postal) | 122,265 | 5.1% | 16,290 | 3.9% | 1,820 | 2.9% |
| Accommodation & food services | 146,105 | 6.1% | 21,175 | 5.1% | 2,480 | 3.9% |
| Information & communication | 181,615 | 7.5% | 38,825 | 9.4% | 6,915 | 10.9% |
| Finance & insurance | 54,470 | 2.3% | 8,530 | 2.1% | 2,080 | 3.3% |
| Property | 98,920 | 4.1% | 15,305 | 3.7% | 2,580 | 4.1% |
| Professional, scientific & technical | 387,210 | 16.1% | 74,515 | 18.1% | 13,985 | 22.0% |
| Business administration | 204,925 | 8.5% | 37,090 | 9.0% | 6,340 | 10.0% |
| Public administration & defence | 7,130 | 0.3% | 1,255 | 0.3% | 85 | 0.1% |
| Education | 42,515 | 1.8% | 7,680 | 1.9% | 1,175 | 1.9% |
| Health | 92,380 | 3.8% | 15,300 | 3.7% | 2,180 | 3.4% |
| Arts, entertainment, recreation & other | 156,355 | 6.5% | 26,810 | 6.5% | 4,265 | 6.7% |
| Total | 2,408,040 | 100.0% | 412,650 | 100.0% | 63,490 | 100.0% |
Table 10. Number of VAT and/or PAYE based enterprises by broad industry group Source: ONS UK business: activity, size and location
Healthy Environment
Utilisation of Healthy Environment
Nationally cycling levels increased in 2020 to the highest levels seen since the start of the series, with increases seen in trips, stages and miles cycled. Nationally cycling as a proportion of trips by all transport modes increased from 2% in 2019 to 3% in 2020. Cycling can also boost your mood, improving the symptoms of some mental health conditions like depression and anxiety.
The Active Lives Survey (2022) for Surrey shows a decline in cycling for travel at least once a month from 10% in 2019 to 6% in 2021. For the same period South East declined from 8.7% to 6.5% and England 7.6% to 6.4%.
Noise
The link between noise exposure and mental health disorders is gaining increasing attention because noise pollution is an ongoing factor effecting populations in urbanised areas. A systematic review and meta-analysis looked at research published between 2000 and 2022 in order to evaluate whether the available evidence supports an adverse association between noise annoyance and mental health problems in people. It was found that noise pollution is potentially an important mediator of the relationship between noise exposure and mental health outcomes.
In Surrey 6.2% of the population were exposed to road, rail and air transport noise of 65dB or more during the daytime in 2016 which was higher when compared to those living in the South East where 4.9% of the population were exposed. Similarly, the percentage of the population exposed to road, rail and air transport noise of 55 dB or more during the night-time was higher at 12.8% in Surrey when compared to the South East region at 8.6%.
It is difficult to interpret this data and long-term trends are currently misleading due to the impact that Coronavirus has had on road, rail and air transport. For example, long-term trends for traffic volume have been skewed and traffic levels in 2021 were lower than 2011 levels. Similarly, there has been a decrease in passengers flying with a 23% fall in passengers compared to the same period in 2019. It is difficult to currently predict when road, rail and air transport may surpass pre-pandemic levels and the impact that these noise levels will have on Surrey’s population.
In 2019/20 rates of complaints regarding noise in Surrey were lower than the South East average of 4.5 complaints per 1000 at 3.7 per 1000. Although Surrey’s average was lower than the South East’s, at District & Borough levels these rates differed with Guildford and Runnymede having rates of complaints over the regional average (5.4 per 1000 and 4.9 per 1000 respectively) and Waverley having the lowest (2.1 per 1000).
Surrey noise impact areas
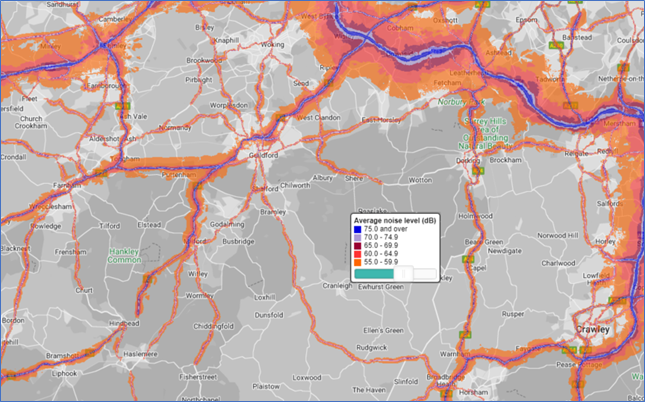
Figure 17: Source England Noise and Air Quality Viewer
Social Isolation and Loneliness
Social isolation in social care users in Surrey is comparable to the region and England, with over half of social care users reporting not having as much social contact as they would like.
Less than a quarter of adult carers in Surrey reported having as much social contact as they would like significantly worse than the regional and national reports on social contact.
Social Isolation Carers
| Indicator | Period | Surrey | Region | England | Worst | Best |
| adult social care users who have as much social contact as they would like 18+yrs | 2019/20 | 47.3% | 45.9% | 45.9% | 34.3% | 56.6% |
| adult social care users who have as much social contact as they would like 65+yrs | 2019/20 | 43.7% | 42.9% | 43.4% | 30.4% | 53.8% |
| adult carers who have as much social contact as they would like 18+yrs | 2018/19 | 22.4% | 31.4% | 32.5% | 11.7% | 45.7% |
| adult carers who have as much social contact as they would like 65+yrs | 2018/19 | 24.2% | 32.7% | 34.5% | 11.1% | 50.9% |
Table 11: Social Isolation Carers Source OHID Fingertips Public Health Profiles
The ONS has produced a map of loneliness by local authority based upon data from the 2020/21 Opinions and Lifestyle Survey, % response to “often” or “always” feeling lonely. Highest levels of loneliness were reported in the Mole Valley (10.9%),
Loneliness rates by local authority
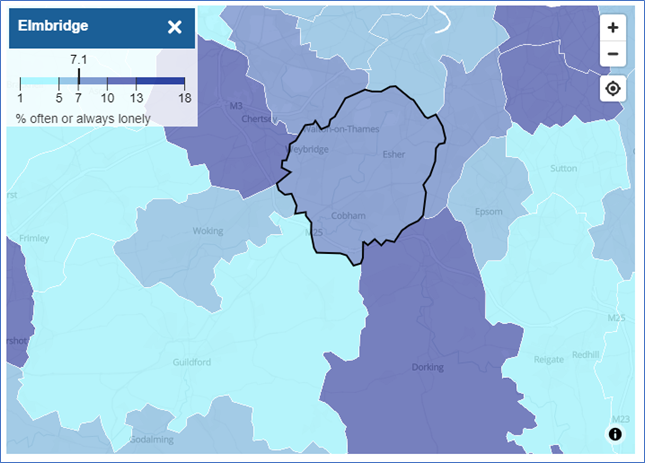
Figure 18. Percentage reporting “often or always” feeling lonely, Oct 2020 to Feb 2021 Source: ONS. Mapping loneliness during the coronavirus pandemic
6. Populations at Risk
Young Adults
Instances of self-harm are more common in children and young people, and as many as 25.7% of women in England between the ages of 16 to 24 report that they have self-harmed at some point in their lives.
Trends reported by Public Health England on Children and Young People’s Mental Health and Wellbeing indicate the number of hospital admissions in 2020-21 as a result of self-harm in Surrey for 10-24 year olds is increasingly getting worse (468.7 per 100,000 in Surrey, 505.6 Regionally and 421.9 in England).
More information can be found in the Emotional Wellbeing and Mental Health chapter of the JSNA which covers young adults. This chapter is currently being rewritten with an expected publishing date of June 2023.
Adults
People open to an Adult Social Care Mental Health Team in Surrey as a service user, excluding unknown addresses and under 18s, by Age
| Age Range | % Open Adult Social Care mental health cases |
|---|---|
| 18-19 | 1.20% |
| 20-29 | 13.24% |
| 30-39 | 14.41% |
| 40-49 | 17.21% |
| 50-59 | 20.29% |
| 60-69 | 16.81% |
| 70-79 | 8.59% |
| 80-89 | 6.38% |
| >90 | 1.87% |
Table 12. People open to ASC Mental Health Team Source: SCC ASC
Perinatal
Perinatal mental health (PMH) is the overarching term for mental health during pregnancy and the first postnatal year and affects around 20% of mothers at some point. It can be characterised by either an existing mental health issue or a condition that arises during pregnancy or related to pregnancy.
Older People
Among older people over the age of 65, the two most common mental health problems are depression and dementia. The estimated prevalence of common mental disorders in the population aged 65 and older in Surrey (2017) is 7.9%. This is significantly lower than the estimated prevalence in England of 10.2%. (No data is available for comparison with CIPHA neighbours for Surrey.) Given the overall affluence of Surrey, this may be an underestimate, as some people may be accessing private health sector services.
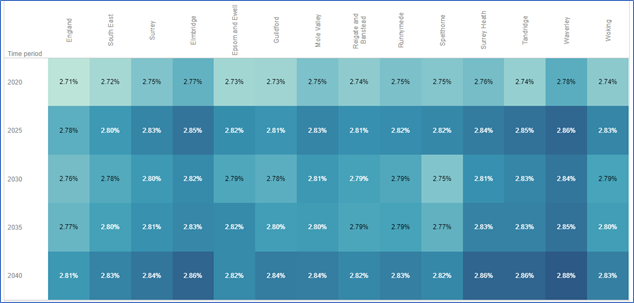
Figure 19. Total Population aged 65+ and predicted to have severe depression by local authority
Mental health problems in older people are often more apparent in settings such as hospitals and care homes. Depression affects 4 in 10 people living in care homes and nursing homes, and about 1 in 10 residents have psychotic symptoms such as delusions and hallucinations.
Nationally suicides are increasing in older adults. Key risk factors such as poor physical health, social isolation, retirement, bereavement and changes in social circumstances have been identified in older adults. Additionally in this group there is thwarted belongingness, perceived burdensomeness, acquired capability and risk indicators. In Surrey work is needed to understand the suicide risk in older adults and to ensure that there is a clear prevention and intervention workstream targeting older adults.
Carers
More detail is available in the JSNA Chapter for Carers and the Surrey Carers Strategy (2021-24)
The physical, emotional and psychological demands of caring can be demanding and stressful and are often referred to by researchers collectively as ‘the burden of care’. The British Medical Association (BMA) recognises that caring can have a negative impact on mental, physical health and emotional wellbeing.
There is an evidence base (e.g. Carers UK, annual State of Caring Report) which highlights that carers are more likely to develop mental health problems as a result of their caring role. In addition, data from the British Household Panel Survey found that carers are more likely to report high levels of psychological distress, including anxiety, depression, loss of confidence and self-esteem, compared to non-carers; and that women were more likely than men to suffer from mental ill-health if they were a carer. The research also found key times when caring was more likely to have a detrimental impact on their wellbeing: e.g., at the beginning of caring, when caring is more complex and the carer becomes the sole provider of care, during the pandemic as a result of services being withdrawn, and once caring has ceased. Also, the more care a carer provides, the more likely it is that they will be in poor health.
Caring can also take a toll on carers’ education and employment opportunities, including career development, promotions and pay rises, as well as impacting on carers’ ability to work (many are forced to give up work entirely, or to take early retirement or reduced hours to facilitate their caring role). This includes both adult and young carers.
The latest 2021 Census data is expected to be available in 2023. Until then we only have historical data. In 2016 there were an estimated 115,216 carers of all ages living in Surrey, which equated to 10% of the Surrey population. Yet in 2015/16 carers support organisations (jointly funded by Adult Social Care and NHS) reported helping over 28,000 carers. This implies many carers go unrecognised and/or may not be seeking or accessing support. There may also be double counting of some carers.
By 2025 the number of carers of all ages living in Surrey is projected to be 124,176 (8% growth between 2016 and 2025). These figures may well be an underestimate as many people view their caring as an extension of their familial role, such as husband, wife, son, daughter, friend, or good neighbour, and not as a carer per se. On average for 25% of carers, it takes five years to recognise themselves as a carer. Applying the estimated projection figures from above, the 10% of the Surrey population being carers is in line with the UK. Again, more up to date data will be available when the 2021 Census is published for health, disability, and unpaid care.
The organisations that support carers in Surrey have identified that the demand for carers services has increased during the last 2 years and coupled with this, the cases have become more complex. This is likely to be compounded by the current economic landscape.
Ethnicity
More detail is available in Religion, language and ethnicity for population estimates.
Different cultures have different experiences of mental health, and this may be in part because mental health is viewed and treated differently by different cultures to a certain degree due to stigma. Stigma and fear can discourage or stop people (and people from minority ethnic communities in particular) from seeking help at an early stage for their mental health problems. This may result in them presenting at a later stage with potentially more severe symptoms.
The last official data for ethnic community population size and location is from the 2011 census. The latest 2021 Census data will only be available in December 2022/ January 2023, so currently only 2001 Census data is available. The Surrey Minority Ethnic Forum view is that 2001 Census data is no longer relevant in relation to the ethnically diverse population sizes and locations in Surrey. Surrey Minority Ethnic Forum has a general collective knowledge on which ethnic communities are located where in the county e.g. Nepalese community in Farnham, and relative size of the population (i.e. very small, small, medium, large, very large).
The latest information from Gov.uk (2014 Adult Psychiatric Morbidity Survey), stated:
- The percentage of people in Surrey who experienced a common mental disorder (CMD) (like anxiety, depression, or obsessive-compulsive disorder) in the past week did not vary by ethnic group for men; but it did for women.
- 29% of Black women had experienced a common mental disorder in the past week, a higher rate than for women from White British and Other White ethnic groups.
- CMDs were more prevalent in White British women than in Other White women, at 21% and 16% respectively.
Any Common Mental Disorder – Proportion of respondents (%)
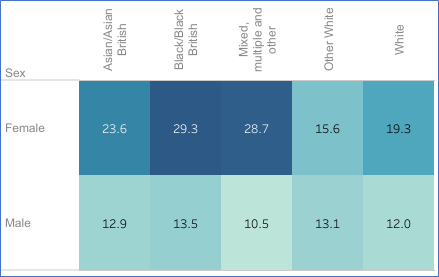
Figure 20. Adult Psychiatric Morbidity Survey Source: Mental Health Tableau Dashboard
Proportion of adults in England with various mental health disorders
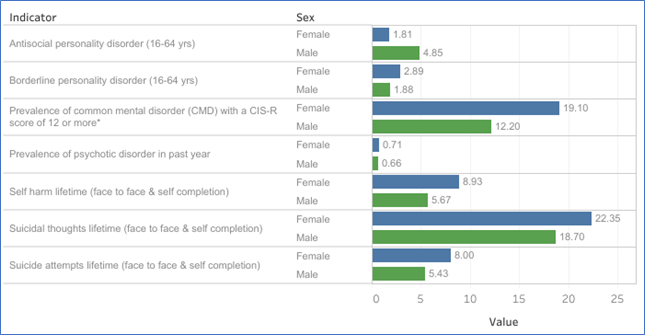
Figure 21. Adult Psychiatric Morbidity Survey Source: Mental Health Tableau Dashboard
Gaps in mental health service engagement and provision were identified in the Independent Mental Health Network (IMHN) and Surrey Minority Ethic Forum SMEF report (2020) and further insight research. These gaps included provision for non-English speaking population and culturally appropriate interface and infrastructure which resonates and aligns with the community.
The 2021 ONS report on “Mortality from leading causes of death by ethnic group, England and Wales: 2012 to 2019” found that while not one of the most common causes of death, suicide in males were higher in White and Mixed ethnic groups than in other groups, and in females the rate for the Mixed ethnic group was higher than other groups[i]. Locally and nationally, there is anecdotal evidence that mixed heritage could be a risk factor. There is an opportunity to explore this further. Ethnicity is not recorded on the death certificate, as ethnicity is classified as a self-reported characteristic therefore it is difficult to get an accurate picture of those ethnic groups at increased risk of suicide. Locally poor reporting and recording of ethnicity is a major limitation of exploring this in a systematic way.
People open to an Adult Social Care Mental Health Team in Surrey as a service user, excluding unknown addresses and under 18, by Ethnicity, when recorded
| Ethnicity | % Open Adult Social Care mental health cases |
|---|---|
| Asian / Asian British | 3.17% |
| Black / Black British | 2.74% |
| Mixed or Multiple Ethnic Groups | 2.77% |
| Other Ethnic Group | 2.17% |
| White | 75.84% |
| Undeclared not known or refused | 13.30% |
Table 13. People open to ASC Mental Health Team Source: SCC ASC
Gypsy, Roma, Traveller (GRT) Communities
The latest 2021 Census data will only be available in December 2022/ January 202, so only estimates can be provided here. In the UK there are approximately 100,000 – 300,000 Gypsy and Traveller, up to 200,000 Roma, people. But this is probably an underestimate as this category was only recently included on the Census and many members of the community do not report as GRT due to distrust of government and potential consequences. An estimate of 10,000+ GRT population in Surrey has been suggested by Surrey Gypsy Traveller Communities Forum, but as Census and local authority housing figures fail to capture true numbers, actual numbers could be much higher.
Insights from the Surrey Gypsy Traveller Communities Forum identifies that there is considerable stigma within the GRT community around mental health.
Staff working with GRT communities report extensive gaps, particularly in terms of stigma, access, and rapid responses. Many of such issues link directly back to trust issues from the communities and sometimes assumptions or lack of cultural competency from services. The Surrey Gypsy Traveller Communities Forum say that several members of the community report experiencing prejudice from GP surgeries, and sometimes difficulty in registering. As a result, very few people in the GRT community would seek help from someone who they did not know and trust. Most would not refer themselves to an impersonal phone, email, or service. If members of the community do seek support, they may have moved on in the time gap between referral and seeing a professional, so there is then a need for rapid responses.
People with Learning Disability
Between 25% and 40% of people with a learning disability have a mental health need. Some studies suggest the rate of mental health problems in people with a learning disability is double that of the general population. The estimated prevalence of mental health disorders ranges from 15-52%, depending on the diagnostic criteria used.
There is currently a gap in understanding of those with Learning Disability utilising mental health services nationally and locally.
Neurodivergence
Neurodivergence is an umbrella term for people with autism spectrum disorder (ASD) 1.5-2%, attention deficit hyperactivity disorder (ADHD) 3-6%. Foetal Alcohol Spectrum Disorder (FASD) 4-6%, Tourette’s 2-3%, Development Coordination Disorder (DCD) 2-6%, Dyslexia and Sensory integration disorders. It is now widely evidenced that people with one form of neurodivergence are more likely to have others related which commonly co-occur, as cited above, in addition to both an increased risk and occurrence of mental health issues across their life course.
People with a learning disability and/or autism who have a mental health condition may result in them displaying behaviour that challenges, for example aggression and violence. This can result is people having contact with criminal justice system instead of mental health services.
Many autistic people, for example, experience feeling:
- very worried a lot of the time (anxiety)
- unhappy, irritable, or hopeless (depression)
- a need to keep doing certain actions – obsessive compulsive disorder (OCD)
Nationally, there is emerging evidence of significant associations of neurodevelopmental and co-occurrent psychiatric disorders with disease patterns more commonly attributed to medical “organic” or “functional neurological” conditions. Examples include chronic migraine, fibromyalgia, mast cell activation syndrome, postural orthostatic tachycardia syndrome (all linked to hypermobility related conditions), and obstructive sleep apnoea. A more considered longitudinal approach is required, so caution is needed given the scarcity of specialist adult neurodevelopmental services; and waiting list times run to years in the UK. It should be noted, though, that ADHD is now recognised as a neurodevelopmental condition and not a mental health issue in itself. Though as with autism, the prevalence of mental health issues alongside ADHD is higher than in the general population.
Recent follow-up studies in the UK and the Netherlands of children with ADHD attending child mental health services found far higher persistence rates into adulthood (in the order of 80%). This may reflect the severity of the cases in these studies, though wider evidence shows ADHD may also be seen in other psychiatric conditions including personality disorders (particularly those characterised by emotional instability such as antisocial personality disorder and borderline personality disorder), while poor attention and distractibility are also common in depression, anxiety, and bipolar disorder. ADHD symptoms also overlap or co-occur with other neurodevelopmental disorders such as autism and intellectual disability, and specific learning difficulties. This may result in additional or alternative diagnoses. Furthermore, behavioural problems such as substance misuse disorders and antisocial behaviour occur at increased rates in adults with ADHD.
If ADHD in adulthood is unrecognised as a result of comorbidity, service provision and treatment may be ineffective. Untreated, the presence of ADHD may lead to educational and occupational disadvantage, and significant social impairments. The social consequences of the adult form of ADHD are equally marked, with dysfunctional patterns of behaviour leading to poor interpersonal relationships and marital failure. Service provision and treatment for ADHD in childhood is now well established but is much less available for adults diagnosed with the condition. Mental health services for adults with ADHD remain relatively uncommon or greatly under-resourced in the UK and across much of Europe, resulting in high levels of untreated disorder even when it is identified.
A UK Parliament Post (Jan 2020) stated that 70% of autistic people have a mental health condition, and that 40% have two or more. Also, that a high proportion of people segregated or detained in mental health institutions are autistic.
Suicide is a leading cause of early mortality amongst autistic people. A large UK study found that 66% of autistic adults without a learning disability had contemplated suicide, compared with 17% of non-autistic adults. Research has suggested that 14% of autistic children experience suicidal thoughts, compared with 0.5% of non-autistic children.
Access to psychology, speech and language, and occupational therapy services after diagnosis was reported to be similar or better than in 2016. Generally, access was reported to be better for people with learning disabilities than for those diagnosed with autism who do not have learning disabilities. But access to psychology and occupational therapy assessments was reported to have improved in a substantial number of places for those without learning disabilities. There is no data at county level for comparison currently.
Opportunities for low-level interpersonal and/or preventive support were reported as being available by 96% of respondents. A wide range of interesting examples were given. However, less positively, 74% of respondents reported that individuals diagnosed with autism had difficulty subsequently in getting access to mental health services.
A review of Coroners’ inquest records and family interviews by Autism Research Centre at the University of Cambridge[3], found that:
- 10% of those who died by suicide had evidence of elevated autistic traits, indicating likely undiagnosed autism. This is 11 times higher than the rate of autism in the UK.
- 6% of autistic adults have thought about taking their own life, and 35% have attempted suicide.
Autistic people responding to the Surrey consultation for the All-Age Autism Strategy identified a lack of autism understanding and accessibility in mental health services as a major problem.
Asylum Seekers, Refugees and Migrants
Asylum seekers are defined as people who enter a country to seek asylum due to fear/ risk of safety. The reasons for seeking asylum are usually complex – often asylum seekers may be fleeing conflict, political or social unrest. They may have experienced or witnessed torture, imprisonment, and other abuse. The situation they are leaving will often cause a degree of mental and emotional distress and the social isolation they may experience in the new country is an additional risk factor.
The most recent data (2015) illustrated significantly lower rate of migrant GP registrations per 1,000 than England 11.2 vs 12.6. On average nine unaccompanied and former unaccompanied children (on sight) are placed in Surrey every month. Given the significant increase in migrants in Surrey. There is a Migrant Health JSNA under development expected publication in Spring 2023.
Little is known about the risk of suicide amongst refugees and asylum seekers. Frontline staff in Surrey report high levels of poor mental and emotional wellbeing and social isolation in these groups.
Adverse Childhood Experiences/Life Events
Adverse Childhood Experiences (ACEs) are specific traumatic events which occur before the age of 18 and can be grouped into three types: abuse, neglect and household adversity. The ten most commonly measured ACEs are: physical, sexual or emotional abuse, emotional or physical neglect, mental illness, substance misuse, an incarcerated relative, domestic abuse, and parental separation.
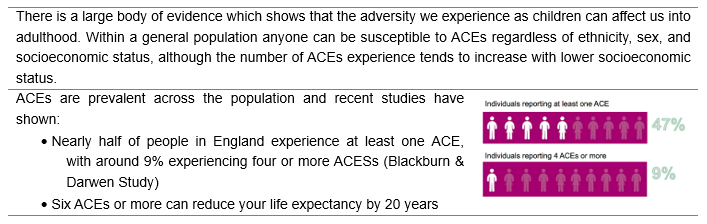
Figure 22. Source: BMC Medical National household survey of adverse childhood experiences and their relationship with resilience to health-harming behaviours in England
Repeated activation of the body’s stress-response systems (toxic stress) can cause hormonal imbalances, impair cognitive ability, and even change the way DNA is transcribed, causing ACEs to be passed down from one generation to the next. The length and frequency of exposure to toxic stress during childhood can in turn lead to health problems such as asthma, poor growth, frequent infections, learning difficulties and behavioural issues into adulthood. Experiencing 4 or more ACEs is associated with significantly increased risk for 70% of the leading causes of death in adults including heart disease, stroke, cancer, respiratory disorder, Type 2 diabetes, Alzheimer’s, and suicide.
ACEs are not only associated with poorer health outcomes but a range of social and economic ones too. People with ACEs are more likely to under-perform in school, develop high-risk behaviours, and be on lower incomes. Deprivation, health, and social factors are closely related and perpetuate an intergenerational cycle of adversity.
A recent large-scale study in England and Wales, aiming to estimate the health and financial burden of ACEs in England and Wales for residents aged 16-69, showed that: cumulative relationships were found between ACEs and risks of all outcomes. For health risks, ACEs were highest for drug use (Wales 58.8%, England 52.6%), although ACE-attributable smoking had the highest estimated costs (England and Wales, £7.8 billion). For causes of ill health, the prevalence of ACEs were highest for violence (Wales 48.9%, England 43.4%) and mental illness (ranging from 29.1% for anxiety in England to 49.7% for other mental illness in Wales). The greatest ACE-attributable costs were for mental illness (anxiety, depression, and other mental illness; England and Wales, £11.2 billion) and cancer (£7.9 billion). The study concluded that ACEs impose a substantial societal burden in England and Wales. Policies and practices that prevent ACEs, build resilience and develop trauma-informed services are needed to reduce burden of disease and avoidable service use and financial costs across health and other sectors.
Trauma results from an event, series of events or set of circumstances including ACEs that is/ are experienced by an individual as physically or emotionally harmful, or life threatening. This has lasting adverse effects on the individual’s functioning and mental, physical, social, emotional, or spiritual wellbeing.
Experience of Bereavement
While grief is not an illness, bereavement can influence every aspect of our well-being, from physical and mental health to feelings of connectedness and the ability to function at work or school. For some people bereavement can be a highly stressful life-event and associated with a period of intense suffering. While many people regain their equilibrium after a death and adjust without professional psychological intervention, a minority experience persistent grief symptoms that negatively impact their mental and physical health and ability to function for a substantial period.
Bereavement is associated with an increased risk of mental health problems, such as depression, anxiety and post-traumatic stress disorder and can be a contributory factor to suicide. With the pandemic and multiple lockdowns, many people would have not been able to be with loved ones when they were dying, which would have increased the negative emotional impacts and suffering.
Many health care staff would have experienced more frequent and traumatic bereavements among patients and potentially also within their own families and networks. 72% of people have been bereaved in the last five years (2019), and almost all of us will be affected by the death of someone close at some point. In normal times it is estimated that 10-20% of those bereaved reach clinical thresholds for depression, with about 10% adults experiencing prolonged grief disorder.
Although there is no data on bereavement specifically for Surrey, the 2017-20 audit in Surrey showed that bereavement was the third commonest contributory factor in completed suicides. Suicide bereavement leaves people at a higher risk of suicide themselves. A survey in 2010[ii] found that friends and relatives of people who die by suicide have a 1 in 10 risk of making a suicide attempt after their loss.
Relationship Breakdown
Being happily married or in a stable relationship impacts positively on mental health. Research has found that high marital quality is associated with lower stress and less depression. Mind and Relate surveyed over 1,000 people with an experience of mental health problems in romantic relationships (2013) and found that 60% people with mental health problems said being in a relationship has had a ‘positive impact’ on their mental health.
Conversely, relationship breakdown can have negative effects on mental health and wellbeing. (Sometimes a person’s identity gets wrapped up in the “we” of a relationship, which means a breakup can disrupt how the person thinks about themselves). Single people have better mental health outcomes than people who are unhappily married. Often painful emotions are experienced during relationship breakdown, which can lead or contribute to periods of emotional stress and sometimes depression and anxiety. Relationship breakdown also constitutes a major risk factor for suicide ideation and completion.
There is official data on divorce rates, but not on relationship breakdowns. The average overall divorce rate in England and Wales is 33.3%, based on all marriages over the past 50+ years between 1964 to 2019. In 2020 ONS data shows, there were 103,592 divorces granted in England and Wales, a decrease of 4.5% compared with 2019 where there were 117,723; (and divorces in 2019 were 17.4% higher than in 2018). Of these, the majority were among opposite-sex couples (98.9%). ONS do not supply divorce rate data by area of residence (because divorce data provided to them by the courts contains no information on the area of residence of the parties).
The 2021 Census data is not yet available. Data from the 2011 Census showed that Surrey has significantly lower percentage of marital break ups at 10.4% than its comparator neighbours and England at 11.6%. Surrey also has a significantly lower percentage of lone parent households at 4.75 than England at 7.1%.
Relationship breakdown is often a contributory factor in people who access talking therapies in Surrey and the 2017-20 audit of suicide cases in Surrey showed that relationship problems including divorce were a factor in nearly a third of completed suicides.
Multiple Adverse Life Events
Often people experience more than one adverse life situation/ event at a time which can increase the negative impact on their mental health and wellbeing. In an insight survey conducted by the Surrey Public Health team in 2021 with 193 residents, many reported experiencing at least two, and often three or four, adverse life situations/ events combined, including: caring, covid, mental health issues, physical health (including cancer, lack of mobility etc), redundancy and not being able to get any paid work or not having enough paid work.
Sexuality / LGBTQ+
People who identify as LGBTQ+ have higher rates of common mental problems – including depression and anxiety and lower wellbeing – than heterosexual people; and the gap is greater for older adults (over 55 years) and those under 35, than during middle age.
A report by Stonewall (2018), identified a large number of people who identify as LGBTQ have experienced depression, anxiety, had suicidal thoughts or even attempted to take their own life in the last year. Participants explained how experiences of discrimination and harassment in day-to-day life, rejection from one’s family and friends and being subjected to hate crimes and incidents had a negative impact on them. The sense of ‘otherness’ can leave trans young adults particularly vulnerable to depression and suicidal thoughts (Royal College of Nursing and PHE, 2015).
- 52% of people who identify as LGBT people said they’ve experienced depression.
- 13% of people who identify as LGBT aged 18-24 said they’ve attempted to take their own life.
- 46% of trans people have thought about taking their own life in the last year, 31% of LGBT people who aren’t trans said the same.
- 41% of people who identify as nonbinary said they harmed themselves compared to 20% of LGBT women and 12% of LGBT men.
- One in eight LGBT people (13 per cent) have experienced some form of unequal treatment from healthcare staff because they’re LGBT.
- Almost one in four LGBT people (23%) have witnessed discriminatory or negative remarks against LGBT people by healthcare staff. In the last year alone, 6% of LGBT people (including 20% of trans people) have witnessed these remarks.
The 2019 ONS annual population survey found 1.6% of people in the South East identified as gay or lesbian, 1.3% bisexual, 1.4% responded other and 2.8% answered don’t know or declined to answer. This is a similar picture to what was seen nationally. This survey focuses on sexuality rather than gender identity. Locally a survey is being developed to better understand the needs and experiences of LGBTQIA+ (lesbian, gay, bisexual, transgender, queer or questioning, intersex, asexual and other identities) people in Surrey.
A Home Office funded study (Gender Identity Research and Education 2018, 2018), estimated the number of trans people in the UK to be between 300,000 – 500,000, where trans was defined as ‘a large reservoir of transgender people who experience some degree of gender variance’. Applying this estimate to the Surrey population would lead to an estimate of at least 7,000 trans people in Surrey. There are no accurate Surrey figures, as recent polls from other LGBTQ+ organisations in the area do not really reach a large amount of the community.
There were 1,180 civil partnerships formed in the UK in 2019, the latest year for which data are available. This is an increase of 4.5% from 1,129 in 2018.
These figures will be updated when Census data for 2021 is available.
Armed Forces Community and Veterans
The Armed Forces Community includes serving personnel, both regular and reservists, ex-service personnel (veterans) and their families. Veterans are defined as anyone who has served for at least one day in the British Armed Forces. The term veteran in this document is used to represent all former Armed Forces personnel.
For most people service in the Armed Forces has a positive impact on their life and the majority of service personnel do not experience mental health problems while they are in service or when they transition into civilian life, and incidences of common mental health disorders such as depression and anxiety are similar to those seen in the general public.
Experiences during service and the later transition to civilian life mean that different factors may trigger mental health issues. The most common mental health problems for ex-service personnel are alcohol problems, gambling, depression, and anxiety disorder, with a minority suffering Post Traumatic Stress Disorder (PTSD).
Mental health issues can sometimes be exacerbated by post-service factors, such as difficulties in making the transition to civilian life, marital problems, and loss of family and social support networks. Some younger or single veterans are more likely to run into difficulties than others, with pre-service problems being an important factor, and the culture of some heavy alcohol use within the services is a significant problem. Veterans are also vulnerable to social exclusion and homelessness, both of which are risk factors for mental ill health.
Early service leavers who have served for a relatively short period are also more likely to experience problems transitioning back to civilian life and can be at higher risk of suicide in the first two years after leaving service. A contributing factor may be that more comprehensive resettlement support package is only available to those with four or more years’ service and those who are medically discharged.
National data based on the 2018 GB Veterans Model, estimate that there were 2.5 million veterans in 2016 (63% of which are over 65 years and 90% are male) with a projected fall to 1.635 million by 2028 (56% of which would be over 65 with 87% male). Current estimates for Surrey show that there are approximately 32,600 veterans, with higher numbers in Surrey Heath, Guildford, and Waverley.
Armed Service veterans by District & Boroughs
| Area name | Previously served in regular UK armed forces | Previously served in reserve UK armed forces | Previously served in both regular and reserve UK armed forces | Has previously served in any UK armed forces | Has previously served in any UK armed forces |
| Elmbridge | 2,229 | 829 | 133 | 3,191 | 2.9% |
| Epsom and Ewell | 1,143 | 438 | 90 | 1,671 | 2.6% |
| Guildford | 3,038 | 936 | 164 | 4,138 | 3.5% |
| Mole Valley | 1,965 | 630 | 102 | 2,697 | 3.7% |
| Reigate and Banstead | 2,714 | 924 | 174 | 3,812 | 3.2% |
| Runnymede | 1,494 | 487 | 80 | 2,061 | 2.8% |
| Spelthorne | 1,905 | 495 | 112 | 2,512 | 3.0% |
| Surrey Heath | 2,519 | 584 | 143 | 3,246 | 4.4% |
| Tandridge | 1,727 | 633 | 136 | 2,496 | 3.5% |
| Waverley | 3,261 | 898 | 188 | 4,347 | 4.2% |
| Woking | 1,776 | 548 | 102 | 2,426 | 2.9% |
| Surrey | 23,771 | 7,402 | 1,424 | 32,597 |
Table 14. UK armed forces veterans, England and Wales – Office for National Statistics 2021
Rates of mental health problems amongst serving personnel and recent veterans appear to be broadly similar to the UK population as a whole (DoH, 2009) but working age veterans are more likely to report suffering from depression and anxiety. Health data for service leavers demonstrates that the majority (92%) depart in good health. In 2020/21 mental and behavioural disorders was one of the top three causes for medical discharges from the services alongside musculoskeletal disorders and injuries. Mental health and behaviour discharges accounted for 24% of Royal Navy medical discharges, 46% of Royal Air Force medical discharges and 47% of Army medical discharges.
There is growing evidence that some mental health conditions may present many years after leaving the services – research shows that it takes 12 years on average for an ex-service person to ask for support. Most veterans developing mental health problems experience a common mental disorder such as depression or anxiety, with a smaller number diagnosed with PTSD. The rates of PTSD in the combined Regular Forces and Veteran population is about 6% compared to between 4% and 5% in the general population. In the Reserve Forces the rate is reported as being around 6% to 7%. Veterans also experience a higher rate of alcohol abuse. A survey of both serving personnel and veterans found the weighted prevalence of common mental disorders and PTSD symptoms in veterans was 4.8%. The most common diagnoses were alcohol abuse (18.0%) and neurotic disorders (13.5%), and some reservists were at a greater risk of developing psychiatric problems than regular service personnel. The suicide rate during and after service is also broadly similar to the rest of the population, although there is an increased risk for young men under 24 who leave the forces early – approximately two to three times higher than the risk for the same age group in the general and serving populations.
More detail is available in the Surrey JSNA on the Armed Forces Community.
Physical Health and Health Behaviours
7. Physical Health and Health Behaviours
Physical Health
Refer to The Surrey Context: People and Place for condition diagnosis in Surrey
In Surrey, the most prevalent long-term conditions are diabetes, hypertension, and cardiovascular disease (CVD) and 24.7% of residents have a long-term health problem or disability. This rate is higher than the England average (13.9%). It is estimated that depression rates are likely to be 2-3 times higher in people with a chronic physical condition, and this rate will increase even further for people living with more than one chronic condition.
In England, over 15 million people live with a long-term condition. At least 4 million of them will have a co-occurring mental health problem. People with chronic conditions report lower wellbeing scores, and those with asthma, cancer, diabetes, and high blood pressure are more likely to experience a range of mental health problems, such as anxiety, depression, and PTSD. The World Mental Health Survey found that people with a mental health condition are more likely also to have a physical health condition, which negatively impacts overall wellbeing and ultimately increases the risk of suicide. In Surrey, 67% of respondents to the Stigma Survey felt that stigma occurred because mental health was not considered as important as physical health. Its findings also suggested there is a need for health care providers, as well as others working across the system, to include mental health in conversations about physical health.
An ONS analysis from 2019 looked into the link between disability (as defined under the Equality Act 2010) This report found that average anxiety ratings are higher for disabled people at 4.27 out of 10, compared with 2.66 out of 10 for non-disabled people. Furthermore, disabled people reporting a mental impairment showed the poorest wellbeing, and disabilities affecting people more contributed to worse well-being ratings.
More than one-quarter of people attending primary care in England have unexplained chronic pain, irritable bowel syndrome, or chronic fatigue. These account for a fifth of GP consultations in the UK and are generally managed with limited psychological support, but outcomes are poor and healthcare costs are estimated to around £3 billion.
Multiple chronic conditions, or multimorbidity, pose challenges to the population and to NHS services. This has been acknowledged as a priority both locally and nationally and highlighted in the Health and Care White Paper (2021). For instance, 1 in 5 patients admitted to A&E has five or more chronic conditions, compared to 1 in 10 ten years ago. The ambition and recommendation are for more holistic, person centred, integrated care.
The number of people with chronic conditions, and the number of people with multiple conditions is rising. In England, 1 in 4 people have two or more conditions. This is even more prevalent in those from disadvantaged backgrounds or communities. Some conditions cluster together (co-morbid) but people can experience any number of combinations, sometimes without seeing a link between them. People with multiple chronic conditions have poorer health, poorer quality of life and higher risk of dying. Co-morbid physical and mental conditions are especially associated with poor outcomes.
Access to Healthcare
People with long-term conditions, like diabetes, cardiovascular disease, chronic pain or respiratory disease are also more likely to have co-morbid mental illness, like anxiety or depression. Sometimes referred to as multimorbidity, the presence of two or more physical or mental health conditions impacts quality of life, mental health and wellbeing, daily function, and often results in greater healthcare utilisation the more co-existing conditions people have. This can further be affected by disability or frailty, both which affect people’s ability to do daily tasks, as well as showing a strong association with poor mental health and depression. Multimorbidity is a big challenge facing the NHS, especially given England’s ageing population, with an estimated two-thirds of individuals aged 65 and over having 2 or more long-term conditions.
The combined impact of mental and physical health problems is complex. People who have both mental health problems and physical health conditions have 45% higher healthcare costs. 46% people with a mental health problem have a long-term condition and 30% of people with a long-term condition have a mental health problem. Co-morbid mental health problems can lead to increased hospitalisation rates, increased service use, and less effective self-management. For instance, people with poor mental health tend to have poorer treatment adherence or are less likely to look after their health. Furthermore, people with multiple long-term conditions face ‘diagnostic overshadowing’, which refers to a tendency, once a diagnosis is made, to attribute all other problems to that diagnosis, which in turn leaves other co-existing conditions (physical or mental) undiagnosed or undertreated. Although no data for Surrey, this has been described anecdotally by frontline staff as a key issue of concern.
Literature has shown there is an increased risk of subsequent development of chronic physical conditions, such as heart or cardiovascular disease, asthma, migraines and headaches and peptic ulcer for people with mental illness. The recent national programme CORE20PLUS5[JL1] suggests that people with an SMI should have a yearly physical health check. Across England, 55.4% of people on the mental health register had their blood pressure recorded in the last 12 months and 54% had their BMI recorded. In Surrey, in the second quarter of 2022-23, the target of 8413 physical health checks for people living with an SMI had been achieved, and Surrey Heartlands had the highest rates for physical health checks in the South East region. However, of 8413 checks conducted, only 5808 had checks for alcohol, 6179 for blood glucose, 6313 for blood pressure, 6156 for BMI and 6258 for smoking. Nationally, 54.9% of people with long-term conditions visiting their GP reported having enough support from services.
Several reviews found consistent evidence for an increased risk of suicidal ideation and suicidal attempts for people with chronic pain, medically unexplained symptoms or ‘somatic’ symptoms, as well as with the presence of certain long-term conditions.
Health Behaviours
Poor mental health can lead to increased rates of unhealthy behaviours, and the reverse: unhealthy behaviours can lead to poor mental health. For instance, unhealthy eating or lack of physical activity are correlated with increased rates of anxiety and depression.
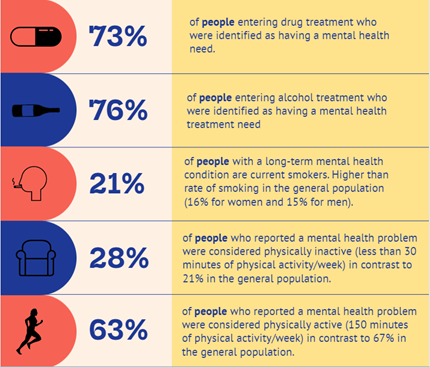
Figure 23. Summary Health Behaviours and Mental Health in Surrey
Substance Use
As with findings in previous survey years, for the year ending March 2020, the prevalence of any drug use in the last year was highest amongst 16 to 19 year olds and 20 to 24 year olds (21.1% and 21% respectively). The use of any drug in the last year also generally declined by age. For example, use in the oldest age category (55 to 59 years) was much lower than the youngest (16 to 19 years) at 2.8% compared with 21.1%[4]
Any drug use in the last year was also higher among men than women aged 16 to 59 years. One in eight men (11.9%) reported taking any drug in the last year compared with 6.9% of women.
There was a similar pattern by individual drug types for the year ending March 2020:
- 9.8% of men reported using cannabis in the last year compared with 5.7% of women.
- Men were nearly twice as likely than women to have taken powder cocaine in the last year (3.4% compared with 1.8%).
- 1.7% of men reported having taken ecstasy in the last year compared with 1.1% of women.
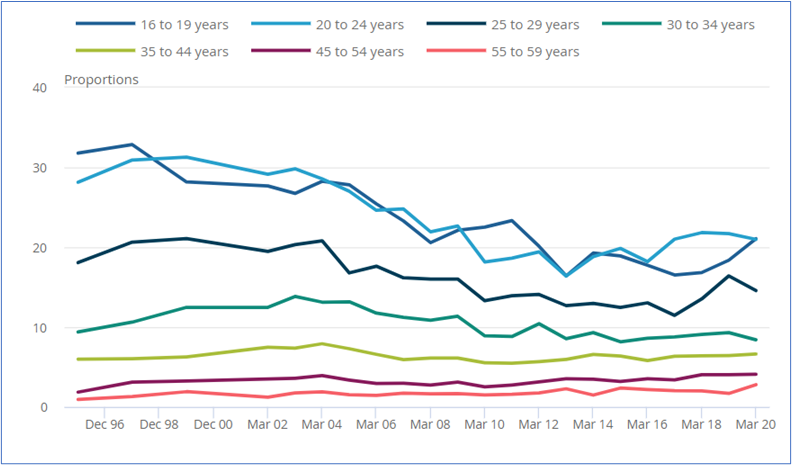
Figure 24. Proportion of Adults who reported using a drug in the last year by age
Hospital admissions due to alcohol
Overall, the local rate in Surrey for alcohol related (1544 per 100,000) and alcohol specific (520 per 100,000) hospital admissions is lower compared to England (1815 and 644 per 100,000 respectively), however, the trend for admissions for alcohol specific conditions is increasing and getting worse especially since 2018-19.
In terms of geographical and gender variation, the trend for alcohol related and alcohol specific admissions is increasing in Guildford. The trend for alcohol related admissions for males is showing an increasing trend, whereas for alcohol specific admissions the trend is seen in both males and females.
For substance use, the proportion of people entering drug treatment who were identified as having a mental health treatment need and were receiving treatment for their mental health was 72.8% (marginally better than England 71%). However, the proportion of people entering alcohol treatment who were identified as having a mental health treatment need and who were receiving treatment for their mental health was 75.9%, which was worse than the England average (80.4%), as well as the regional average (81.5%).
In the Coroner’s report on Death by Suicide in Surrey (2021) one in five were recorded to have a disability. Individuals who died by suicide had many complex needs. 57% acknowledged either alcohol or substance use before death. This largely covers individuals who had a combination of long-established alcohol use and/or drug misuse. However, only 3% of the individuals who died by suicide were in contact with specialist substance misuse service prior to death, 1% in the previous 3 months, 3% in the last 12 months and 3% over 24 months.
Gambling
Gambling covers a large range of activities, including betting shops (usually with a focus on sports betting) casinos, bingo halls, adult gaming centres with electronic gaming machines, slot machines and online gambling versions of many of these. The Patterns of Play report on Online Gaming, carried out by the National Centre for Research, shows that whilst betting (primarily on sports such as football and horse racing) was most popular in terms of numbers participating, online gaming was associated with a higher probability of incurring heavy losses, and, of those who spent the most money, a higher proportion had addresses in the most deprived neighbourhoods.
Gambling disorder – also known as problem gambling or gambling addiction – is a repeated pattern of gambling behaviour where someone feels they have lost control, continues to gamble despite negative consequences and sees gambling as more important to them than any other interest or activity. Australian community prevalence studies showed that of all gambling activities, Electronic Gaming Machines do appear to have the strongest association with problem gambling.
Research by the University of Oxford[5] examined the association between gambling as a proportion of monthly income and 31 financial, social and health outcomes using anonymous data provided by a UK retail bank, aggregated for up to 6.5 million individuals over up to 7 years. Findings highlighted the impact of gambling on individuals’ health and quality of life. There was a statistically significant correlation between gambling and declining health, opportunity and quality of life outcomes – with harm rapidly escalating at higher levels of gambling spend. Gambling is associated with higher financial distress and lower financial inclusion and planning, and with negative lifestyle, health, well-being and leisure outcomes. Gambling is also associated with higher rates of future unemployment and physical disability and, at the highest levels, with substantially increased mortality.
According to the Royal College of Psychiatrists[6], problem gamblers are more likely than others to suffer from low self-esteem, develop stress-related disorders, to become anxious, have poor sleep and appetite, to develop a substance misuse problem and to suffer from depression. There is also an association between gambling and suicide. People experiencing gambling-related harms are a risk group for the experience of suicidal thoughts, attempts and death by suicide.
Public Health England evidence-based review of gambling related harm (2019) estimated that ‘problem’ gambling rates vary between 0.5% and 0.9%, with between 5-6% of people considered ‘at risk’ (this does not include all those experiencing harm). According to the Royal College of Psychiatrists, roughly 1 in every 100 people have a gambling disorder. A further 4 to 7 people in every 100 gamble at risky levels that can become a problem in the future.
Table 15, below, shows the number of licensed betting/gambling facilities in Surrey by District & Boroughs.
Licenced Betting/Gambling Facilities is Surrey
| Area | Adult Gaming Centre | Betting Shop | Bingo | Family Entertainment Centre | Grand Total |
| Elmbridge Borough Council | 10 | 10 | |||
| Epsom and Ewell Borough Council | 8 | 1 | 9 | ||
| Guildford Borough Council | 8 | 8 | |||
| Mole Valley District Council | 4 | 4 | |||
| Reigate and Banstead Borough Council | 1 | 11 | 12 | ||
| Runnymede Borough Council | 9 | 1 | 10 | ||
| Spelthorne Borough Council | 1 | 13 | 14 | ||
| Surrey Heath Borough Council | 11 | 11 | |||
| Tandridge District Council | 2 | 6 | 8 | ||
| Waverley Borough Council | 8 | 8 | |||
| Woking Borough Council | 1 | 11 | 1 | 13 | |
| Grand Total | 5 | 99 | 2 | 1 | 107 |
Table 15. Source Gambling Commission, Register of gambling businesses
Spelthorne, Woking, Reigate and Banstead and Surrey Heath have the highest number of licensed betting premises (in descending order). These correspond with the local councils that have ‘Key Neighbourhoods’ with the highest Index of Multiple Deprivation scores in Surrey.
The local councils with the highest number of licensed betting premises do not correspond that closely to District & Boroughs with the largest populations, which are in descending order: Guildford, Reigate and Banstead, Elmbridge, Waverley, Woking, Spelthorne, Runnymede Surrey Heath.
Gamcare has provided data via interactive maps showing prevalence of gambling harms and usage and demand of treatment in different parts of the UK. There are plans being developed in Surrey to further understand the level of need and implement a plan which:
- Publicise the online and in person training around understanding, recognising and responding to problem gambling (report from Royal Society of Public Health and Gamcare), to front line staff (e.g. primary care, adult social care, substance use and domestic abuse services, community development and liaison officers).
- Publicise services and sources of support for problem gambling to the public, especially those at greater risk (e.g. via targeted campaigns and social media messaging).
- Investigate and implement evidence-based interventions to help reduce the stigma around problem gambling.
- Work with relevant partners to develop a strategic approach/ strategy for reducing problem related gambling.
Prevalence of Gambling Harms and usage in Surrey
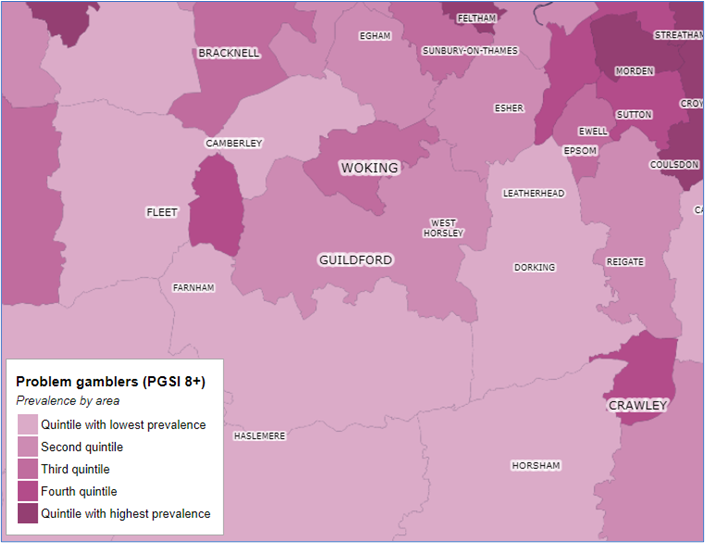
Figure 25. Source: Be Gamble Aware GambleAware GB Maps
Demand for Gambling treatment or support in Surrey
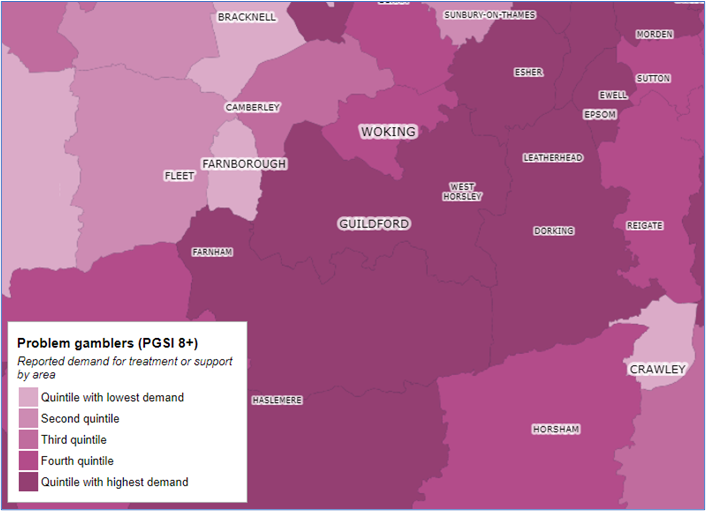
Figure 26. Source: Be Gamble Aware GambleAware GB Maps
Online gambling is another major source of gambling for which it is hard to gather data, especially at a more local level. However, findings of a national study of online gambling (‘Patterns of Play’ (2022) by Liverpool University for GambleAware) has provided rich information that highlights the inequalities.
There is a growing body of evidence showing that harms from gambling are falling disproportionately on the most deprived communities. A study by the University of Liverpool and the National Centre for Social Research found that gambling firms make the vast majority (at least 70%) of their money from the 5% of individual accounts that have the biggest losses.
Gamblers from the poorest areas were more likely to lose money in online casinos, with a risk of high intensity play; and are more likely to have lost their money using virtual slot machines, a type of Electric Gaming Machine (EGM) with a high rate of addiction. Research has demonstrated that the harms associated with EGMs are significantly linked to social inequality, being disproportionately concentrated in low socioeconomic areas. Individuals who are unemployed, with lower incomes and living in rental accommodation are more likely to experience harm from these machines.
Harm rapidly escalates at higher levels of gambling spend. Recent research published in Nature Human Behaviour tracked the habits of 6.5 million Lloyds Banking Group customers over 7 years. Key insights include:
Levels of harm were “notably stronger” once someone exceeded 3.6% monthly outgoings on gambling (£91.37 for the average household). Those who exceeded that threshold were:
- 33% more likely to miss a mortgage payment
- 22% more likely to use an unplanned overdraft
- 19% more likely to take a payday loan.
At the highest levels of harm – exceeding 10% of monthly spend – individuals were twice as likely to miss a mortgage payment compared to a non-gambler.
Sleep
A restful sleep is critical to positive health outcomes. There is no definition for what constitutes ‘normal’ sleep, the amount of sleep needed varies between people and with age. Usually, insomnia means difficulty getting to sleep, difficulty staying asleep, early wakening, nonrestorative sleep which results in impaired daytime functioning (such as poor concentration, mood disturbance and fatigue). Insomnia can be short-term (less than 3 months), or chronic (longer than 3 months). Chronic insomnia is often co-morbid with other physical or mental health conditions. Insomnia can sometimes be caused by other sleep disorders (such as obstructive sleep apnoea or parasomnias) – these are usually considered and treated as appropriate first when assessing someone presenting with insomnia. Good sleep hygiene is important for everyone. It can prevent sleep problems, or for people who experience sleep problems, it can help on its own or in conjunction with other treatments.
Research estimates that around a third of adults in Western countries experience sleep problems, and 6-10% meet the criteria for insomnia disorder. This is more common in females compared to males, and more common in older adults. Around half of all people with insomnia have a co-morbid psychiatric disorder. A review on intervention to prevent mental ill health found that there was strong evidence to support the effectiveness of interventions to manage insomnia, in particular sleep education (including information about sleep hygiene) and cognitive behavioural therapy for insomnia (CBT-I).
More recently, emerging evidence supports the importance of circadian rhythms in achieving good sleep, as well as the links between circadian rhythms, sleep, physical factors, such as hunger or physical activity, and the onset of illness. Sleep and circadian rhythms are closely linked, and evidence supports the link between disruptions in sleep and circadian rhythms and health problems such as infertility, cancer, immune problems, psychiatric conditions, cardiovascular disease, and metabolic syndrome.
In Surrey, in 2021-22, 3,886 people attended the sleep clinics at either Ashford and St. Peter’s or the Royal Surrey County Hospital. Soft intelligence suggests many people in Surrey, particularly with long-term conditions, have sleep problems, and more work needs to be done to reinforce sleep hygiene guidance and raise awareness of existing support, such as the platform Silvercloud, available via self-referral through IAPT.
8. Services
| Service | Threshold | Summary | Waiting Times |
| Primary Care GPHIMS | TBC | TBC | TBC |
| IAPT | IAPT services offer a range of NICE-recommended therapies for depression and anxiety disorders in line with a stepped-care model. Low-intensity interventions (guided self-help, computerised CBT and group-based physical activity programmes) | There are a range of IAPT providers in Surrey. People can self-refer to the service | England Target – 75% access services within 6 weeks, and 95% within 18 weeks. These are based on the waiting time between the referral date and the first attended treatment appointment. Surrey is meeting this target. |
| Adults Community Connections | Anyone who is experiencing poor mental health. They do not need to be engaged with mental health services. | There are three main Community Connection providers in Surrey. | No waiting times. |
| Perinatal mental health services | Anyone eligible for perinatal referrals from healthcare professional. | Support for women and their families | 48 hours for urgent referrals and 28 days for routine referrals. All referrals have initial video or telephone contact offered usually within 1-2 days of referral being received. |
| Safe Havens | Anyone in metal health crisis or their carer. They do not need to be engaged with a mental health service. | There are five Safe Havens that cover the Surrey County Area. | No waiting times. |
| SABP Adult Services | Specialised services that offer emergency response and planned treatment for individuals with more severe or complex symptoms. | Referral from GP. | New referrals need to be seen within 28 days of the referral being opened. |
Table 16. Surrey services
Prevention
The evidence base for development of prevention interventions has been summarised in Appendix 3. Mental Health Public Health Prevention interventions across the life course.
The Prevention Concordat for Better Mental Health Programme aims to facilitate local and national action around preventing mental health problems and promoting good mental health. It includes a series of actions for local authority and healthcare systems to embed prevention approaches. What a Prevention Concordat for Better Mental Health video here.
The communities in which people live and work have a significant impact on wellbeing.
Figure 27 below, illustrates the Surrey Model for Community offers at scale: Targeted action with key neighbourhoods. This includes partnership with Surrey County Council, Empowering Thriving Communities, Community Link Officers, Districts and Boroughs, and providers.
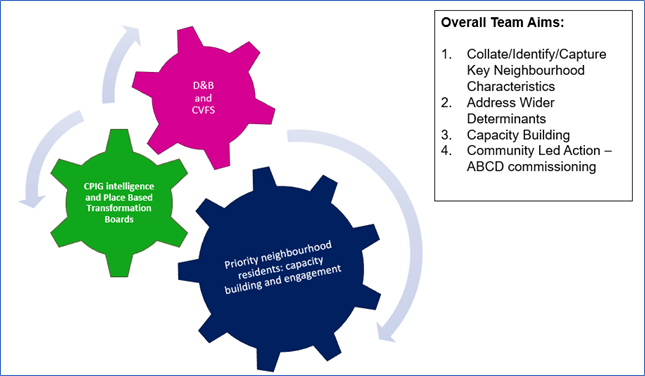
Figure 27. Surrey Model for community offers at scale
The community led offer being phased in two key neighbourhoods in Surrey is strategically linked into the multi-disciplinary response to address holistic needs of residents (i.e. community safety and stable housing). Insights from the neighbourhoods are also communicated with local transformation boards to inform user led planning.
The Surrey Workplace Wellbeing Programme, ‘How are you Surrey?’, is aligned to NICE guidance and Public Health Guidance for improving wellbeing. An offer has been developed for large business (including health and social care and education, aligned with the Healthy Schools Programme) and micro businesses (those with less than 10 employees). Support will be targeted to workplaces of residents in key neighbourhoods. Minimum standards include wellbeing training and cardiovascular screening and suicide prevention safety planning.
Early Intervention
Early Intervention
A survey was conducted with residents in key neighbourhoods to understand what they would like from the front door(s) of emotional and mental wellbeing support (November 2021). There were 193 respondents of the survey, 35% of which were in full time employment, 11% identified as white British. 83% reported financial challenges as an area which they required support, social connectivity and physical connectivity were also identified as key challenges. Respondents noted that a single point of contact which would be responsive to needs at that time and noted key deliverables from the first contact.
Key deliverables from the first contact
| Deliverables |
| To feel understood, to get suggestions for solutions. |
| To feel more in control and supported. |
| To feel listened to, to feel like somebody cares. |
| A plan going forwards and help accessing services. |
| People who care and who can make things happen. |
| Honest. Friendly. Sympathetic. |
| Gain confidence and self-esteem and to be able to socialise. |
| Empowered, supported, plan of action, resilience-building. |
Table 17. Source residence survey
Key themes from the Insight Survey (Nov 21) have been reviewed in a series of workshops and consultations with the Mental Health in Surrey. A single infrastructure to support one stop response, pathways back into community support and escalation as required is being developed across the system.
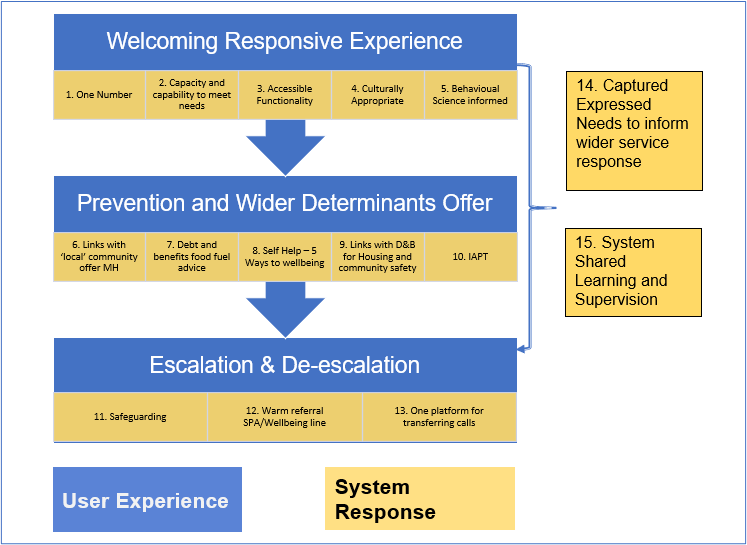
Figure 28. Model for Early Help – Emotional and Mental Wellbeing System
| Key Service Component |
| 1. One number Self-navigation Triage |
| 2. Capacity and Capability to meet needs No call waiting. Welcoming, non-judgmental response. Non-clinical offer needed. Sensible Lay offer to work through issues. Minimum level of training. Mental health promotion: risk and protective factors (Wheel of Wellbeing, Connect 5). Mental health awareness/Mental Health First Aid (types of MH problems, signs/symptoms, dealing with someone in distress). Suicide Risk Awareness (e.g. Safetalk). Overview of Surrey’s mental health/wellbeing and related services (NHS, ASC, VCSE’s). Trauma Informed Care. MECC. Minimum capacity of service. Diverse Recruitment. Competent triage. |
| 3. Accessible functionality Webchat and SMS (hearing impaired)Referral/Link with Surrey Virtual Wellbeing Hub Referral/Link with STAMP App |
| 4. Culturally Appropriate Culture and Faith awareness training for call receivers Coproduction: Together Culture – engagement residents in priority geographies |
| 5. Behavioural Science informed Applied COM-B and Self-Regulation to Work through issues and get to the right support |
| 6. Links with ‘local’ community Mental health offer Place based offer. Locally connected Referrals into community hubs for all contacts |
| 7. Self-help – 5 ways to wellbeing |
| 8. Debt and Benefits food fuel advice |
| 9. Links with D&B for housing and community safety Clear flag of community lead to escalate local issues through appropriate infrastructure i.e. community safety partnership |
| 10. IAPT Triage and referral into IAPT |
| 11. Safeguarding |
| 12. Warm referral SPA/Wellbeing line Not duplicate or replicate work in crisis area.Upward escalation |
| 13. One platform for transferring calls Work as a system towards seamless movement through the system (5 providers)NHS 111: respond to ambitions NHS Long Term Plan embed 2023/24 (999,111, ???) |
| 14. Captured expressed needs to inform wider service/policy development Gather insights on what the prevention and resilience offer is needed. Pathways: Capturing referral pathways/ escalation/ pathway follow up. Shared learning – providers network share. |
| 15. System shared learning and supervision Culture of continuous learning/sharing good practice/shadowing opportunities/network relationships understanding organisations (can’t get relationship with 26 PCNS, need to have clear structure/layers) |
Table 18. Core components identified as required for front end service
The development and launch of Public Living Rooms and the Camerados movement
Camerados is a social movement – focused on the principle that having ‘people and purpose’ is key to a happy, healthy and fulfilled life. Anyone (and everyone!) can become a Camerado if they agree to live the values and support their fellow community members. This is not a formal volunteer role with a set of prescriptive criteria, it is an identity that anyone can take on.
Camerados believe that the simple act of being more human by ‘looking out for each other’ can be transformative, especially when people are experiencing tough times. Most importantly when you are a Camerado to others, not only do you make others feel better, but you feel better too, it gives a feeling of more human connection, which in turn leads to resilience. If everyone behaved as a Camerado then more people would have the skills to help each other through challenges better and less need for traditional services.
The Camerados philosophy has been adopted in Surrey to support residents in accessing early help and support. Led by VCSE partners and involving partners from across the system, Camerados starter kits have been ordered and a relationship built with the national Camerados team. A working group is being set up to rollout the concept of ‘Public living Rooms’. Public living rooms are agenda-free spaces for communities to come together, share their strengths and look out for each other.
Target outcomes:
- Surrey residents identify themselves as a Camerado and see helping each other as part of being a Surrey resident.
- Surrey residents are able to access ‘Public Living Rooms’ for social support, peer-support, peer-advocacy and problem solving.
- Loneliness and social isolation in Surrey is reduced.
- Reduction in uptake of crisis support services, including A&E.
Universal Services
Adult Social Care Mental Health Team
The number of people currently open to an Adult Social Care Mental Health Team in Surrey as a service user, excluding under 18s is 3,280.
People open to an Adult Social Care Mental Health Team in Surrey as a service user, excluding unknown addresses and under 18s
| Area | % of Adult MH caseload | Rate per 100,000 Population of D&B 18+ |
| Elmbridge | 9.06% | 279.2 |
| Epsom and Ewell | 5.61% | 294.2 |
| Guildford | 11.59% | 323.6 |
| Mole Valley | 5.98% | 277.8 |
| Reigate and Banstead | 13.57% | 374.6 |
| Runnymede | 6.13% | 282.5 |
| Spelthorne | 7.14% | 287.3 |
| Surrey Heath | 7.84% | 356.0 |
| Tandridge | 4.48% | 212.6 |
| Waverley | 9.73% | 314.7 |
| Woking | 10.16% | 411.6 |
| Out of County | 7.44% | n/a |
| Not mappable | 2.04% | n/a |
Table 19. People open to ASC Mental Health Team Source: SCC ASC
Digital
This JSNA chapter for the first time includes this section on digital, recognising the ever increasing importance of digital in all that we do. As digital is now a part of many if not all services, the format of this section will be different to others, with an ambition to integrate it into individual sections in the longer term.
Current activity and services
There are a range of patient/ citizen facing digital services available which may be accessed in both a health and care setting, or in the home or another public place. This includes but is not limited to websites (such as Healthy Surrey), applications (including the national NHS app itself), online forums (such as those supporting children and young people), remote monitoring technologies (such as assisting those with dementia) and clinical services (such as an online IAPT offer).
Suicide prevention browser extension
The Ripple tool is a browser extension that provides mental health resources to people who are searching for harmful online content relating to self-harm or suicide on the Google, Bing, DuckDuckGo and Ask.com search engines.
The tool is available to be installed by an individual or integrated on mass within an organisation to provide an additional layer of mental health support for their people. The tool pops up over the search results when a search for a harmful keyword or phrase is conducted.
Social action supported by digital Solutions
Woking Transformation partnership is trailing Tribe, which is a new digital platform to connect people needing support to caring individuals in the community and makes it easy to find local groups and activities.
The pilot of Tribe in Sheerwater and Goldsworth Park is being supported by the North West Surrey Health and Care Alliance. Download the app or visit the Tribe communities webpage to start searching for:
- health and fitness activities
- sports clubs
- support groups
- parent and toddler groups
- community hubs and advice centres
- youth services
- community events
In this context, digital provides both an alternative channel to those who want to use it, can complement other methods of health and care delivery and importantly in the context of this JSNA, deliver information in a meaningful, interactive and sometimes bespoke or targeted way, to support the prevention agenda.
Future Needs
A number of groups who may have difficulty accessing digital services for a variety of reasons. The following principles and approaches aim to ensure digital does not widen health inequalities by providing inequitable services:
Accessible and inclusive – ensuring that digital services are in line with national standards and best practice including providing alternative options.
Alternative languages and culture – ensuring that all in our community are able to benefit.
Awareness – of what digital products are available and how to navigate those which will best support you (note, these will vary between different localities and organisations).
Confidence – being comfortable using digital, that your data is safe, and that you continue to receive the health and care you need.
Channels – the opportunity to understand the optimum balance of digital vs in person interactions.
Choice – The use of digital insights to provide a more personalised and bespoke experience for individuals, for example understand waiting times to inform a preferred pathway.
Digital Literacy – Health Education England define this as “those capabilities that fit someone for living, learning, working, participating and thriving in a digital society”.
Digital Poverty – There is a risk to widening social inequalities where the means for not having access to the technology needed to engage with digital services. This is not exclusive to health care but could also have wider impacts such as access to information on housing, education or social welfare.
Embedding digital – change management, learning and adoption are all key to ensure digital is embedded into day-to-day practice.
Infrastructure – this may be both the technology available within health and care settings, which we know is not equal, alongside broader infrastructure such as availability of broadband. In the current climate we also need to consider the impact of power outages.
Online Safety – ensuring that patients and citizens are supported with navigating digital, both from a cybersecurity perspective but also to consider the digital risk of harm through social media for example.
Digital Workforce
While the above is related to our patients and citizens, it is imperative to consider the digital workforce needs both for digital professionals leading strategy and delivery of the digital agenda alongside our wider health and care workforce with their digital needs.
All challenges above can be applied to staff too, which need to be inclusive of our voluntary, community, social enterprise and faith sector colleagues – for example having legacy technology, structures or skills. Digital needs to make things easier for our staff, while informing clinical care and decision making – for example through shared care record capabilities. Our staff also need appropriate day to day digital support, both with any daily troubleshooting but also to adopt new technologies to support their clinical practice. The impact of digital (whether positive or negative) on health and care professionals can massively impact the experience of a patient/ citizen so investment in high quality, well designed, safe and effective digital is paramount.
Beyond direct care provision in the context of rising demand and awareness of mental health, we may want to consider in this area include the use of data and insight to make operational and commissioning decisions, and the strategic development of digital transformation programmes that ensure adherence to digital ethics and privacy. A digital professional workforce is therefore another strategic need, across the Health & Wellbeing footprint, to ensure these needs are met.
Local Insights
Surrey County Council is currently developing a digital mental health community of practice, but we are already aware of a range of groups we can, and do, engage with. Staff insights include information collated via service desks, strategic relationships, surveys engagement on projects, and clinical design authorities. Patient/ citizen forums include collaboration with VCSE partners, working with Healthwatch Surrey and other patient groups alongside specific engagement or co-design sessions for individual products. There is a need to strengthen collaboration across the system in this space, including through the Strategy.
Social Prescribing
Social prescribing is part of the NHS long-term plan. It is one of the six components of Personalised Care and one of the 10 High Impact Actions for primary care. It has been funded through the primary care network Contract Directed Enhanced Service (DES) since 2019 under the Additional Roles Reimbursement Scheme (ARRS). NHS funding will continue to 2024. In Surrey, social prescribing receives additional funding through the Better Care Fund (BCF).
Social prescribing addresses health inequalities and the wider determinants of health by supporting people with their non-clinical needs and by connecting them to sources of help and support within local communities. It takes a holistic ‘whole-person’ approach to health and social care asking, ‘what matters to you?’ to create a shared plan to support people to take control of their health and wellbeing. It can especially help people who:
- have one or more long-term condition
- need support with their mental health
- are lonely or isolated
- have complex social needs which affect their wellbeing
People can be referred to a social prescribing link worker by a GP, health or social care professional and through a range of other agencies.
Surrey’s social prescribing services are provided by District and Borough councils, Central Surrey Voluntary Action (CSVA), and Voluntary Action Southwest Surrey (VASWS). These providers employ both DES and BCF funded link workers and have been commissioned by both PCNs and ASC commissioners to provide social prescribing services to any adult over the age of 18 who is registered with a GP.
| Place | Number of social prescribers | Employer |
| Guildford and Waverley | 10 | VASWS |
| Surrey Downs | 15 | Mix of borough, PCN, and Better Care Fund |
| Northwest | 20 | Mix of borough, PCN, and Better Care Fund |
| East Surrey | 13 | Tandridge District Council and North Tandridge PCN |
| TOTAL | 58 |
Table 20. Surrey Heartlands’ social prescriber’s workforce numbers
According to available data, the top 4 reasons for referral in the first quarters of 2021/22 and in 2020/21 were:
- ow level mental health and wellbeing support
- emotional support
- opportunities for social interaction
- social isolation and loneliness
Again, according to available data, the services that received most onward referrals from social prescribing in the first quarter of 2021/22 were:
- Citizens Advice
- Community mental health services
- Community centres
In terms of impact and outcomes, gaps in data collection impact on evaluation measures for social prescribing. No common outcomes framework has been agreed for Surrey and more than 6 different wellbeing measures are used currently by social prescribing services across Surrey.
In June 2020 NHS England published the outcomes and outputs that should be measured to show the impacts of social prescribing. Surrey’s outcomes framework must reflect place-based population needs and priorities, and should cover 3 key areas:
- Impact on the person
- Impact on community groups
- Impact on the health and care system
To determine the full impact of social prescribing for people, places and systems, meaningful outcomes as a measure of social prescribing will need to be coproduced with all stakeholders, including service users and the VCFS.
Evaluation of the Wellbeing Prescription Service in Tandridge DC shows a significant reduction in GP visits and improved personal wellbeing. The use of the social prescribing software Elemental has greatly enhanced the ability of the Wellbeing Prescription Service to measure its impact on systems and its use of the holistic wellbeing tool MYCaW® has supported its evaluation of meaningful change for people. In other social prescribing services evidence is largely anecdotal, and outcomes are difficult to measure, or they are recorded sporadically.
Social prescribing is now included on the Footfall digital platform, which means information about social prescribing is available to people when they visit the Wellbeing Centre on GP surgery websites. This is in addition to the information accessible via the social prescribing pages on the Healthy Surrey website, which include: a guide to social prescribing, links to local social prescribing services, a ‘Day in the Life’ blog post from one of Surrey’s Social Prescribing Link Workers (SPLWs), and a series of short films about social prescribing (with the permission of the Healthy London Partnership). Social prescribing services are also listed on Surrey Information Point (SIP).
COVID-19 has slowed down the integration of SPLWs into primary care multi-disciplinary teams and delayed social prescribing services from establishing a physical presence in GP surgeries. Accommodating SPLWs in GP surgeries, where they can build relationships with clinicians and other primary care staff, is key to creating an integrated and mature social prescribing system.
Green Social Prescribing
Surrey Heartlands is one of 7 national test and learn sites for Green Social Prescribing in England. The programme connects people to the health benefits of nature to improve mental health outcomes and address health inequalities. It has been running since April 2021 and is funded for 2 years, supported by a cross-governmental partnership.
The test and learn site has enhanced nature-based health and wellbeing provision in local communities through its Nature Connection Fund and supported referral pathways and self-referral for people with mental health need into green activities. Activities include wild swimming, nature walks, woodland skills, nature-based mindfulness, Forest Bathing, and gardening.
The Surrey Heartlands test & learn site has a particular focus on people with mental health conditions, those living with dementia or caring for someone, people with learning disabilities, and those from Black, Asian or ethnic minority backgrounds. Initial conclusions from the national evaluation of the test & learn sites suggest that nature-based health and wellbeing provision is particularly accessible to men, to people from minority ethnic groups, and to people from deprived backgrounds. There also appears to be an improvement in mental wellbeing on a group level (based on ONS4 scores) amongst people accessing green social prescribing.
The test & learn site will continue to;
Making it easy for people to find nature-based opportunities: Working together with partners from health, district and borough councils, voluntary, community and faith sector organisations, green sector providers and residents themselves, we will continue to uncover the green opportunities already available in Surrey. We will ensure they are easy to find so everyone is able to easily access the opportunities already available and use these to improve their health and wellbeing in the natural environment.
Developing new nature-based initiatives, including digital, that are accessible to everyone: We will work with local people and partners to design and deliver new opportunities to help people look after their health and wellbeing in the natural environment. This will include supported conservation volunteering pathways and virtual nature opportunities for people who struggle to access green space. In this way we hope to increase the culturally relevant and accessible green opportunities in Surrey and help the green sector become a more accessible place for our diverse population.
Ensuring the nature-based opportunities in Surrey are high quality: Together we will develop a quality standard for green social prescribing, so that we recognise good practice in Surrey. By continuing to capture data and stories we will build on the growing evidence base for the transformative impact of nature on health and wellbeing, especially for those who experience inequality.
The green social prescribing programme will continue to work with partners and stakeholders to ensure that Surrey’s health and care staff are given access to quality green space and nature connection to improve wellbeing and support the resilience of the local workforce. The programme will also encourage synergy between environmental policies, the sustainability goals for the NHS and local authority, and the delivery of health outcomes. The Thriving with Nature fund has been launched to support community-led, nature-based health initiatives in green social prescribing target communities.
Improving Access to Psychological Therapies
Improving Access to Psychological Therapies
In Surrey, 2021/22 there were 29,055 referrals to Improving Access to Psychological Therapies (IAPT) with 21,235 commencing treatment. In 2021/22, there were 34,977 referrals (either self-referrals or GP referrals) to IAPT, with 20,297 people completing treatment. There are gaps in the availability of data to understand those who utilised and completed IAPT services in Surrey.
In England in 2021-22, there were 1.81 million referrals to talking therapies (up 24.5% from 1.46 million in 2020-21). 91.1% accessed IAPT services within 6 weeks. The IAPT referrals’ quarterly rate was 953 per 100,00 population. There is no data available to consider ethnic variation, however research found that people from ethnic minorities were significantly less likely to access IAPT (Harwood et al., 2021). For those entering IAPT nationally it is estimated that 18.3% have depression or anxiety. The rate of completion of IAPT treatment nationally (quarterly) is 356 per 100,000 population.
The success for completion target is that 75% of people referred to the IAPT programme begin treatment within 6 weeks, and 95% begin treatment within 18 weeks. There is also a target for 50% or more to ‘move to recovery’. In Surrey, for 2022 to date, the rate of people referred into the programme within 6 weeks was 95.9%, and the rate of people being referred within 18 weeks was 99.9%. The recovery rate was 47.1% (based on data up to October), and the reliable improvement rate was 54.2% (the target is 62%). 10.8% dropped out of treatment before completion. When exploring data at CCG level, the highest number of referrals in 2021 was in NW Surrey CCG (10,858), with the highest rate being in East Surrey CCG.
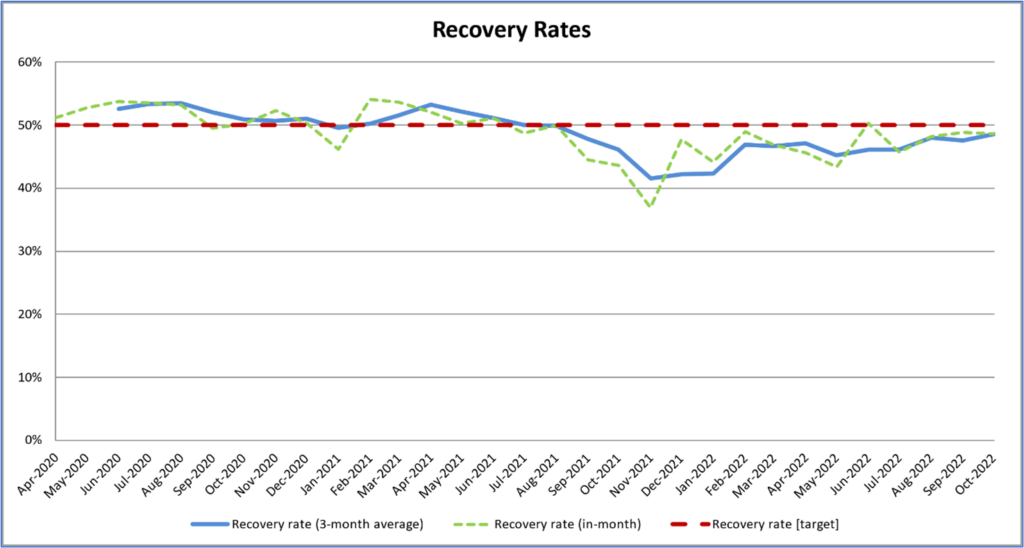
Figure 29. Recover Rates Following use of Surrey IAPT and receiver Target. Source: ICB Surrey Heartlands, All Surrey IAPT providers
In 2021/22:
- 208 people with Autistic Spectrum Disorder entered treatment, and 153 completed treatment.
- 422 people diagnosed with Learning Disabilities entered treatment, and 1037 completed treatment. Data to date for 2022/23 shows a rate of about 70% completing treatment of those who started.
- 1530 women either pregnant or post-partum entered treatment, and 1252 completed treatment; 693 waited for more than 14 calendar days from referral to starting treatment.
- 246 armed forces veterans entered treatment, and 240 completed treatment; 75 waited longer than 14 calendar days between referral and commencing treatment
Secondary Care
Acute Mental Health Hospital Admissions
Acute and Emergency Admission data was obtained from Hospital Episodes Statistics (HES), provided by NHS Digital, for the year 2019/20. Data from April 2020 onwards was not used due to the potential impact of COVID-19 on the rate of hospital admissions. ICD-10 codes used to define cohorts of patients were obtained for 12 CMDs (Appendix-1). All data has been suppressed according to guidelines within the Hospital Episode Statistics (HES) analysis guide.
During the Financial Year (FY) 2019/20, for 12 common mental health conditions (Appendix-1), Epsom and Ewell had the highest rate of admissions per 100,000 population (266.7) and Runnymede had the lowest rate per 100,000 (139.8). Surrey had a higher rate of acute mental health hospital admissions for the 12 conditions when compared to the South East, however it is still lower than the England rate (192.3, 189.3 and 220.1 respectively).
The below graph shows the rate of acute hospital admissions with a diagnosis included in the 12 common mental health conditions (Appendix-1) per 100,000 population. Data is shown for England, South East and Surrey from FY 2017/18 through to FY 2019/20. In FY 2017/18 Surrey had the lowest rate of hospital admissions per 100,000 population among the three areas. However, in FY 2018/19 the rate increased above the South East value and stayed above the South East value in FY 2019/20. Across the time period shown, the England rate has decreased while the rates in Surrey and the South East have increased. The Surrey rate has increased at a faster rate than in the South East.
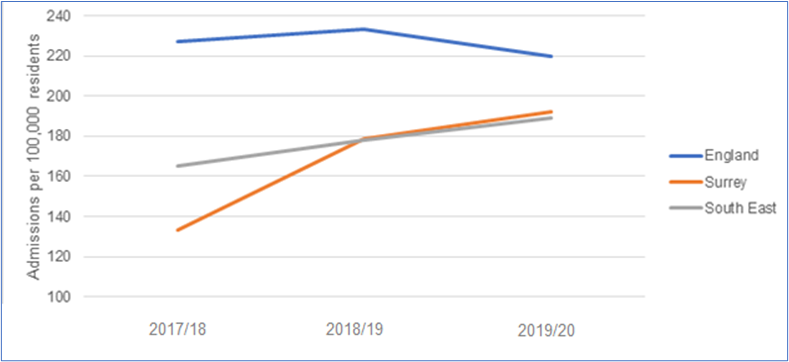
Figure 30. Emergency Hospital Admissions for Intentional Self-Harm 2020/21
Across Surrey in the period FY 2019/20, of the 12 listed mental health disorders shown in the Table 21 below, the highest rate of acute hospital admission was for alcohol use disorder (AUD) (45.6 per 100,00 population). This was followed by schizophrenia (35.5 per 100,000) and then depression (29.3 per 100,000). A similar trend can be seen across England with the most admissions being for AUD (69.7 per 100,000), followed by schizophrenia (34.7 PER 100,000) and then anxiety rather than depression (23.0 per 100,000).
Hospital Admission by condition per 100,000 population
| AUD | SUD | Schizophrenia | Bipolar | Depression | Anxiety | OCD | PTSD | ED | Personality disorder | Conduct disorder | Dementia | All | |
| England | 70 | 13 | 35 | 11 | 23 | 23 | 1 | 7 | 6 | 16 | 0.3 | 17 | 220 |
| South East | 53 | 8 | 31 | 12 | 24 | 20 | 1 | 5 | 7 | 14 | 0.3 | 13 | 189 |
| Surrey | 46 | 9 | 36 | 13 | 29 | 24 | 1 | 5 | 7 | 13 | * | 10 | 192 |
*Indicates low number suppression
Table 21. Hospital Admission by condition, Surrey, South East and England
The highest rate of acute hospital admissions for Neurosis are found in (descending order): Guildford (43.6 per 100,000), Epsom and Ewell (43.4 per 100,000) and Waverley (39.6 per 100,000). (see Appendix-2 for Neurosis cohort definition).
The highest rate of admissions for Substance Use Disorder (SUD) are found in (descending order): Reigate and Banstead (13.4 per 100,000), Epsom and Ewell (12.4 per 100,000) and Mole Valley (11.5 per 100,000).
The highest rate of admissions for personality disorder are found in (descending order): Mole Valley (22.9 per 100,000), Epsom and Ewell (18.6 per 100,000) and Reigate and Banstead (16.8 per 100,000).
Emergency Mental Health Hospital Admissions
All rates quoted in this section are for 2019-2020.
Surrey had a similar rate of emergency admissions for neurosis than England, with 32.2 and 32.8 emergency admissions per 100,000 population respectively. Within Surrey, Epsom and Ewell had the highest rate of emergency admissions for neurosis (43.4 per 100,000) followed by Guildford (40.3 per 100,000) and then Waverley (35.6 per 100,000).
Surrey had a higher rate of emergency admissions for schizophrenia than England, with 30.9 and 27.3 per 100,000 population respectively. Within Surrey, Guildford had the highest rate of emergency admissions for schizophrenia (40.3 per 100,000) followed by Tandridge (39.7 per 100,000) and Reigate and Banstead (37.0 per 100,000).
Surrey had a higher rate of emergency admissions for bipolar disorder than England, with 12.5 and 8.7 per 100,000 population respectively. Within Surrey, Woking had the highest rate of emergency admissions for bipolar disorder (19.8 per 100,000) followed by Waverley (19.8 per 100,000) and Mole Valley (17.2 per 100,000).
Detentions under the Mental Health Act
In 2021/22 445 individuals (225 Male, 220 Female) were detained under the Mental Health Act in Surrey Heartlands Sustainability and Transformation (STP) area, representing 42.3 per 1000,000 of the population. 270 of 445 were between 18 and 49 years old. In Frimley Care STP area 400 (205 Male, 195 Female) individuals were detained during the same time period, 53.6 per 100,000 population. 245 of 400 were between 18 and 49 years old Detentions under the Mental Health Act were lower across Surrey than nationally, with all STP areas having a detention rate of 90.4 per 100,000 population.
People open to an Adult Social Care Mental Health Team in Surrey with a s117* by , excluding unknown addresses and under 18s
| Area | Count of people on S117 open to a MH team | % of S117 caseload | Count of people open to a MH team | % of caseload |
| Elmbridge | 147 | 9.9% | 243 | 8.8% |
| Epsom and Ewell | 90 | 6.0% | 157 | 5.7% |
| Guildford | 166 | 11.1% | 327 | 11.8% |
| Mole Valley | 93 | 6.2% | 174 | 6.3% |
| Reigate and Banstead | 206 | 13.8% | 432 | 15.6% |
| Runnymede | 73 | 4.9% | 143 | 5.1% |
| Spelthorne | 111 | 7.4% | 242 | 8.7% |
| Surrey Heath | 92 | 6.2% | 206 | 7.4% |
| Tandridge | 61 | 4.1% | 106 | 3.8% |
| Waverley | 117 | 7.8% | 256 | 9.2% |
| Woking | 164 | 11.0% | 280 | 10.1% |
| Out of County | 172 | 11.5% | 211 | 7.6% |
| Grand Total | 1492 | 100% | 2777 | 100% |
Table 22. People open to ASC Mental Health Team Source: SCC ASC
* s177 – Some people who have been kept in hospital under the Mental Health Act can get free help and support after they leave hospital. The law that gives this right is Section 117 of the Mental Health Act.
Section 117 of the Mental Health Act says that aftercare services are services which are intended to:
- meet a need that arises from or relates to your mental health problem, and
- reduce the risk of your mental condition getting worse, and you having to go back to hospital
Section 136 Detentions
In the 2020/21 across the Surrey Police Force Area (PFA), there were 573 detentions under Section 136 of the Mental Health Act. This is a 30% increase in detentions in comparison to 2019/20. The number of detentions for males was slightly higher than that for females (295 and 271 respectively). Most detentions were of people with a white ethnic background (83%), this was followed by persons with an unknown or not stated ethnicity (11%).
393 out 573 (69%) persons detained were transported using an ambulance and 157 of 573 (27%) in a police vehicle. Of the 157 admissions in a police vehicle the most common reason for this was an ambulance was not requested/needed, followed by an ambulance not being available within 30 minutes.
The demand on police resources in terms of total hours and average times of s136 detentions has increased since 2019/20. This has continued to increase as per the diagram below.
Average Minutes per S136 detention
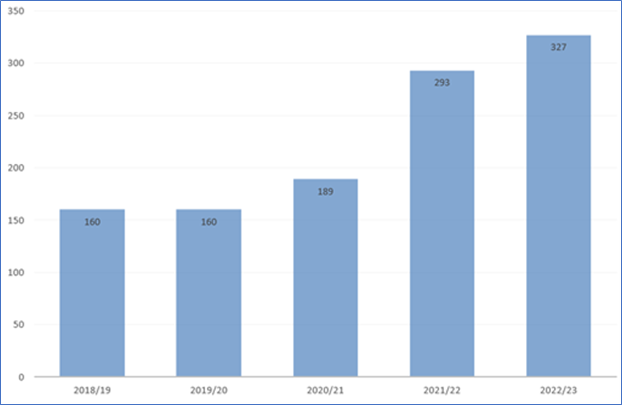
Figure 31. Average Minutes per S136 detention
The total number of hours spent by officers during Section 136 mental health detentions was 1194 during 2019/20. This increased to 1,805 hours during 2020/21. This increase in time with the police been attributed to challenges in the mental health system which in turn led to police wait times with a person detained increasing.
Emergency Admissions for Self-Harm
During the 2019/20 financial year, the rate of emergency hospital admissions because of intentional self-harm across Surrey was 168.1 per 100,000 residents, this is statistically significantly lower than the rate across both the South East and England (212.4 per 100,000 and 192.6 per 100,000 respectively). Guildford had the highest rate of admissions out of all Surrey local authorities (248.7 per 100,000) and Runnymede had the lowest rate (83.8 per 100,000).
The Table 23 below shows the rate of emergency hospital admissions due to intentional self-harm from the period 2010/11 to 2019/20 for Surrey, South East, and England. Comparing the financial year of 2010/11 with 2019/20, the rate of hospital admissions for intentional self-harm across England fell from 197.6 per 100,00 to 192.6 per 100,00, a decrease of 5 persons per 100,000. Across the same time-period in the South East, the rate increased from 184.8 per 100,00 to 212.4 per 100,000, an increase of 27.6 persons per 100,000. During the same time-period the rate across Surrey increased from 125.3 per 100,000 to 168.1 per 100,000, an increase of 42.8 per 100,000.
| 2010/11 | 2011/12 | 2012/13 | 2013/14 | 2014/15 | 2015/16 | 2016/17 | 2017/18 | 2018/19 | 2019/20 | |
| England | 197.6 | 197.2 | 189.6 | 205.9 | 193.2 | 196.5 | 185.3 | 185.5 | 196.0 | 192.6 |
| Surrey | 125.3 | 118.6 | 136.7 | 155.1 | 154.7 | 166.8 | 152.1 | 169.5 | 166.6 | 168.1 |
| South East | 184.8 | 185.0 | 182.2 | 204.8 | 192.3 | 211.8 | 197.2 | 195.0 | 199.7 | 212.4 |
Table 23. Emergency Admissions for Self-Harm 2021/11 – 2019/20
Emergency Hospital Admissions for Intentional Self-Harm 2020/21
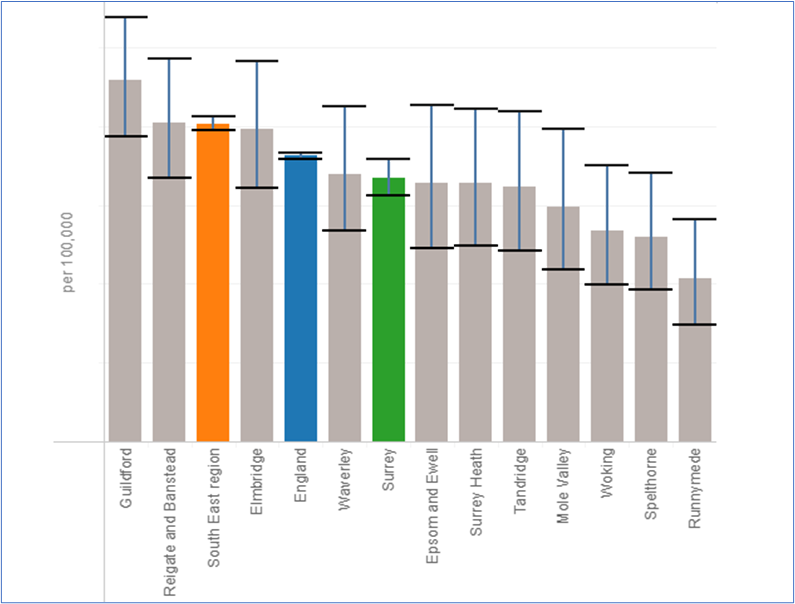
Figure 32. Emergency Hospital Admissions for Intentional Self-Harm 2020/21, All ages Source: JSNA Mental Health Published
Avoiding admission to mental health hospitals, and how discharges could be safely made more quickly
In Spring 2022, Surrey Coalition of Disabled People (The Coalition) was asked to undertake a research project to better understand:
- What support could help individuals, their families and carers to safely avoid an unnecessary admission to hospital for a mental health crisis?
- What support could enable people to get well more quickly and for admissions to be shorter?
- How discharge arrangements could be improved?
The research team identified five areas where improvements need to be made:
- What support helps to safely avoid an admission to hospital for a mental health crisis.
- How new mental health conditions can be managed better at home.
- How known mental health conditions can be managed better at home.
- What helps people get well more quickly and have shorter stays in hospital.
- How discharge arrangements could be improved.
The researchers found that participants valued a holistic and tailored approach to mental health care, particularly to help them avoid unnecessary admissions. There seems to be a difficulty in recognising mental ill-health and accessing early intervention due to logistical factors, such as waiting lists. Participants spoke about a lack of consistency in their care, and a lack of communication between services, individuals, and carers, which resulted in difficulties transitioning from an inpatient setting to the community and managing their mental health at home. There was a sense of feeling unprepared and uninformed about admission and discharge processes, with some participants mentioning feeling contained and isolated while inpatient and leaving hospital with more trauma than before.
Most of the project’s recommendations are included in this chapter’s Area 4 Recommendations.
Concurrent Contact Mental Health and Substance Use Services for alcohol use
ONS data from 2016/17 indicated 23% of service users in Surrey are utilising mental health and alcohol use services concurrently, which is a similar proportion to that observed nationally.
Concurrent contact with mental health services and substance misuse services
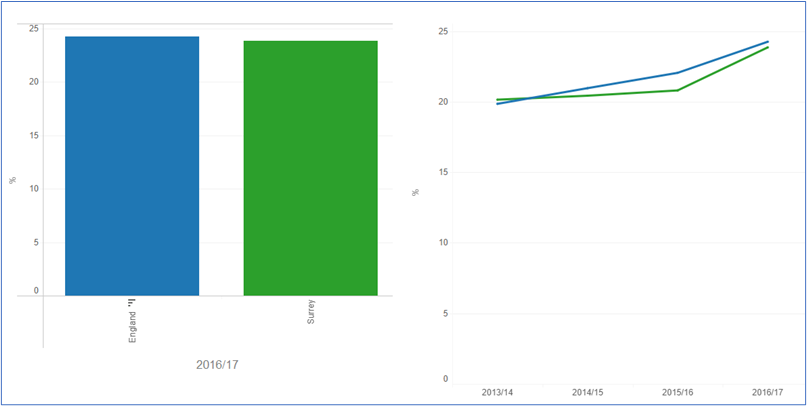
Figure 33. Concurrent Contact Mental Health and Substance Use Services for alcohol use 2016/17 Source: JSNA Mental Health Published
Multiple Disadvantage includes the experience of homelessness, harmful drug or alcohol use, poor mental and physical health, criminal justice involvement and the experience of domestic violence and abuse. Individuals experiencing overlapping disadvantages invariably experience health inequalities with a high prevalence of physical, mental and social care needs.
People facing severe and multiple disadvantage have often experienced underlying adverse childhood experiences, poverty, psychological trauma, stigma and discrimination. The experience of violence, trauma and abuse is common. The vast majority of women facing multiple disadvantage will have experienced substantial violence and sexual/domestic abuse in their past and this can place women at higher risk of self-harm and suicide and domestic homicide.
In Surrey, it is estimated that circa 500 people face problems of homelessness, substance misuse, mental health and entering the criminal justice system in any one year. Adults with severe multiple disadvantages will have at least 3 of the following difficulties: drug/alcohol misuse, domestic abuse (perpetrator or victim), offending behaviour, mental ill health, homelessness/ at risk of homelessness. They will be known to numerous services and have repeat behaviours that are difficult to manage. Some individuals also fall through the gaps between services and systems, or are unable to access services, making it harder for them to address their problems and lead fulfilling lives.
Factors supporting recovery
Addressing Stigma
Stigma may come directly from others and be direct (e.g. an unpleasant comment or behaviour), or a more subtle assumption or attitude (e.g. someone is not as capable as others). There is also self-stigma – when a person with a mental health diagnosis becomes aware of public stigma, agrees with those stereotypes and internalises them by applying them to themselves.
The effects of stigma and discrimination can be profound, they can lead to less social contact and more social isolation; prevent or delay people from seeking help (which can as a result lead to poorer outcomes and delay recovery); negatively affect mental health; can damage job prospects and stability; and in health settings can lead to a mental health diagnosis overshadowing a fuller exploration of the cause of patient’s symptoms.
Stigma and discrimination can therefore have substantial public health impact, creating and maintaining inequalities including poor access to mental and physical health care; reducing life expectancy; leading to exclusion from higher education and employment; increasing risk of contact with criminal justice systems and victimisation; and resulting in poverty and homelessness.
Stigma can vary between different mental health conditions and settings. The 2015 British Social Attitudes Survey showed that the public was more accepting of a person with depression than with schizophrenia. People were less willing to interact with someone with either depression or schizophrenia in more personal settings, such as marrying into the family or providing childcare. People who have personal experience of mental health problems, or who know someone close to them that has, express lower levels of prejudice.
A Survey of stigma and discrimination experienced by people with mental health issues in Surrey (November 2021), which had a sample of 130, found that in relation to what stigma looks like in Surrey:
- 76% negative attitudes or comments
- 47% difficulty accessing services
- 42% physical health not properly investigated
- 39% harassment or bullying
- 31% less tolerance for work sickness absence
- 27% reduced opportunities to advance career
- 18% unfair dismissal
Around 1 in 4 people will experience a mental health problem each year, yet many of them say the shame and silence can be as bad as the mental health problem itself (national Time to Change campaign). Nearly 9 out of 10 people with mental health problems say that stigma and discrimination have a negative effect on their lives. (Mental Health Foundation).
Although there has been a reduction in stigma and discrimination over the ten years plus period of the national Time to Change national programme started in 2008-21, Stigma against and discrimination towards against people with mental health needs is still a problem. (just to say Autistic, and other neurodivergent people also experience stigma and this and attempts to cope by masking difference is significant in their mental health)
The Surrey Mental Health Stigma Survey found:
- 72% had experienced stigma and/or discrimination.
- The most commonly experienced sources of stigma were from: 72% Family, 58% Friends, 58% Colleagues, 44% GP surgery, 40% Hospital, 36% Manager, 32% Community Mental Health services.
For more information, refer to the Surrey Stigma Survey Report (2021).
Employment
A review carried out in 2006 showed that work is good for a both a person’s mental and physical health. The employment rate of those in contact with secondary mental health services and on the Care Plan Approach, is lower in Surrey at 66.1 comparative to England at 71.1 (2020/21). Amongst Surrey’s CIPFA nearest neighbours it has the second highest percentage point gap in employment of those in contact with secondary mental health services and on the Care Plan Approach, and the overall employment rate (CIPFA range: 54.6 – 71.5) (2020/21).
People open to an Adult Social Care Mental Health Team in, excluding unknown addresses and under 18s, by Employment Status
| Area | Employed or volunteering | Unemployed | Unknown |
| Elmbridge | 6.8% | 57.4% | 35.9% |
| Epsom and Ewell | 7.3% | 62.7% | 30.0% |
| Guildford | 8.6% | 73.5% | 17.9% |
| Mole Valley | 8.3% | 56.0% | 35.7% |
| Reigate and Banstead | 4.0% | 65.2% | 30.9% |
| Runnymede | 9.4% | 55.3% | 35.2% |
| Spelthorne | 9.6% | 60.1% | 30.3% |
| Surrey Heath | 9.2% | 61.2% | 29.6% |
| Tandridge | 6.0% | 59.0% | 35.0% |
| Waverley | 11.4% | 64.2% | 24.4% |
| Woking | 7.6% | 65.9% | 26.6% |
| Out of County | 10.2% | 77.2% | 12.6% |
| Not mappable | 0.0% | 63.4% | 36.6% |
| Grand Total | 7.9% | 64.2% | 27.9% |
Table 24. People open to ASC Mental Health Team Source: SCC ASC
Care Planned Approach
Across England the proportion of people aged 18-69 on a Care Plan Approach in employment for the time period quarter two in 2019/20 was 9.1%. This is in an increase of 2.3% on the quarter four 2013/14 r value of 6.8%. Across England the proportion of people aged 18-69 on a Care Plan Approach in stable and appropriate accommodation for the time period quarter two in 2019/20 was 57.8%. This is a decrease of 1.6% on the quarter four 2013/14 value of 59.4%.
Wellbeing Interventions
Exercise and physical activity have long been reported to have a positive impact on mental health and are included in the NHS 5 steps to mental wellbeing. The percentage of physically active adults in Surrey across 2020/21 was 72.2%. This is a significantly greater proportion than in the South East (69.2%) and England (65.9%). Across Surrey local authorities, the percentage of physically active adults in 2020/21 ranged from 64.1% in Spelthorne to 78.3% in Waverley.
9. Recommendations for Policy Makers and Commissioners
Area 1: Population prevention. Tailor, develop and promote place-based population wellbeing approaches including the determinants of wellbeing.
| Area. 1. | Recommendation |
| 1.1 | Develop tailored population level plans at Place for primary, secondary and tertiary level interventions (including meeting the scale of needs of adverse experiences of residents by applying trauma informed approaches and consider widespread life events which require scaled interventions i.e. bereavement and relationship support). |
| 1.2 | Implement a data infrastructure to enable place-based analysis to inform planning, this should include in the first instance SMI and Common Mental Disorder data and key demographics including housing status. |
| 1.3 | Agree and embed a Prevention concordat type arrangement across the system including agreed roles of senior leaders and members. |
| 1.4 | Complete full gap analysis on interventions identified in the prevention matrix to ensure that all are considered across strategic intentions. |
| 1.5 | Continue to scale up Training collaborative offer including wheel of Wellbeing capacity building and tailored Six Steps to wellbeing interventions in priority neighbourhoods. |
| 1.6 | Continue to develop and implement Multi-disciplinary Team (MDT) approaches a hyper local level to respond to wider determinants identified in engagement programmes i.e. Safer communities, Stable Housing, Employment. |
| 1.7 | Implement the reducing Stigma programme with a prioritisation of key neighbourhoods, access to employment and long term condition management. |
| 1.8 | Roll out ‘How are you Surrey?’ Workplace Wellbeing Programme, prioritising key neighbourhoods; micro businesses, public servants and health and social care organisations with percentage uptake targets with key employers. Workplace standards are fully aligned with healthy schools and should be targeted to schools for ripple effect to reach families. |
| 1.9 | Apply Office of Health Improvement and Disparities (OHID) ‘Toolkit B – Civic Support to Communities’ to address inequalities in engagement and uptake. |
| 1.10 | All District & Boroughs and ICPs should have a local suicide prevention action plan and all commissioners and policy makers sign up to the Alison Todd Suicide Prevention Protocol. |
| 1.11 | All Place Based Boards should review this JSNA and consider in place-based planning. |
| 1.12 | This JSNA should be used to inform the Mental Health Investment Fund allocation and prioritisation. |
| 1.13 | Address the gap in availability of suitable housing for those utilising mental health services. This should be part of the programme of work following the Housing Summit held in Winter 22 in Surrey County Council. |
| 1.14 | Implement the NICE guidelines on health risks of cold homes, which include recognising those most at risk, ensuring all health and care providers are sufficiently trained in the health risks of cold homes and creating a single point of contact health and housing referral service. In the longer term, ICBs are encouraged to accept their role in improving housing, which will in turn improve health and wellbeing in all age groups and reduce inequalities. |
| 1.15 | Develop a programme for people with Long Term Conditions to improve access to Preventative and Early Emotional/Mental Wellbeing Support |
| 1.16 | Embed emotional wellbeing and access to IAPT into MECC and Physical Health Checks |
Context
Population prevention interventions realise their full impact on service utilisation across various timescales. Faster impact interventions will realise their effect on service utilisation over a short period of time, however all will be important to implement to have the population level impact required and prevent mental health from worsening in each sub-population (effecting expressed need/ presentation to services to various levels of intervention).
Time needed to deliver outcomes from different intervention types
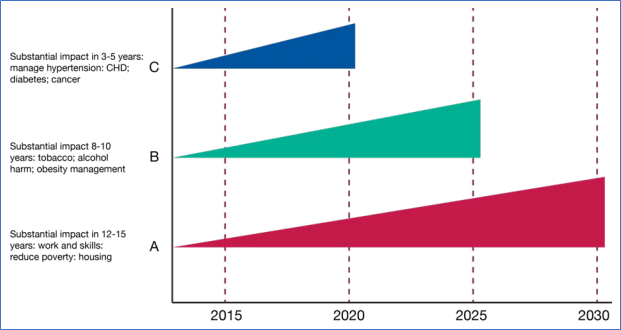
Figure 34. Source: PHE Reducing health inequalities: system, scale and sustainability
- The prolonged negative impact of COVID19 effects were seen deeper in areas of deprivation.
- It will be critical to apply understanding of variations in needs across communities and apply the principles of proportionate universalism in decision making to meeting the needs of the population.
- There is opportunity for Prevention interventions to be applied at scale for Surrey given the place-based infrastructures (ICPs, PCN and D&Bs), where data led principles of proportionate universalism can be applied.
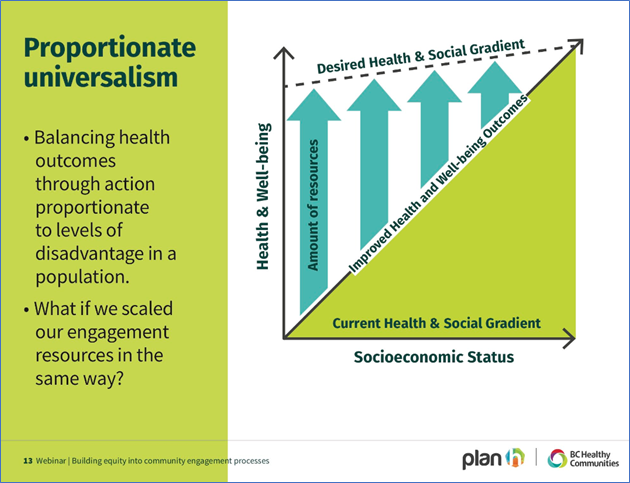
Figure 35. Source: BC Healthy Communities, Building Equity into Community Engagement Processes
Area 2: Communities. Utilise research and coproduction of wellbeing and mental health services with people with lived experience, residents (via community development) and VCSE sector provision
| Area. 2. | Recommendation |
| 2.1 | Apply Office of Health Improvement and Disparities (OHID) Toolkit C – “Service to community”, to ensure needs based, segmentation and coproduced planning at Place. |
| 2.2 | Further engagement for phasing in a full anti-stigma programme including mass communications campaign and workplace and community support interventions to reduce stigma. |
| 2.3 | Community programmes to be developed which: 1. Synthesise insights into where people’s natural communities are . 2. Provide needs led support in these areas. i.e. workplace health programmes, tailored wellbeing programmes. 3. Ensure inclusion of underserved communities and never seen communities, working with underserved communities and identified trusted community leaders to further engage the latter. 4. Have a clear partnership with VCSE sector’s existing provision and support to co-design service models which serve those currently unseen. 5. Provide support infrastructure for wider determinants’ needs to be met. 6. Have clear communications of insights into services to inform training needs. |
| 2.4 | Systematic consideration of underserved communities including; – Awareness and anti-stigma training for healthcare staff around LGBTQ+. Revise or retrain mental health staff on how to support LGBTQ+ inpatients. Ensure mental health practitioners understand the nuances associated with being LGBTQ+ and intersectionality (or otherwise marginalised) and how that will impact on persons lived experience and mental health outcomes. – Specialist organisations in Surrey (i.e. SMEF) should lead with expertise to develop relevant offers, including non-English speakers, community peer support, community leaders, culturally appropriate language around mental health. – Further explore critical points across the life course where suicide/self-harm risk is greater i.e. Generation X (working age adults). – Consider Armed Forces Concordat in commissioning plans. |
| 2.5 | When the 2021 Census on carer, relationships, and LGBTQ+ specific data is published by the ONS in 2023, a full review will need to be undertaken to determine future commissioning intentions and recommendations. |
| 2.6 | Embed a robust process of gaining and utilising lived experience for service developments i.e. utilising insights from people presenting at crisis services to inform upstream responses. |
| 2.7 | Support smaller community groups and community advocacy to strengthen their provision. |
| 2.8 | Frontline and other health and social care workers to receive cultural awareness training to develop a better cultural understanding of Gypsy Roma and Traveller (GRT) communities and of the language used around mental health and wellbeing within GRT communities. |
| 2.9 | Interventions to address social isolation and loneliness to be applied at scale with an explicit consideration of carers. |
| 2.10 | Continue to progress digital solutions to support communities, including a digital network and a social media safety campaign. |
| 2.11 | “Who holds the power” was an independent review undertaken by IMHN, Surrey Coalition and SMEF looking at how SABP and should be applied to strengthen the approach to coproduction; there is a toolkit and series of recommendations that should be reviewed and could be adopted system wide. |
Context
- There is a discrepancy between expressed and actual mental health need. Anti-stigma interventions which are led by the views of communities are required to meet the unmet/ unexpressed need.
- Unexpressed need was identified in men and Generation X.
- Surrey County Council, working with a range of public service and voluntary sector partners, made a successful bid for funds under the Changing Futures programme. This aims to support those who face Multiple Disadvantage: a combination of homelessness, substance misuse, poor mental health, domestic abuse or contact with the criminal justice system. Findings from here may provide some insights on how mental health pathways can support better recovery in the community with stable housing and employment/ education.
- The Armed Forces Covenant is a promise by the nation ensuring that those who serve or who have served in the armed forces, and their families, are treated fairly. The Armed Forces Act 2021, places a legal duty (the ‘Covenant Duty’) on specified public persons and bodies to have due regard to the principles of the Armed Forces Covenant when exercising certain statutory functions in the fields of education, housing and healthcare (including mental health).
Area 3: Address current and predicted unmet need with further equality impact assessments in key areas.
| Area. 3. | Recommendation |
| 3.1 | Routinely apply the Health Inequalities toolkit “Challenge to Providers” (Fig 36 below) for commissioned services and interventions. This should include place based insights and be aligned with QOF for each area to inform place-based plans, which address disparities in expressed need and areas of high expressed need. |
| 3.2 | At the first opportunity analyse the Census 2021 data in relation to mental health need to inform targeted, culturally appropriate approaches. |
| 3.3 | Ensure that Public Health suicide prevention work reflects autism needs. Raise awareness of the Joiner Model working with people who may have autism and those with diagnosed autism and conduct outreach to enhance expressed need in this group. See Fig 37 Joiner model and Autism below. 1. Design and deliver a robust training programme to relevant teams to ensure reasonable adjustments are made so that autistic people are cared for. 2. Universal Mental Health services make reasonable adjustments to improve accessibility for autistic people and to adjust pathways depending on the primary need. 3. Develop clear integrated complex need and postdiagnosis pathways for autistic young people and adults with Mental Health need. 4. Review autism accessibility within inpatient hospital provision and take appropriate action to improve people’s experiences. 5. Develop sensory aware clinical environments to enable autistic people to receive assessment and treatment in sensory aware space. |
| 3.4 | Understand who is attending and completing IAPT services (including LD, LGBTQ+ and ethnicity) and address any gaps in unseen or common fallout/ drop out populations. |
| 3.5 | Conduct a high-level needs assessment on gambling related harm in Surrey. Develop and implement a programme to reduce gambling related harm based on the needs assessment. |
| 3.6 | Local data regarding work-related stress, depression or anxiety and their impacts on businesses is required. This intelligence could be collated as part of the Workplace Wellbeing programme. |
| 3.7 | To develop mature, sustainable, and integrated social prescribing offer in Surrey linking residents to community offers. |
| 3.8 | Review services where bottlenecks restrict efficiency i.e. s136 detention and challenges with stable housing following discharge. Full review of these pathways would identify critical points for wraparound and escalation/ de-escalation opportunities. |
| 3.9 | Closer alignment of physical and mental health services to ensure that both are able to respond to holistic needs. This should include more screening of mental health in physical healthcare settings and vice versa. Where possible transition between services should be seamless for the user. |
| 3.10 | Enhance the mental health support going in to care homes. This should be supported by the development of an agreed competency and skills-based framework for managing complex behaviour, developing a training and education offer for care homes, implementation of the joint dementia strategy and a measured increase uptake of IAPT services for older people. |
| 3.11 | Develop a coordinated approach to bereavement across Surrey. |
| 3.12 | Further explore Suicide and Suicide Prevention in older adults. |
| 3.13 | Further explore reach and effectiveness of IAPT services. |
| 3.14 | Develop a comprehensive strategy for supporting mental and emotional wellbeing of people in contact with physical healthcare and for those living with long term conditions. |
| 3.15 | To address projected excess deaths in Surrey from CVD and Respiratory illness in those with SMI, the SMI Health Check programme should be enhanced to meet need including those who are unseen. |
| 3.16 | To address projected excess deaths in Surrey from CVD and Respiratory illness in those with SMI, there is a need to further understand why outcomes are so poor for this population, further work should be carried out exploring the LSOAs where deaths have occurred and exploratory work on the health and engagement with health care and support services of those with SMI. |
| 3.17 | Develop and communicate with GPs a Directory of Community Leads for accessing hyperlocal mental and emotional wellbeing support. |
| 3.18 | The CMD data presented in this report is historic, the low prevalence of CMD and only marginally lower rate of suicide in suicide may indicate a change in prevalence. This report should be updated with CMD as soon as published by OHID and/or explore other means of understanding common mental disorder in Surrey. |
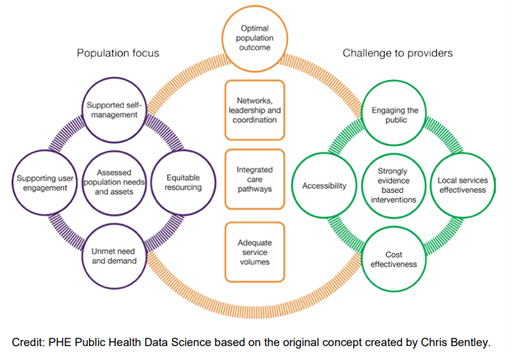
Fig 36. Challenge to Providers
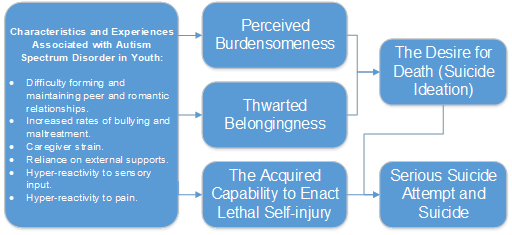
Fig 37. Joiner model and Autism
Area 4: Develop pathways that support holistic approaches including escalation and de-escalation across the system.
| Area. 4. | Recommendation |
| 4.1 | To ensure brief interventions and referrals and response experienced from the frontline are supported by the highest standard training in mental health awareness, mental health first aid, trauma informed approaches and suicide prevention training should continue to be rolled out. To achieve the Trauma Informed System required, the approach needs to be embedded into strategies and ways of working of all providers. |
| 4.2 | Safety plans for all on leaving hospital care for mental health services. |
| 4.3 | Ensure access to holistic support across all pathways across universal, primary and secondary provision. |
| 4.4 | All providers should prioritise the health and wellbeing of their workforce. |
| 4.5 | Agree priorities across the system including providers and commissioners to deep dive and commit to action to improve user experience. |
| 4.6 | Continue to utilise digital solutions to develop digital system responses which meet the needs of users (residents and workforce). |
| 4.7 | Further develop and embed Alliance Models of working. |
| 4.8 | Further development of place-based teams and further roll out GPIMHS as part of wider community transformation. |
| 4.9 | As part of the existing financial recovery work, set up a new system wide Vulnerabilities panel in order that those patients who are medically fit for discharge have the right support package in place to move them safely back into the community. This also links with wider changes made on more joined up discharge approaches. |
| 4.10 | Establish a working group to deliver a county-wide standardised ‘living at home safely mental health plan’. |
| 4.11 | Develop admission packs for people with lived experience and their families and carers. |
| 4.12 | Carry out access audits of inpatient settings and services to ensure inclusivity and compliance under the Equality Act (2010). |
| 4.13 | Establish a protocol for a discharge debrief. |
| Area. 5. | Recommendation |
| 5.1 | Pathways should routinely include support for family members: – Support for families of those experiencing domestic abuse. – Mental Health support probation and prison. – Support for younger victims of crime. – Support for family members of children and young people presenting mental health needs, with self-harm or suicide attempt. |
| 5.2 | Mental Health support should include consideration of transitional arrangements. |
10. Glossary
| Acronym | Meaning |
| A&E | Accident & Emergency |
| ACEs | Adverse Childhood Experiences |
| ADHD | Attention Deficit Hyperactivity Disorder |
| APMS | Adult Psychiatric Morbidity Survey |
| ASD | Autism Spectrum Disorder |
| AUD | Alcohol Use Disorder |
| AUD | Alcohol Use Disorder |
| BMA | British Medical Association |
| CIPHA | Combined Intelligence for Population Health Action |
| CIS-R | Clinical Interview Schedule – Revised |
| CMD | Common Mental Disorders |
| CMD-NOS | Common Mental Disorder – Not Otherwise Specified |
| CVD | Cardiovascular Disease |
| DCD | Development Coordination Disorder |
| EMG | Electric Gaming Machine |
| FASD | Foetal Alcohol Spectrum Disorder |
| FY | Financial Year |
| GAD | Generalised Anxiety Disorder |
| GPPS | General Practice Patient Survey |
| GPs | General Practitioners |
| HES | Hospital Episode Statistics |
| HWBB | Health and Wellbeing Board |
| IAPT | Improving Access to Psychological Therapies |
| ICD-10 | International Classification of Disease, 10th Edition |
| ICP | Integrated Care Partnership |
| IMD | Index of Multiple Deprivation |
| JSNA | Joint Strategic Needs Assessment |
| LGBTQ | Lesbian, Gay, Bisexual, Transgender, Queer |
| LGBTQIA+ | Lesbian, Gay, Bisexual, Transgender, Queer or Questioning, Intersex, Asexual and other identities |
| LSOA | Lower Super Output Area |
| MDT | Multi-disciplinary team |
| NICE | National Institute of Clinical Excellence |
| OCD | Obsessive Compulsive Disorder |
| OHID | Office for Health Improvement and Disparities |
| ONS | Office for National Statistics |
| OG | Oversight Governance Group |
| PCN | Primary Care Network |
| PHE | Public Health England |
| PMH | Perinatal Mental Health |
| PTSD | Post Traumatic Stress Disorder |
| QOF | Quality Outcomes Framework |
| s136 | Section 136 Police Detention |
| SMI | Severe Mental Illness |
| STP | Strategic Transformation Partnership |
| SUD | Substance Use Disorder |
| WHO | World Health Organisation |
| YLD | Years Lived with Disability |
Appendix A – References
Appendix B – Health and Wellbeing Board Matric
Priority 2 Supporting people’s mental health and emotional well-being by preventing mental ill health and promoting emotional well-being
| Outcome 1: Adults, children and young people at risk of and with depression, anxiety and other mental health issues access the right early help and resources | Self-reported wellbeing – people with a low worthwhile score – Population cohort / New Self-reported wellbeing – people with a low satisfaction score – Population cohort / New Self-reported wellbeing – people with a high anxiety score – Population cohort / Existing Self-reported wellbeing – people with a low happiness score – Population cohort / New Access to IAPT services: people entering IAPT as % of those estimated to have anxiety/depression (in a financial year) (%) – HWBS Priority Population focus / Existing |
| Outcome 2: The emotional well-being of parents and caregivers, babies and children is supported | Proportion of children receiving a 12-month review with their Health Visitor – Population cohort / Existing |
| Outcome 3: Isolation is prevented and those that feel isolated are supported | % of adult carers who have as much social contact as they would like (18+ yrs) – HWBS Priority Population focus / New |
| Outcome 4: Environments and communities in which people live, work and learn build good mental health | Gap in the employment rate between those with a learning disability and the overall employment rate (also in Priority 3) – HWBS Priority Population focus / New Gap in the employment rate for those in contact with secondary mental health services and the overall employment rate (also in Priority 3) – HWBS Priority Population focus / New Adults with MH in appropriate accommodation (also in Priority 3) – HWBS Priority Population focus / Existing |
Appendix C – Common Mental Health Conditions
Appendix C – Common Mental Health Conditions
1 – Cohort definition of 12 Common Mental Health conditions.
| Cohort | ICD-10 code | Description |
| Alcohol use disorder (AUD) | F10 | Mental and behavioural disorders due to use of alcohol |
| Substance use disorders (SUD) | F11 | Mental and behavioural disorders due to use of opioids |
| Substance use disorders (SUD) | F12 | Mental and behavioural disorders due to use of cannabinoids |
| Substance use disorders (SUD) | F13 | Mental and behavioural disorders due to use of sedatives or hypnotics |
| Substance use disorders (SUD) | F14 | Mental and behavioural disorders due to use of cocaine |
| Substance use disorders (SUD) | F15 | Mental and behavioural disorders due to use of other stimulants, including caffeine |
| Substance use disorders (SUD) | F16 | Mental and behavioural disorders due to use of hallucinogens |
| Substance use disorders (SUD) | F17 | Mental and behavioural disorders due to use of tobacco |
| Substance use disorders (SUD) | F18 | Mental and behavioural disorders due to use of volatile solvents |
| Substance use disorders (SUD) | F19 | Mental and behavioural disorders due to multiple drug use and use of other psychoactive substances |
| Schizophrenia | F20 | Schizophrenia |
| Schizophrenia | F21 | Schizotypal disorder |
| Schizophrenia | F22 | Persistent delusional disorders |
| Schizophrenia | F23 | Acute and transient psychotic disorders |
| Schizophrenia | F24 | Induced delusional disorder |
| Schizophrenia | F25 | Schizoaffective disorders |
| Schizophrenia | F28 | Other nonorganic psychotic disorders |
| Schizophrenia | F29 | Unspecified nonorganic psychosis |
| Bipolar disorder | F31 | Bipolar affective disorder |
| Depression | F32 | Depressive episode |
| Depression | F33 | Recurrent depressive disorder |
| Anxiety | F40 | Phobic anxiety disorders |
| Anxiety | F41 | Other anxiety disorders |
| Obsessive Compulsive Disorder (OCD) | F42 | Obsessive-compulsive disorder |
| PTSD | F43 | Reaction to severe stress, and adjustment disorders |
| Eating Disorders (ED) | F50 | Eating disorders |
| Personality Disorders (PD) | F60 | Specific personality disorders |
| Personality Disorders (PD) | F61 | Mixed and other personality disorders |
| Conduct Disorder | F91 | Conduct disorders |
| Dementia | F00 | Dementia in Alzheimer disease |
| Dementia | F01 | Vascular dementia |
| Dementia | F02 | Dementia in other diseases classified elsewhere |
| Dementia | F03 | Unspecified dementia |
2 – Cohort definition of Neurosis
| Cohort | ICD-10 code | Description |
| Neurosis | F40 | Phobic anxiety disorders |
| Neurosis | F41 | Other anxiety disorders |
| Neurosis | F42 | Obsessive-compulsive disorder |
| Neurosis | F43 | Reaction to severe stress, and adjustment disorders |
| Neurosis | F44 | Dissociative [conversion] disorders |
| Neurosis | F45 | Somatoform disorders |
| Neurosis | F48 | Other neurotic disorders |
Appendix D – Prevention Interventions
Place Based (Physical Infrastructure Civic level / Wider Determinants)
| Life course Stage | Interventions |
| Starting Well | Breastfeeding Friendly Community Places (Café etc). Family Hubs+ |
| Developing Well | Ensuring community spaces are targeted for the use of families (e.g., libraries, community centres). |
| Living Well | – Improved Housing (multi-occupancy) -align with community Safety/Wider determinants. – Walkable Neighbourhoods – Include links to community safety and reducing ‘perceived’ anti-social behaviour. – Utilisation Green Spaces Include links to community safety and reducing ‘perceived’ anti-social behaviour. – Active Travel Infrastructure – Address inequalities (housing, employment, health) in plans/programmes. – Consider mental health in all policies and as part of core functions including planning. – Key public sector organisations to consider signing the Mental Health Prevention Concordat. – Mental health impact assessment is included in strategic plans of SCC, district/borough councils. – Prevention of risk behaviours – e.g., night time economy, cycle lanes, lighting – PH action to reduce harm & inequity of harm from gambling- to focus on individuals and a range of population-based measures. – Identifying and responding to means of and places of suicide risk with planning and trading standards. |
| Working Well | – Employers pay staff real living wage. – Employers include “real living wage” in contracts /supply chain, employment, and volunteering of local people as part of social value. – Councils include promotion of Healthy Workplace in all relevant contracts. |
| Ageing Well (Include living well) | Housing – Home safety & repair, Hoarding Interventions. |
Communities (People Contact/Digital Offer)
| Life course Stage | Interventions |
| Starting Well | Breastfeeding Friendly Community Places (Café etc). Family Hubs+ |
| Developing Well | Ensuring community spaces are targeted for the use of families (e.g., libraries, community centres). |
| Living Well | – Improved Housing (multi-occupancy) -align with community Safety/Wider determinants. – Walkable Neighbourhoods – Include links to community safety and reducing ‘perceived’ anti-social behaviour. – Utilisation Green Spaces Include links to community safety and reducing ‘perceived’ anti-social behaviour. – Active Travel Infrastructure Address inequalities (housing, employment, health) in plans/programmes. – Consider mental health in all policies and as part of core functions including planning. Key public sector organisations to consider signing the Mental Health – Prevention Concordat. – Mental health impact assessment is included in strategic plans of SCC, district/borough councils. – Prevention of risk behaviours – e.g., night time economy, cycle lanes, lighting – PH action to reduce harm & inequity of harm from gambling- to focus on individuals and a range of population-based measures. – Identifying and responding to means of and places of suicide risk with planning and trading standards. |
| Working Well | Employers pay staff real living wage. Employers include “real living wage” in contracts /supply chain, employment, and volunteering of local people as part of social value. Councils include promotion of Healthy Workplace in all relevant contracts. |
| Ageing Well (Include living well) | Housing – Home safety & repair, Hoarding Interventions. |
Targeted Service led interventions (Services)
| Life course Stage | Interventions |
| Starting Well | – Stop Smoking intervention in Pregnancy. – Prevention of Domestic Abuse. Commission reproductive health services that include public mental health. – Commission community & inpatient perinatal mental health services to meet need. – Breastfeeding Support. – Promote parental mental health post birth. – Post-partum psychosocial support. – Patient led/empowering support for mothers & partners who’ve had traumatic &/or premature births+. – Commission evidence-based parenting Support to improve family formation, perinatal and early years mental health. – Support for parents with MH & SM. |
| Developing Well | – Bullying intervention in schools. – Intervention for Abuse (ACE). – Safeguarding re mental health+. – Support for families (parents/child) SM MH. |
| Living Well | – Fuel Poverty reduction. – Homelessness Strategies and Services. – Tackling poverty, maximising income and financial capability and reducing debt. – Supported opportunities for people with MH into education, employment, delivering community activities. – Social Prescribing to include links with green spaces, learning, communities, debt, volunteering. – Provide services that protect mental health of those with LTC (holistic health & care services). – Meet the physical health needs of those with diagnosed mental health. – Service/treatment pathways & staff Address inequalities in service provision – health equity across pathways to ensure access to all and equitable outcomes. – NHS Health Checks to include mental health screening tool. – Health checks for SMI. – Prevention of risk behaviour (lifestyle) – MECC is used to promote mental wellbeing & prevent MH problems. – Prevention of risk behaviour (lifestyle) – Stop smoking services target people with SMI. – Intervene early in mental disorder: |
| Living Well | – Support for people with Long Term Conditions emotional and mental wellbeing – Primary and Secondary Care (NICE Guidance, Cancer, Cardiology, Diabetes, Dermatology etc) Physical and Mental Health Workstream. – Targeted support for substance use. Intervention for Domestic Abuse (DA) and support/wrap around care for survivors. – Information and support for people bereaved by suicide. – Support for victims of crime. – Targeted evidence & NICE/PHE guideline-based support & suicide prevention planning for people who have been arrested, offenders and people who have served time in prison (i.e. community & custodial settings). – Improved management of depression & SMI. – MH Trust 10 ways to improve patient safety. – Targeted sleep support. |
| Working Well | – Employee Assistance Programmes. – IAPT. – MHFA training. – Trauma Informed Approaches. |
| Working Well | Support for unemployed. |
| Ageing Well (Include living well) | – Targeted intervention for high-risk groups to access mental health support including carers, LTC and more isolated. – Addressing hearing/sight & mobility loss. – Bereavement Support. – Antihypertensive Treatment. – Intervention DA. |
[1] The physical health check help to pick up on signs that a person may be at risk of diabetes, stroke or heart problems. Early action can help to stop these issues becoming more serious.
[2] AHAH (the index of ‘Access to Health Assets and Hazards’) is a multi-dimensional index developed by the Consumer Data Research Centre for Great Britain measuring how ‘healthy’ neighbourhoods are.
[3] British Journal of Psychiatry, Autism and autistic traits in those who died by suicide in England
[4] Drug misuse in England and Wales – Office for National Statistics (ons.gov.uk)
[5] The association between gambling and financial, social and health outcomes in big financial data, Feb 21
[6] Gambling disorder, Dec 21