The Surrey Context: People and Place
The Surrey Context: People and Place
Published: September 2022
Last Updated: January 2025
Contents
- Introduction
- Health and Wellbeing Strategy and Board
- Understanding health and other boundaries within Surrey
- Overview of Surrey’s population
- Overview of Surrey as a place
- Overview of people in Surrey
- Chapter acknowledgements and contributions
Introduction
The JSNA is an assessment of the current and future health and social care needs of Surrey residents. In this chapter the contextual background is set for Surrey’s joint strategic needs assessment (JSNA), by exploring an overview of Surrey’s population, followed by an overview of Surrey as a place using geographical and economic indicators. Understanding the age profile, ethnicity, religions, language skills and sexual identity of residents, as well as the wider determinants (such as housing, the economy and environment), in which the population lives is essential to ensure services are meeting their needs.
Community and volunteer organisations across Surrey play a critical role in collection and collation of lived experience and advocacy for voice and understanding people’s lived experiences of health and social care services. Some of this community insight from patients, members of the public and service users can be found on the following partner websites:
- Healthwatch monthly insight reports
- Independent mental health network
- Family Voice
- Surrey minority ethnic forum
- Surrey youth focus
- Active Surrey
- Surrey coalition of disabled people
This chapter is based on the latest available population data at time of publication.
Health and Wellbeing Strategy and Board
The Surrey Health and Well-being Strategy sets the vision in which Surrey wishes to improve the health and wellbeing of residents, reduce health inequalities and ensure that No One is Left Behind. It describes our joined-up efforts to create the best conditions for both physical and mental, health and well-being alongside addressing the wider determinants of health – such as housing, the economy and environment. This includes an emphasis on groups within the population with poorer health outcomes, alongside the refreshed priorities and outcomes that all partners across Surrey recognise and support. The strategy also identifies those priority populations – communities of identity and geography which are often overlooked and currently most at risk of poor health outcomes.
The Health and Wellbeing Board is a statutory Body under the Health and Social Care Act 2012 Act for unitary authorities. The board has representatives from Surrey County Council (who also chair), Surrey Heartlands ICS, Frimley Health and Care ICS, other key public services, and the Voluntary, Community and Social Enterprise sector. In December 2024, the Health and Wellbeing Board merged with Surrey Heartlands Integrated Care Partnership (a statutory requirement of all ICSs under the Health and Care Act 2022), retaining representation from Frimley Health and Care ICS.
Progress against metrics of the Health and Wellbeing Board can be found on the Health and Wellbeing Strategy Index
Understanding health and other boundaries within Surrey
The area covered by Surrey County Council is covered by various administrative and health boundaries. These key geographical boundaries and places are described briefly in this section. The Surrey boundaries GIS map shown below provides an overview of the key health and council boundaries in Surrey and also provides an overview of GP practice locations, pharmacy and key hospital sites in Surrey.
Please select the checkboxes listed under “layers” to display various boundaries and detail available on the map.
County council
Surrey is a county council. In Surrey there is a two-tier system of local government, the county council (upper-tier local authority) and the 11 district and borough councils (lower-tier local authorities). Generally, the county council is responsible for the more strategic functions and services such as education and social care.
Districts and boroughs
Districts and boroughs are the local authorities within Surrey, they provide local services such as environmental health, housing, leisure centres, waste collection and planning applications. There are two districts and 11 boroughs in Surrey. Some functions are shared between county and districts and boroughs. More detail on the responsibilities of each level of council can be found on the council website.
Integrated Care Systems (ICS)
There are 42 ICSs in England which bring health and care organisations together to develop shared plans and joined-up services. They were established in 2022 (and have since been formalised in statutory bodies) and are focused around geographical areas. The ICSs that cover parts of Surrey county can be viewed on the Surrey boundaries map above.
Integrated care boards (ICB)
Each ICS has an integrated care board (ICB), which is a statutory NHS organisation responsible for developing a plan in collaboration with NHS trusts/foundation trusts and other system partners for meeting the health needs of the population, managing the NHS budget and arranging for the provision of health services in the defined area. Further detail is available from NHS England: Integrated care in your area.
Surrey Council works with both NHS Surrey Heartlands Integrated Care Board and NHS Frimley Integrated Care Board.
Integrated care partnerships (ICP)
ICPs are a statutory committee jointly formed between the NHS integrated care board and all upper-tier local authorities that fall within the ICS area. The ICP will bring together a broad alliance of partners concerned with improving the care, health and wellbeing of the population, with membership determined locally. The ICP is responsible for producing an integrated care strategy on how to meet the health and wellbeing needs of the population in the ICS area. Further detail is available from NHS England: What are integrated care systems.
Place-based partnerships
Place-based partnerships operate on a smaller footprint within an ICS. They include multi-agency partnerships involving the NHS, local authorities, the voluntary and community sector (VCSE) and local communities themselves. There are four place-based partnerships within Surrey Heartlands ICS and five within Frimley Health and Care ICS, these are listed in the table below.
All four of the place-based partnerships in Surrey Heartlands ICS (Surrey Heartlands place-based partnerships) sit within Surrey county boundaries. Three of the five place-based partnerships in Frimley Health and Care ICS (Frimley Health and Care communities map) overlap with Surrey county boundaries: Part of Windsor and Maidenhead (which covers Windsor PCN, on the edge of Runnymede and used to cover East Berkshire CCG), all of Surrey Heath (which covers Surrey Heath PCN, Surrey Heath borough council and a part of the West of Guildford borough council) and part of North East Hampshire and Farnham (Farnham PCN on the West of Waverley borough council). The place-based partnerships that cover parts of Surrey county can be viewed on the Surrey boundaries map above.
Table 1: Integrated Care Systems and Place-based Partnerships in Surrey
| Integrated care system | Place-based partnerships in Surrey |
| Surrey Heartlands | North West Surrey Guildford and Waverley Surrey Downs East Surrey |
| Frimley | Windsor and Maidenhead (part) Surrey Heath (all) North East Hampshire and Farnham (part) |
Further detail can be viewed on Surrey Heartlands place-based partnerships and Frimley Health and Care communities map.
Integrated Neighbourhood Teams (INTs)
Each Place-based partnership in the NHS is further divided into INTs. The approach taken to develop these teams varies; some align with their Primary Care Networks (collections of GP surgeries), and some adopt their own methodology. The purpose of INTs is to facilitate NHS community services, social care and other local providers to work together to deliver more co-ordinated and proactive care on a localised level.
Key Neighbourhoods
Key neighbourhoods are different from INTs. They are 21 of the most deprived areas in Surrey, defined in the Surrey Health and Wellbeing Strategy as a priority due to those residing in them experiencing poor health outcomes. Table 2 outlines these key neighbourhoods.
Summaries about the key neighbourhoods are available on Surrey-i.
Table 2: List of key neighbourhoods and priority wards in Surrey’s health and wellbeing strategy
| Key neighbourhood (electoral ward) | Lower super output area (ranked on IMD score) |
IMD decile of LSOA (lower is more deprived) |
District / borough | Primary Care Network | Place-based partnership (Surrey Heartlands (SH) or Frimley) | Strategic Town and Village Area – where applicable† |
| Hooley, Merstham and Netherne | 1. Reigate / Banstead 008A | 2 | Reigate and Banstead | Horley | East Surrey (SH) | Redhill |
| Canalside | 2. Woking 004F | 2 | Woking | WISE 3 | NW Surrey (SH) | Woking |
| Westborough | 3. Guildford 012D | 2 | Guildford | GRIPC | Guildford and Waverley (SH) | Guildford |
| Bellfields and Slyfield (previously Stoke) | 4. Guildford 007C | 2 | Guildford | GRIPC | Guildford and Waverley (SH) | N/A |
| Stanwell North | 5. Spelthorne 001B | 3 | Spelthorne | SASSE 3 | NW Surrey (SH) | Staines |
| Dorking South (previously Holmwoods) | 6. Mole Valley 011D | 3 | Mole Valley | Dorking | Surrey Downs (SH) | Dorking |
| Tattenham Corner & Preston | 7. Reigate and Banstead 005A | 3 | Reigate & Banstead | Banstead Healthcare | Surrey Downs (SH) | N/A |
| Court | 8. Epsom and Ewell 007A | 3 | Epsom & Ewell | Epsom | Surrey Downs (SH) | Epsom |
| Ashford North and Stanwell South | 9. Spelthorne 002C | 3 | Spelthorne | SASSE 3 | NW Surrey (SH) | Ashford |
| Goldsworth Park | 10. Woking 005B | 3 | Woking | WISE 3 | NW Surrey (SH) | N/A |
| Englefield Green West | 11. Runnymede 002F | 3 | Runnymede | Windsor | Windsor and Maidenhead (East Berkshire) | Egham |
| Walton South | 12. Elmbridge 004B | 3 | Elmbridge | Walton | NW Surrey (SH) | Walton-on-Thames |
| Horley Central & South | 13. Reigate and Banstead 018D | 3 | Reigate and Banstead | Care Collaborative | East Surrey (SH) | Horley |
| Farnham Heath End (previously Farnham Upper Hale) |
14. Waverley 002E | 3 | Waverley | Farnham | North East Hampshire and Farnham (Frimley) | Farnham |
| Stanwell North | 14a. Spelthorne 001C | 3 | Spelthorne | SASSE 3 | N/A | N/A |
| Godalming Central and Ockford | 15. Waverley 010A | 3 | Waverley | East Waverley | Guildford & Waverley (SH) | Godalming |
| Chertsey St. Ann’s | 16. Runnymede 006D | 3 | Runnymede | COCO | NW Surrey (SH) | Chertsey |
| Redhill West & Wray Common |
17. Reigate and Banstead 010E | 3 | Reigate and Banstead | Care Collaborative | East Surrey (SH) | N/A |
| Ash Wharf | 18. Guildford 010C | 3 | Guildford | Surrey Heath | Surrey Heath (Frimley) | N/A |
| Walton North | 19. Elmbridge 008A | 4* | Elmbridge | Walton | NW Surrey (SH) | N/A |
| Cobham and Downside | 20. Elmbridge 017D | 4** | Elmbridge | Leatherhead | Surrey Downs (SH) | N/A |
| Old Dean | 21. Surrey Heath 004C | 4** | Surrey Heath | Surrey Heath | Surrey Heath (Frimley) | Camberley (including Frimley) |
Source: adapted from the table in https://www.healthysurrey.org.uk/about/strategy/surrey-health-and-well-being-strategy-update-2022 *Overall IMD decile 4 and for IMD supplementary index on Income Deprivation Affecting Children in decile 1 (highest 10% nationally)
** Overall IMD decile 4 and for IMD domain Education, Skills and Training in decile 1 (highest 10% nationally). † Further strategic towns and villages can be found in Table 3
Primary care networks (PCNs)
PCNs are a collection of general practices and other primary care services, such as community pharmacies, situated in the same area. They are technically not a geographical area – as they are responsible for the patients registered into their care, who may or may not live locally. However, with certain assumptions, it is possible to attempt to map PCNs for the purposes of planning. This mapping can be viewed on the Surrey boundaries GIS map. The methodology used to determine this mapping is detailed on the PCN aggregation methodology page of the Surrey population tableau dashboard.
The purpose of PCNs is to bring together local healthcare services to work at scale and provide a wider range of services at neighbourhood level. Further detail on the work of PCNs is available on Surrey Heartlands and Frimley Health and Care websites.
Wards
Wards, or electoral wards, are one of the main administrative areas on which local government is based. Each local authority (district or borough) is divided into a number of wards and between 1 and 3 councillors are elected to represent each ward on the council.
Ward boundaries are regularly reviewed and in 2023 there were 174 wards in Surrey. There were previously 186 (in 2021), 193 (in 2016) 206 (in 2011).
The wards in Surrey county can be viewed on the Surrey boundaries map above.
Middle-layer super output areas (MSOA)
MSOAs are units of geography used in the UK for statistical analysis. They are developed and released by UK Statistics. MSOAs have a minimum population of 5000 and a mean (average) population of 7200.
Lower-layer super output areas (LSOA)
LSOAs are units of geography used in the UK for statistical analysis. They are developed and released by UK Statistics. LSOA have a minimum population of 1000; mean population of 1500. Following the 2021 Census, there are 719 Lower Super Output Areas (LSOA) in Surrey; in 2011 there were 709.
There is a helpful Guide to the Geographies of Surrey | Surrey-i (surreyi.gov.uk) on Surrey-i that explains some of the boundaries further.
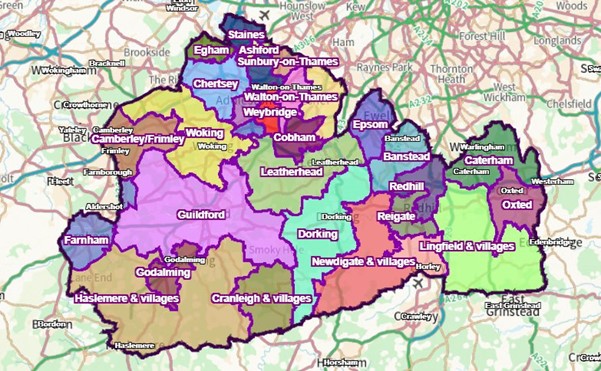
Towns and Village Areas
Towns and Villages are a geography created specifically in Surrey and present an opportunity to understand the county from the perspective of places which are recognisable to residents, communities and local partners. They do not represent every town and village in Surrey, just the most recognisable to residents which are likely to have greater economic significance. There are 27 towns and 2 strategic village areas.
Table 3: Surrey Towns and Village Areas
| Surrey Towns and Village Areas |
| Addlestone |
| Ashford* |
| Banstead |
| Camberley (including Frimley)* |
| Caterham |
| Chertsey* |
| Cobham* |
| Cranleigh |
| Dorking* |
| Egham* |
| Epsom* |
| Esher |
| Farnham* |
| Godalming* |
| Guildford* |
| Haslemere |
| Horley* |
| Leatherhead |
| Oxted |
| Redhill* |
| Reigate |
| Staines-upon-Thames* |
| Sunbury-on-Thames |
| Walton-on-Thames |
| West Byfleet |
| Weybridge |
| Woking |
| plus Newdigate & villages |
| plus Lingfield & villages |
*town areas that also include HWB Strategy Key Neighbourhoods (see table 6)
Towns and village areas aim to improve local co-ordination and delivery of place making enhancements, regeneration of communities, and natural and built environments. Actions taken by key towns will be informed by key strategies aimed at county, ICS and district and borough level. Commonalities of strategies relevant to the geographical area will inform action to address health inequalities, improve equity of opportunity, improve community engagement and empowerment, drive economic growth and promote environmental sustainability.
Figure 1: Map of towns and village areas
Overview of Surrey’s population
Understanding the population of Surrey, including the trends seen in demographics and the differences within the population, is key to ensuring the needs of communities are met.
Please follow this link to the Surrey population data visualisations relevant to this section of this chapter, these dashboards are also embedded below.
Population estimates
Please follow the link or explore the ‘Current population estimates’ page of the Surrey population tableau dashboard below.
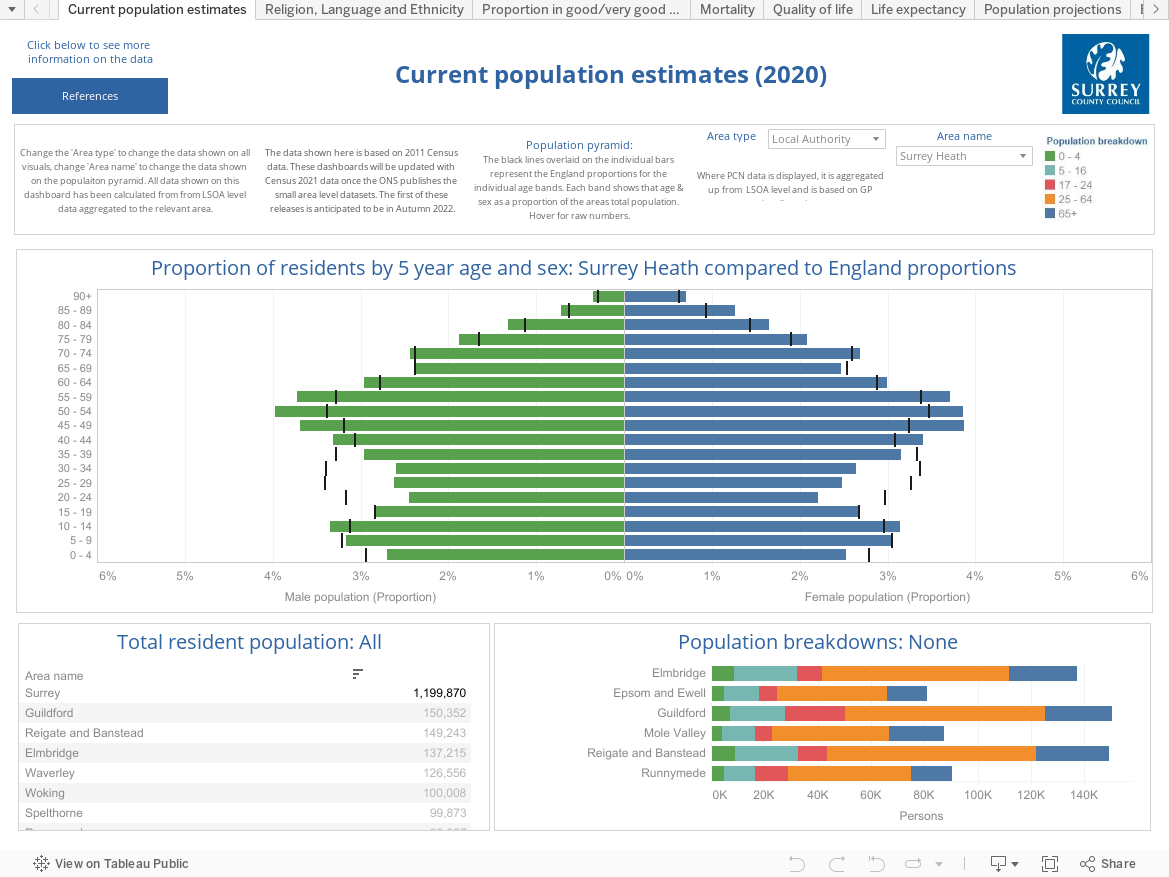
At the last census the population of Surrey was 1,203,100 (2021).
The dashboard shows that the largest local authorities by population are Reigate and Banstead (150,849) and Guildford (143,645), and the smallest is Epsom and Ewell (80,921). Further population projections can be found on Surrey-i.
Surrey Heartlands ICS has a population of 1,056,346, and Frimley ICS has a population of 764,349 (this includes people who are residents of other counties). Population estimates for ICS’s are based on residents of the relevant geographical area/s and will be different from the population of registered patients.
Age
Within Surrey’s population, people aged 45 to 49 and 50 to 54 years old are the two largest five-year cohorts.
Surrey’s population is broadly similar to England, with a slightly greater proportion of 5 to 19 year-olds, a much smaller proportion of 20 to 34 year-olds and a greater proportion of the population aged 40 to 59 years old than in England. This results in an older working-age population in Surrey, which has implications for the workforce and for population health and care needs. The lower proportion of 20 to 34 year-olds is seen for both males and females and likely reflects a greater proportion of children and parents/ carers in Surrey than other areas in England.
Of Surrey’s population:
- 5.5% (65,635) are 0 to 4 year-olds, ranging from 4.6% in Mole Valley to 6.0% in Woking, Reigate and Banstead, and Elmbridge
- 14.9% (179,567) are 5 to 16 year-olds, ranging from 13% in Runnymede to 16.9% in Elmbridge
- 8.7% (104,328) are 17 to 24 year-olds, ranging from 6.4% in Elmbridge to 14.4% in Guildford
- 52.1% (626,392) are 25 to 64 year-olds, ranging from 49.7% in Waverley to 54.6% in Woking
- 18.9% (227,188) are 65 years and over, ranging from 16.6% in Woking to 23.8% in Mole Valley
Life expectancy
Please follow the link or explore the ‘Life expectancy’ page of the Surrey population tableau dashboard below.

Life expectancy at birth is a measure of the average number of years a person would expect to live based on contemporary mortality rates. For a particular area and time period, it is an estimate of the average number of years a new-born baby would survive if they experienced the age-specific mortality rates for that area and time period throughout their life. Surrey residents have on average longer life expectancies than people in the South East and most of England.
There has been a widespread trend of rising life expectancy at birth for males and females across the country and this is also the case for Surrey. Surrey children born in 2021 to 2023 are expected to live longer than Surrey children born in 2001 to 2003.
The life expectancy at birth for those born in Surrey was 81.5 years for males and 85.0 years for females (2021-23), compared to 79.1 and 83.1 for England and 80.3 and 84.1 for the South East. Data collected between 2021-2023 demonstrated that life expectancy has decreased for male and females in Surrey, the South East and England when compared to the period 2017-19.
Table 3: Life Expectancy at Birth across Surrey, the South East and England
| Area | Female 2017-19 | Female 2021-23 | Male 2017-19 | Male 2021-23 |
| Surrey | 85.3 | 85.0 | 82.0 | 81.5 |
| South East | 84.2 | 84.1 | 80.7 | 80.3 |
| England | 83.3 | 83.1 | 79.7 | 79.1 |
Further life expectancy information is available on Surrey-i life expectancy
Life expectancy (2016-20) at ward level, for males the life expectancy is lowest in Portley, Tandridge (77.6 years) and highest in Warlingham West, Tandridge (88 years). For females, the life expectancy is lowest in Ashford North and Stanwell South, Spelthorne and Stanwell North, Spelthorne (81.2 years) and highest in Woldingham, Tandridge (93.5 years). However, data is missing for 10 wards for females and 12 wards for males, so this picture is incomplete.
Table 4: Difference in life expectancy within districts and boroughs
| District & Borough | Female – Lowest life expectancy (ward) | Female – Highest life expectancy (ward) | Female – Difference | Male – Lowest life expectancy (ward) | Male – Highest life expectancy (ward) | Male – Difference |
| Elmbridge | 83.5 (Molesey East) | 90.0 (Hinchley Wood and Weston Green) | 6.5 | 78.6 (Walton South) | 87.6 (Oxshott and Stoke D’Abernon) | 9.0 |
| Epsom and Ewell | 81.4 (Court) | 88.6 (Cuddington) | 7.2 | 79.0 (Town) | 86.3 (Stoneleigh) | 7.3 |
| Guildford | 82.2 (Stoughton) | 92.5 (Pirbright) | 10.3 | 79.3 (Westborough) | 86.4 (Holy Trinity) | 7.1 |
| Mole Valley | 83.8 (Dorking South) | 89.6 (Fetcham East) | 5.8 | 79.6 Dorking South | 86.0 (Fetcham West) | 6.4 |
| Reigate and Banstead | 81.4 (Redhill East) | 86.5 (Meadvale & St John’s) | 5.1 | 78.5 (Horley Central & South) | 83.8 (Horley East & Salfords) | 5.3 |
| Runnymede | 81.6 (Chertsey St Ann’s) | 88.4 (Chertsey Riverside) | 6.8 | 78.8 (Chertsey St Ann’s) | 83.9 (Ottershaw) | 5.1 |
| Spelthorne | 81.2 (Ashford North and South) | 88.4 (Sunbury East) | 7.2 | 77.8 (Aunbury Common) | 82.5 (Ashford East) | 4.7 |
| Surrey Heath | 81.6 (Frimley Green) | 89.1 (Heatherside) | 7.5 | 77.7 (St Michaels) | 84.6 (Windlesham & Chobham) | 6.9 |
| Tandridge | 81.9 (Portley) | 93.5 (Woldingham) | 11.6 | 77.6 (Portley) | 88.0 (Woldingham West) | 10.4 |
| Waverley | 81.7 (Godalming Central and Ockford) | 92.1 (Godalming Holloway) | 10.4 | 78.2 (Haslemere Critchmere and Shottermill) | 87.3 (Farnham Bourne) | 9.1 |
| Woking | 81.9 (Pyrford) | 85.6 (Heathlands) | 3.7 | 80.1 (Byfleet and West Byfleet) | 83.9 (Goldsworth Park) | 2.8 |
Life expectancy data at ward level is available from Fingertips
At district and borough level, for males is lowest in Runnymede (80.1 years) and highest in Waverley (82.4 years). Life expectancy for females (2021-23) is also lowest in Runnymede (83.9 years) and is highest in both Elmbridge (85.7 years). More detailed analysis of life expectancy, including analysis at a district and borough level, is available on Surrey-i life expectancy
Inequalities in life expectancy
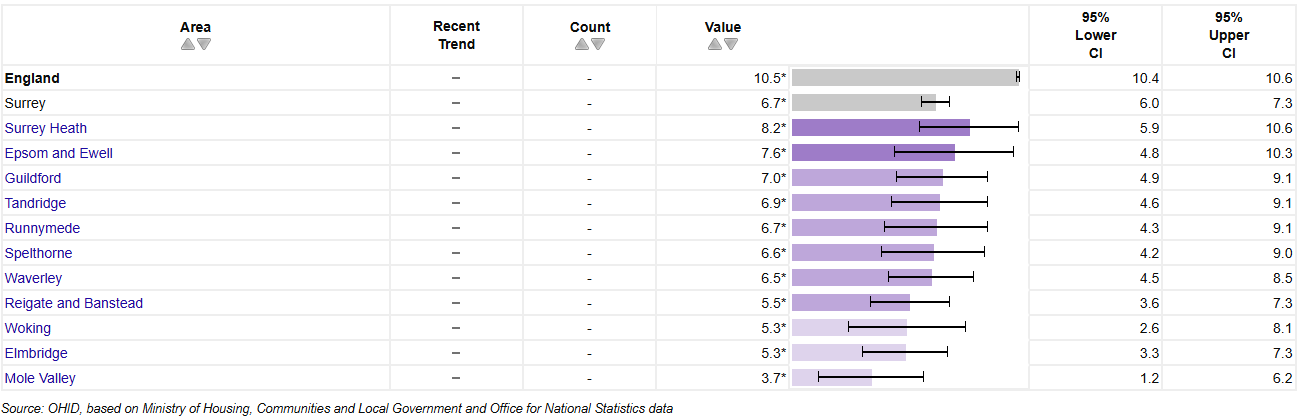
Inequalities in life expectancy exist between the most and least deprived areas nationally and in Surrey. The overarching measure of inequality in life expectancy in the Public Health Outcomes Framework (PHOF) PHOF data tool, is the slope index of inequality. The slope index of inequality is a measure of the social gradient in life expectancy (i.e., how much life expectancy varies with deprivation) which can be used to show this inequality. It measures variation in life expectancy across the whole range of deprivation, rather than just considering the extreme groups. The calculation takes into account life expectancy in each deprivation decile within an area and summarises the variation into a single number. This represents the range in years of life expectancy across the social gradient from most to least deprived, based on a statistical analysis of the relationship between life expectancy and deprivation across all deprivation deciles.
The range in years of life expectancy across the social gradient from most to least deprived in Surrey is 6.7 years for males and 4.6 years for females. This gap is lower than the difference across England, which is 10.5 years in males and 8.3 years in females, however there is a wider range in inequalities between people in each of the districts and boroughs in Surrey (OHID public health profiles).
The figure below shows that in males, the slope index of inequality is greatest in Surrey Heath– with 8.2 years between males born in the most and least deprived areas. The gap is smallest in Mole Valley, with 3.7 years.
Figure 2: Inequality in LE at birth in males in Surrey districts and boroughs (2021-2023)
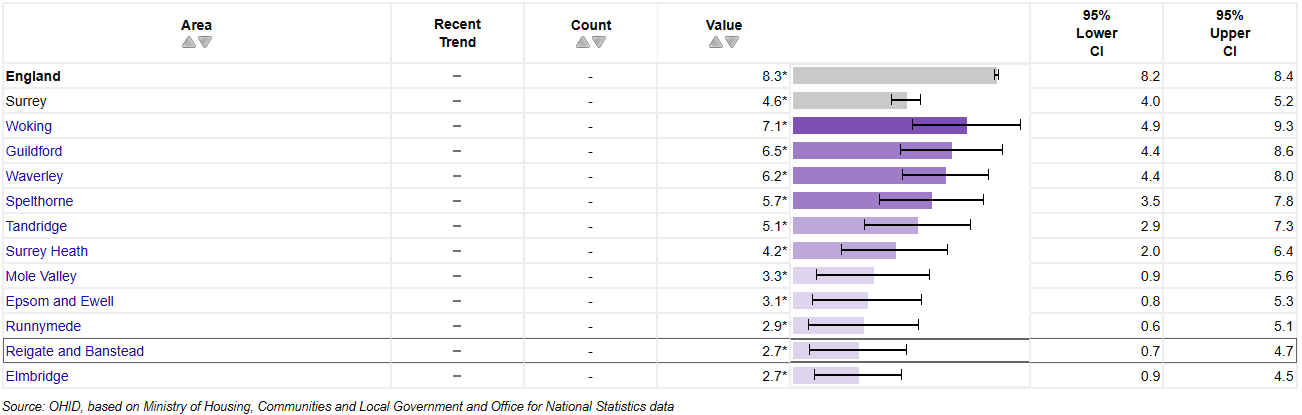
The figure below shows that in females the slope index of inequality is greatest in Woking – with 7.1 years between females born in the most and least deprived areas. The gap is smallest in Elmbridge, with 2.7 years.
Figure 3: Inequality in LE at birth in females in Surrey districts and boroughs (2021-2023)
Healthy life expectancy
Healthy life expectancy at birth is an estimate of the average number of years babies born this year would live in a state of good general health if mortality levels at each age, and the level of good health at each age, remain constant in the future. This is an important measure to consider alongside life expectancy and in terms of health inequalities. Between 2021 and 2023 healthy life expectancy in Surrey was 65.7 years and 66.5 years for males and females respectively. This was higher than both the South East (males 63.5, females 64.4) and England (males 61.5, females 61.9). This data can be explored on Fingertips.
Wellbeing and indicators of quality of life
Please follow the link or explore the ‘Economic and other indicators’ page of the Surrey population tableau dashboard below.

The Office for National Statistics looks at a variety of indicators to assess quality of life and wellness. Within this are survey questions focusing on self-reported wellness.
- When rating anxiety on a scale of 0 – 10 (0 being no anxiety, 10 being high anxiety), Tandridge and Woking reported the least anxiety (2.7) and Spelthorne the most (4.3)
- When rating the feeling that things done in life are worthwhile on a scale of 0 – 10 (0 being not at all, 10 being completely), Runnymede has the highest rating (8.3) and Waverley the lowest (7.5)
- When rating happiness on a scale of 0 – 10 (0 being low, 10 being high), Woking had the highest rating (8.3) and Guildford had the lowest (7.1)
- When rating life satisfaction on a scale of 0 – 10 (0 being low, 10 being high), Runnymede has the highest rating (8.0), Reigate and Banstead and Spelthorne had the lowest (7.2)
Nationally and in Surrey average ratings of well-being have deteriorated across all indicators in the year ending March 2021, continuing a trend that was seen across most indicators in the previous period, but even more sharply, and which notably takes place during the COVID-19 pandemic.
Proportion in good health
Please follow the link or explore the ‘proportion of population in good health’ page of the Surrey population tableau dashboard below.

In the census, people were asked to self-report on their health status. The share of the population in good health deteriorates as people age. However, evidence shows this happens earlier and at a faster rate for men and women living in the most deprived areas compared to the least deprived areas (The Health Foundation).
Surrey has a higher proportion of people who report being in good or very good health than England at all ages. The lowest proportion is seen in those ages 65 and older (65.8%), however this is still significantly higher than the same age group nationally (58.0%).
The biggest difference between males and females in Surrey is seen in the 16 to 24 age group, at 92.9% and 94.6% respectively.
Population projections
Please follow the link or explore the ‘population projections’ page of the Surrey population tableau dashboard below.

2018 predictions estimate the population in Surrey will increase from 1,189,934 in 2018 to 1,227,467 in 2043. This prediction suggests the older population will increase, but also that the proportion of the population across age groups between 0 and 74 years old will become more similar. The increase in the population groups aged 45 and over in Surrey is likely to impact more on health and social care services due to increased risks of developing long term conditions and other needs.
Components of population change
Please follow the link or explore the ‘births, deaths and migration’ page of the Surrey population tableau dashboard below.

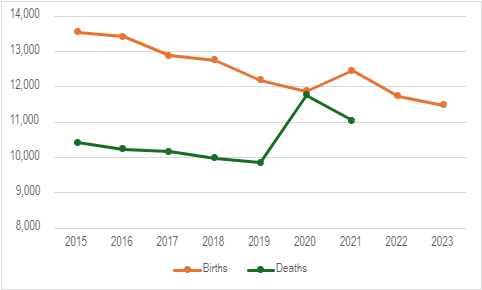
In recent years births in Surrey have declined from 13,542 births in 2015 to 11,474 in 2023. Deaths were also decreasing between 2015 and 2019 but increased from 9,855 in 2019 to 11,755 in 2020. Deaths began to reduce again in 2021 to 11,047. This increase coincides with the COVID-19 pandemic. Migration into Surrey remains higher than migration out of Surrey, although since 2018 the gap has been reducing. In 2020 net migration was 3,758.
Figure 4: Births and Deaths in Surrey
Leading causes of mortality
Please follow the link or explore the ‘mortality’ page of the Surrey population tableau dashboard below.

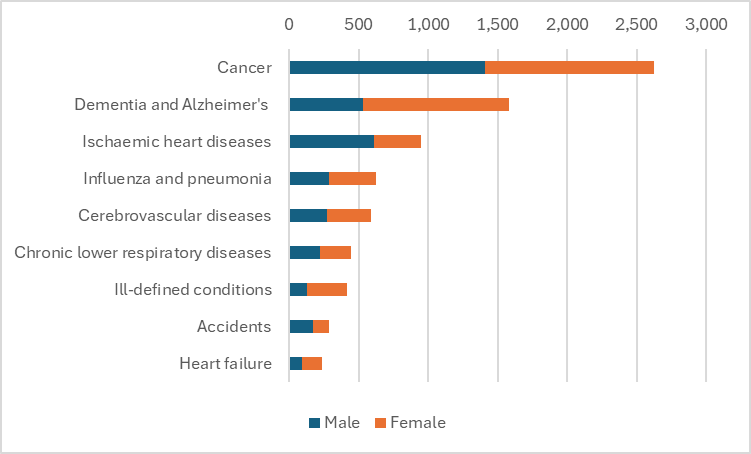
Common causes of mortality should be considered when exploring and implementing interventions to prevent or improve health outcomes. The leading causes of mortality in 2023 in Surrey were:
- Cancer (23.9%)
- Dementia and Alzheimer’s disease (14.4%)
- Ischaemic heart diseases (also called coronary heart/ artery disease (8.6%)
- Influenza and pneumonia (5.7%)
- Cerebrovascular diseases (such as Stroke) (5.4%)
Figure 5: Leading causes of death in surrey (2023)
Religion, languages spoken and ethnicity in Surrey
Please follow the link or explore the ‘Religion, language and ethnicity’ page of the Surrey population tableau dashboard below. The dashboard also allows users to explore the data for health-based geographies including PCNs, place-based partnerships, ICS.

Religion
The majority (50.1%) of the population in Surrey reported their religion as Christianity, which is higher than the proportion in England (46.3%). Over one third of the population (36.6%) reported no religion, which is similar to the national picture. Islam (3.2%) and Hinduism (2.0%) were the next most common religions in Surrey. Data collection about religion was declined in 6.3% of the population.
Religion and beliefs can influence attitudes towards medicine and health care there can also be concerns about discrimination that affect trust about how people of different religions and beliefs would be treated in different health care settings.
Main language and proficiency in English
The majority (93.1%) of Surrey residents speak English as their first language, this ranges from 96.9% in Tandridge to 88.8% in Woking.
Language is also very important in communicating health information, and may be a barrier to understanding, in populations where proficiency in English is not as high as others.
In the 2021 Census, nearly 80,799 Surrey residents reported that they speak a language other than English as their main language. The most common other languages spoken in Surrey were Polish (7,871 speakers) and Romanian (6,239 speakers). Most of those who spoke another main language, reported that they can speak English “well” or “very well”, but 8,505 people cannot speak English well and a further 1,421 reported that they cannot speak English at all in Surrey.
Further analysis on main language and proficiency in English can be found on Surrey-i.
Ethnicity
The most recent data on ethnicity uses 2021 Census data and can be found on Surrey-i. There are known differences in health outcomes based on ethnicity with those from minority ethnicity communities more likely to experience health inequality.
Surrey is less diverse than England as a whole with 76.6% of the population reporting their ethnic group as white British (English, Welsh, Scottish, Northern Irish or British) compared with 73.5% in England. In the South East, 78.8% were recorded as white British.
A further 107,351 (8.9%) of the Surrey population belonged to other white ethnic groups; ‘Irish’, ‘Gypsy or Irish Traveller’, ‘Roma’ and ‘other white’. A higher proportion of people in Surrey (8.9%) were recorded in other white ethnic groups than in England (7.5%) with fewer in all other ethnic groups (14.5% compared with 19.0%).
The next highest reported ethnicity group was Asian; 7.7% of the Surrey population reported their ethnicity as Asian, within which more detailed ethnicity was reported as ‘Indian’ (2.9%) followed by ‘Pakistani’ (1.5%). Around three percent (3.4%) of the population reported mixed ethnicity and 1.7% reported their ethnicity as black. Surrey has the lowest proportion of black residents compared to the South East region and England.
Using 2021 Census estimates, 174,469 (14.5%) of people in Surrey are from a minority ethnicity group that is not white.
Woking is the most ethnically diverse area in Surrey with 32.7% of its population from minority ethnic groups including white minority groups. Waverley is the least diverse with 86.8% reporting their ethnicity as white English, Welsh, Scottish, Northern Irish or British.
Spelthorne has the highest proportion of people from Indian ethnic groups (7.3%) and Woking has the highest proportion of people from Pakistani ethnic groups (7.0%).
Further detail on ethnicity of the population of Surrey is provided in the Overview of People section of this chapter.
Overview of Surrey as a place
Access to Greenspace
A review of evidence by the World Health Organisation found that urban green spaces can improve air and water quality, reduce noise levels and contribute to temperature regulation. They also enable stress reduction and relaxation, physical activity, improved social interaction and community cohesion. Access to natural environments can improve overall mental health, physical fitness level, cognitive and immune function, and can lower mortality rates in general.
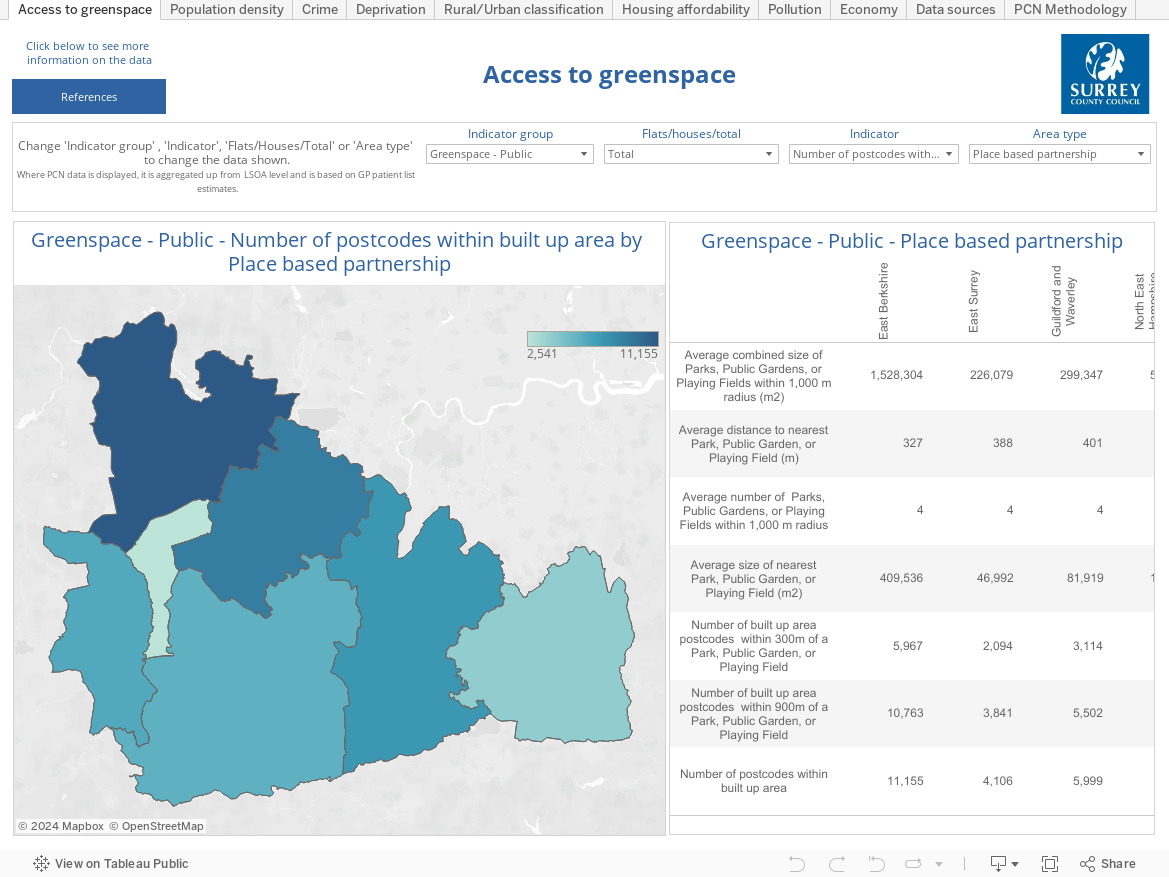
Please follow the link or explore the ‘access to greenspace’ page of the Surrey place tableau dashboard below.
Private outdoor greenspace
Access to greenspace is important for both physical and mental health. The majority (90%) of private addresses in Surrey have private outdoor space, which is similar to the national average. This ranges from 87% in Reigate and Banstead to 92% in Surrey Heath. The average size of private outdoor space varies significantly from 240m2 in Spelthorne, to 762m2 in Tandridge.
Public outdoor greenspace
The average distance to the nearest park, public garden or playing field in Surrey is 370m, slightly below the national average of 379m. Guildford has the highest number of postcodes in a built-up area in Surrey [1].
Rural and urban areas
Please follow the link or explore the ‘rural urban classification’ page of the Surrey place tableau dashboard below.
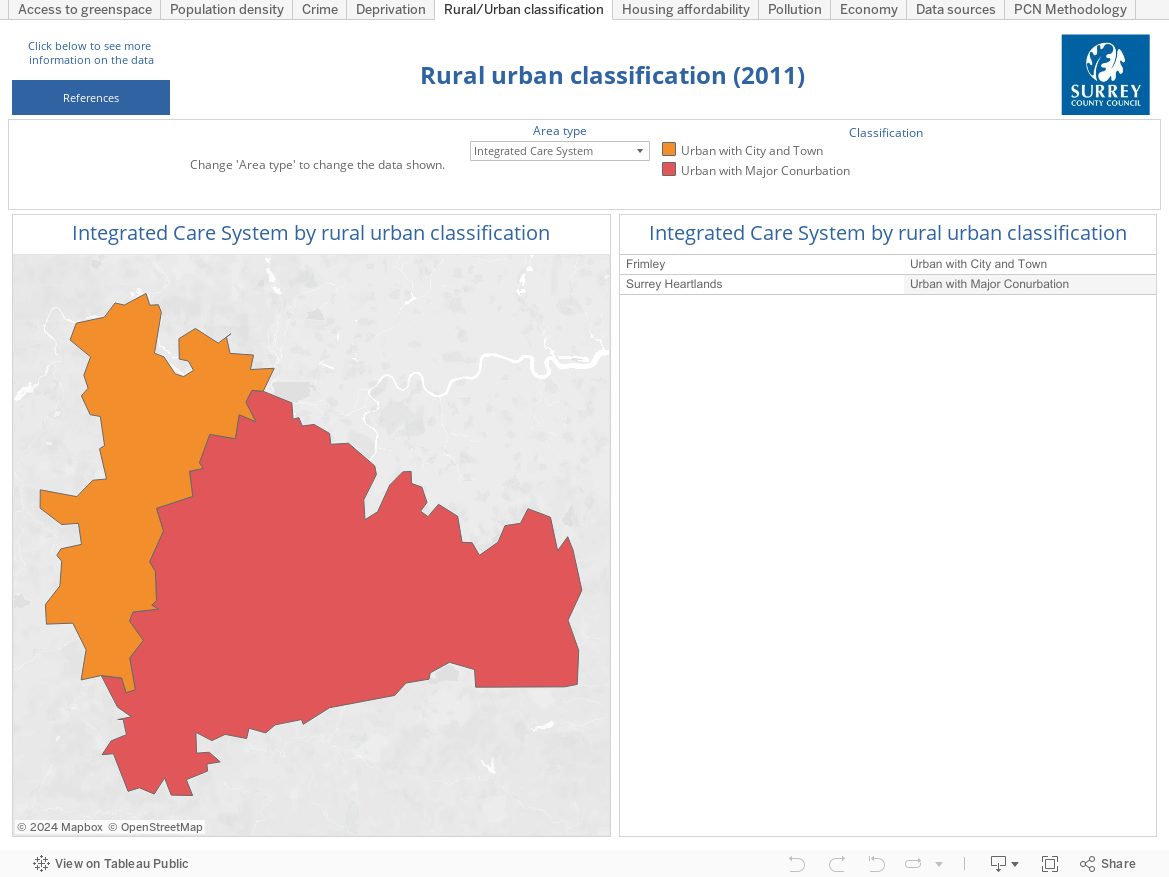
Surrey is a large geographical area with a mix of rural and urban areas. This complex geography is significant as access to services and transport are important concerns in the rural parts of Surrey.
- Waverley is largely rural
- Mole Valley and Tandridge are urban areas with significant rural areas
- Surrey Heath, Reigate and Banstead and Guildford are urban areas with cities and towns
- Elmbridge, Epsom and Ewell, Woking, Runnymede and Spelthorne are urban areas with major conurbations
Population density
Please follow the link or explore the ‘population density’ page of the Surrey place tableau dashboard below. Increasing population density can have complex and negative impacts on morbidity and mortality. Population density is an important consideration for service planning and understanding level of need in different areas.
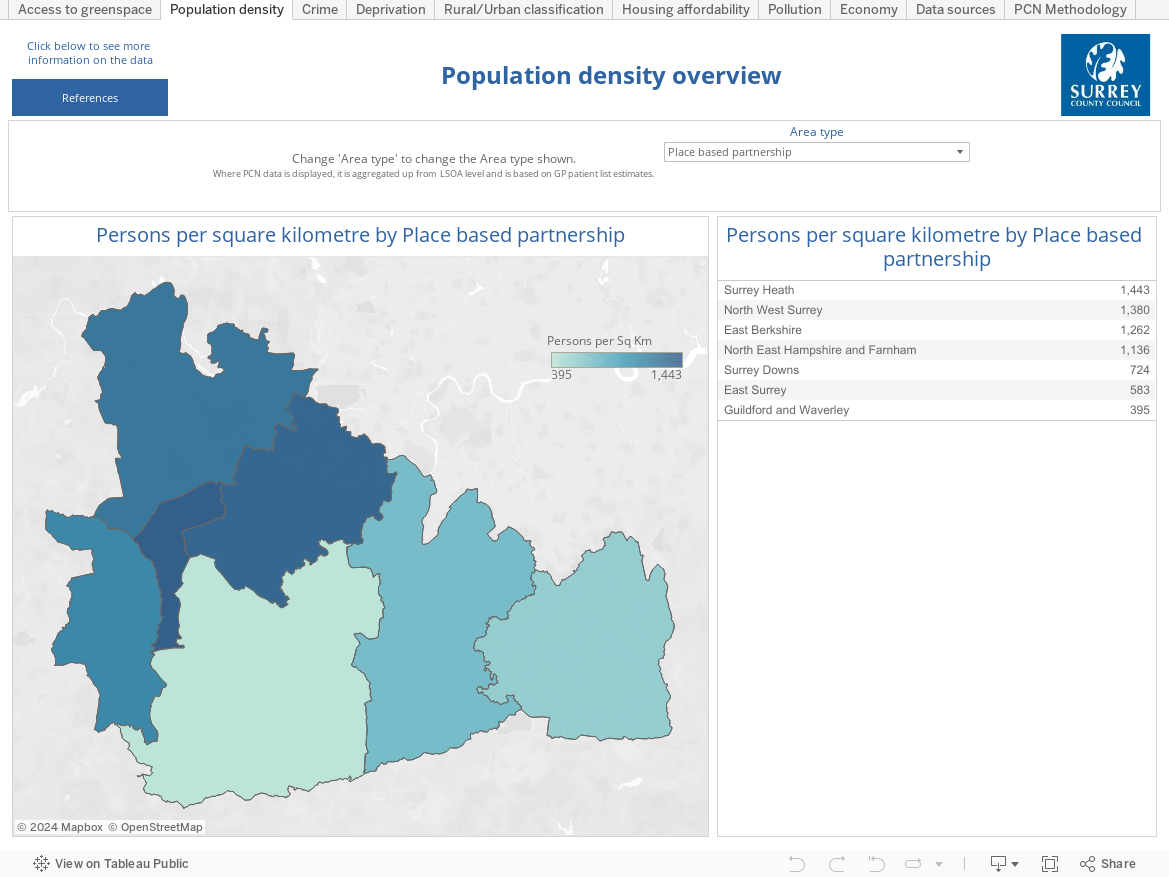
Surrey is the one of the most densely populated shire counties in England with 724 people per square kilometre, significantly higher than the national average of 434 and the South East regional value of 487. The most densely populated districts and boroughs are Epsom & Ewell and Spelthorne, and the least are Mole Valley, Tandridge and Waverley.
Pollution and air quality
Please follow the link or explore the ‘pollution’ page of the Surrey place tableau dashboard below.
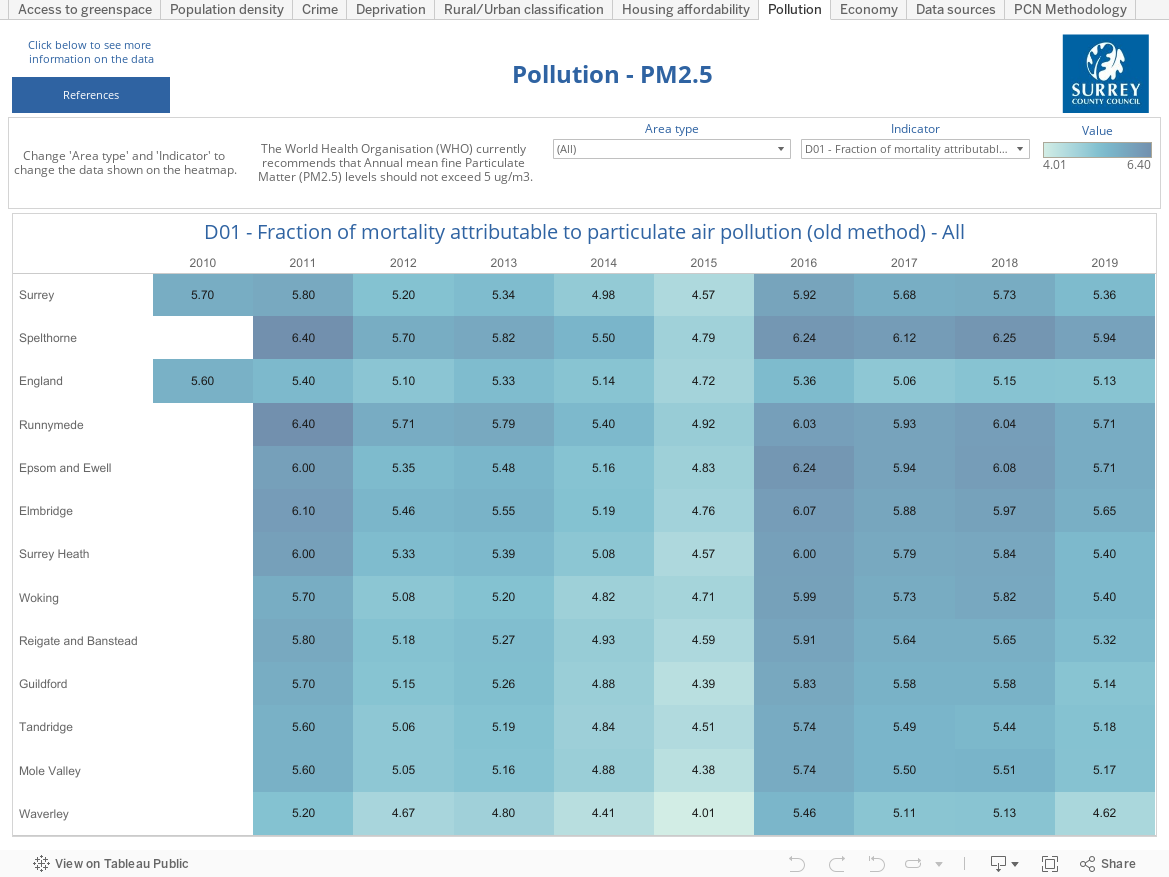
Air pollution is defined by the World Health Organisation (WHO) as being contamination of the indoor or outdoor environment by any chemical, physical or biological agent that modifies the natural characteristic of the atmosphere. Particulate Matter (PM)2.5, are small particles with a diameter of less than 2.5µm, produced mainly from combustion of hydrocarbon fuels and Industrial processes. PM2.5 particles can penetrate deeply into the lung leading to impaired lung function, exacerbation of asthma and a cough in the short term; stroke, lung cancer and cardiovascular disease in the long term. In 2021 the WHO published updated Air Quality Guidelines, outlining a mean annual concentration of 5µg/m3 as being the safe upper limit for PM2.5 concentrations. Population-weighted annual mean PM2.5 data is provided at local authority level by The Department for Environment, Food & Rural Affairs (DEFRA).
The population-weighted annual mean concentration of PM2.5 across Surrey in the year 2020 was 7.69 µg/m3, this is higher than the England average value of 6.93µg/m3. In 2011 Surrey’s PM2.5 level was 10.34 µg/m3, comparing this with the 2020 value shows a reduction in the PM2.5 concentration across this period.
Across districts and boroughs within Surrey in 2020, Spelthorne and Epsom and Ewell had the highest annual mean PM2.5 concentration with a value of 8.35 µg/m3 whereas Waverley had the lowest with a level of 6.91µg/m3. Looking at 2011 Runnymede (which had the third highest 2020 value, 8.00µg/m3) had the highest PM2.5 concentration with a value of 11.36 µg/ml and Waverley again had the lowest value of 9.25µg/m3.
Poor air quality is a significant public health issue. There is strong evidence that air pollution causes the development of coronary heart disease, stroke, respiratory disease, and lung cancer, exacerbates asthma and has a contributory role in mortality [2]. One metric that provides insight into how much pollution is affecting health in a local area is ‘Fraction of annual all-cause adult mortality attributable to particulate air pollution (PM2.5)’ which can be explored in more detail on the ‘pollution’ page of the Surrey place tableau dashboard.
Across Surrey in 2019 5.36% of all-cause mortality was attributable to particulate air pollution, across the same area in 2011 5.80% was attributable to particulate air pollution.
Across districts and boroughs within Surrey in 2019, Spelthorne had the highest proportional of all-cause mortality attributed to particulate matter air pollution with a value of 5.94% where as Waverley had the lowest with a value of 4.62%. Looking at 2011 Runnymede and Spelthorne had the highest proportional of all-cause mortality attributed to particulate matter air pollution with a value of 6.40% and Waverley again had the lowest value of 5.20%.
Crime
Please follow the link or explore the ‘crime’ page of the Surrey place tableau dashboard below. The dashboard also allows users to explore the data for health-based geographies including PCNs, place-based partnerships and ICS. As crime rates increase, life expectancy tends to decrease, and people live in poorer health.
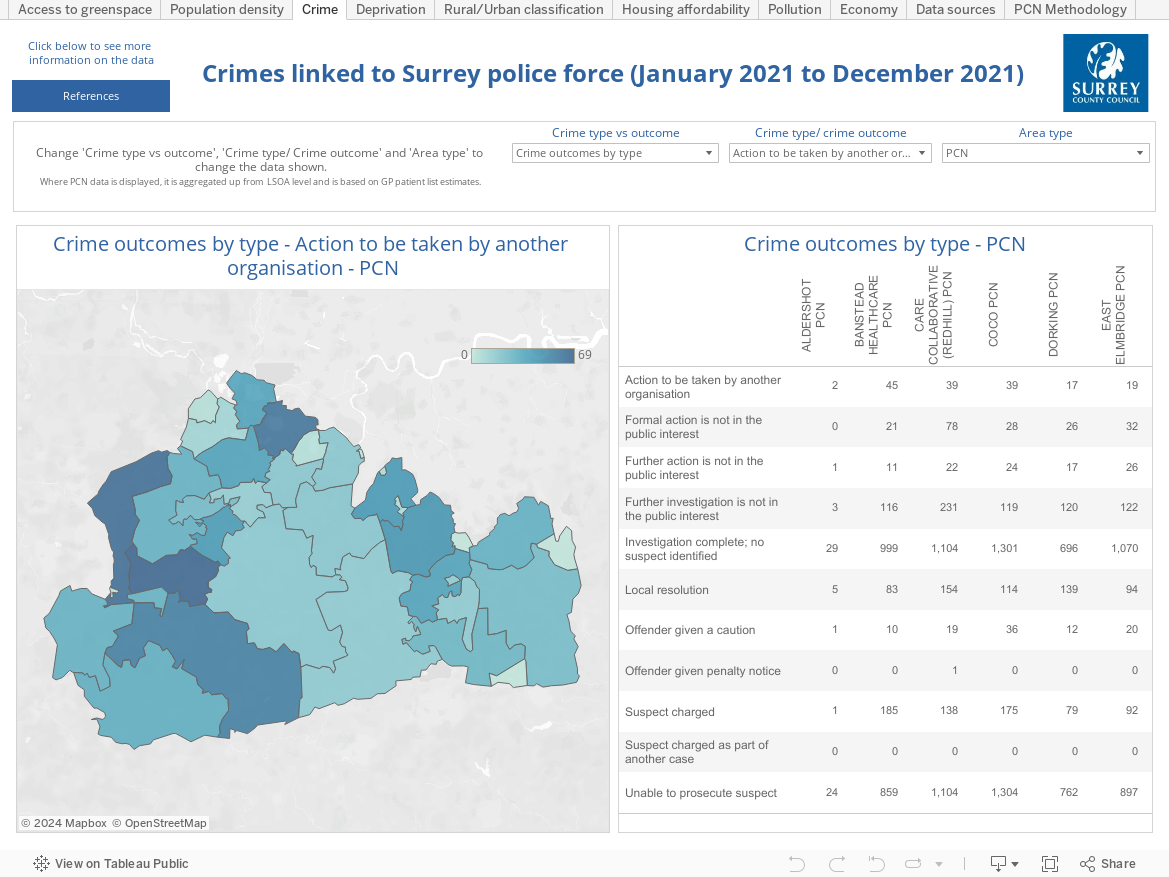
The most common types of crime in Surrey are violent and sexual offenses and anti-social behaviour, and this is also seen at district and borough level. The most common outcomes of crimes are ‘no suspect identified’ followed by ‘unable to prosecute suspect’. The Surrey index can be used to further explore these indicators in Surrey.
Ratio of house price to earning
Please follow the link or explore the ‘housing affordability’ page of the Surrey place tableau dashboard below.
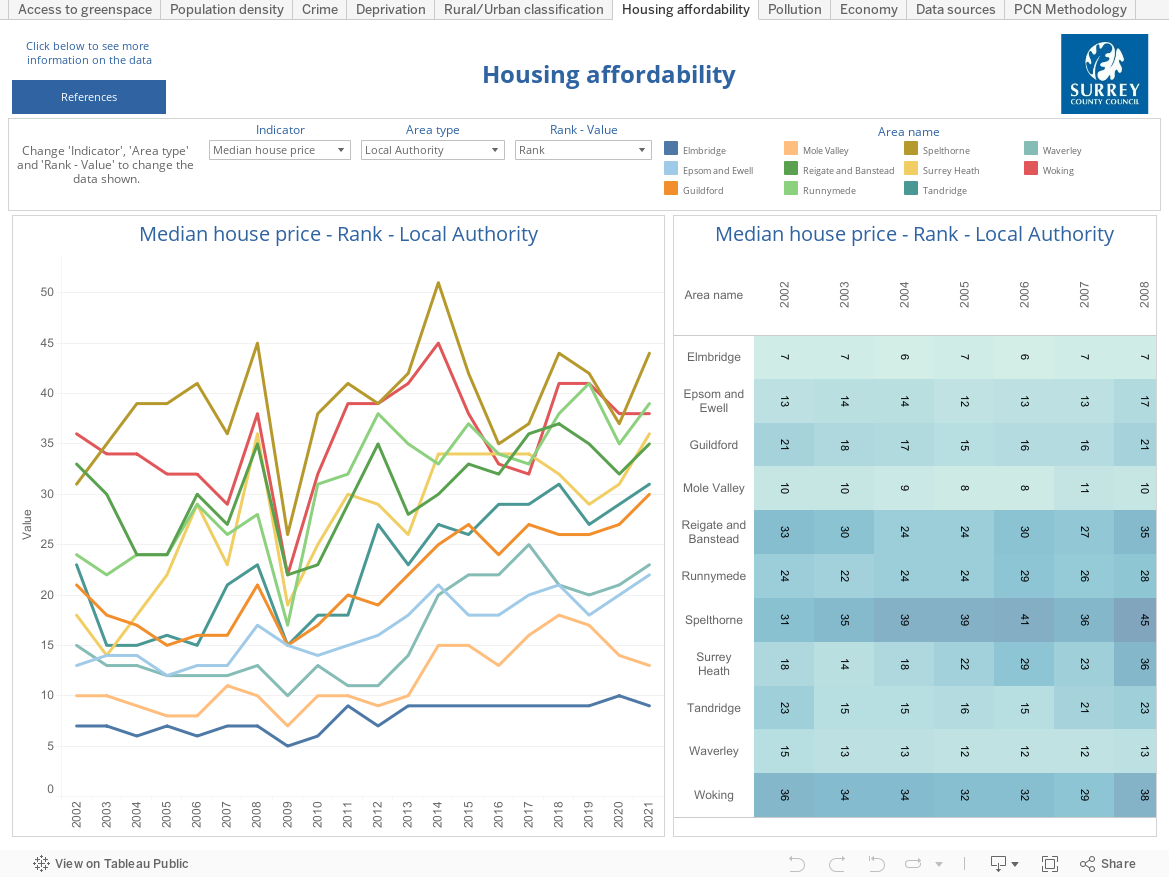
Overall, housing affordability has been decreasing in Surrey since 2002. Median earnings have increased but not at the same rate as house prices. This means people in Surrey are likely to spend longer renting and for those that are able to become homeowners, this is likely to be later in life.
Economy
Please follow the link or explore the ‘economy’ page of the Surrey place tableau dashboard below.
Employment and unemployment
Employment status can affect health outcomes through multiple means including but not exclusively, access to and affordability of healthcare,
In Surrey 73.6% of the population are economically active and 2.8% of those who are economically active are unemployed. Just over a quarter (26.4%) of the population are economically inactive, of which 2% are long term sick or disabled and 12.9% are retired. Runnymede has the highest proportion of economically inactive people (28.4%), and Spelthorne the lowest (24.5%).
The highest number of people on universal credit is in Spelthorne, and the lowest is in Waverley. In 2023, there were 3,604 (15.2%) of 16-17 year olds in Surrey not in education, employment or training (or unknown).
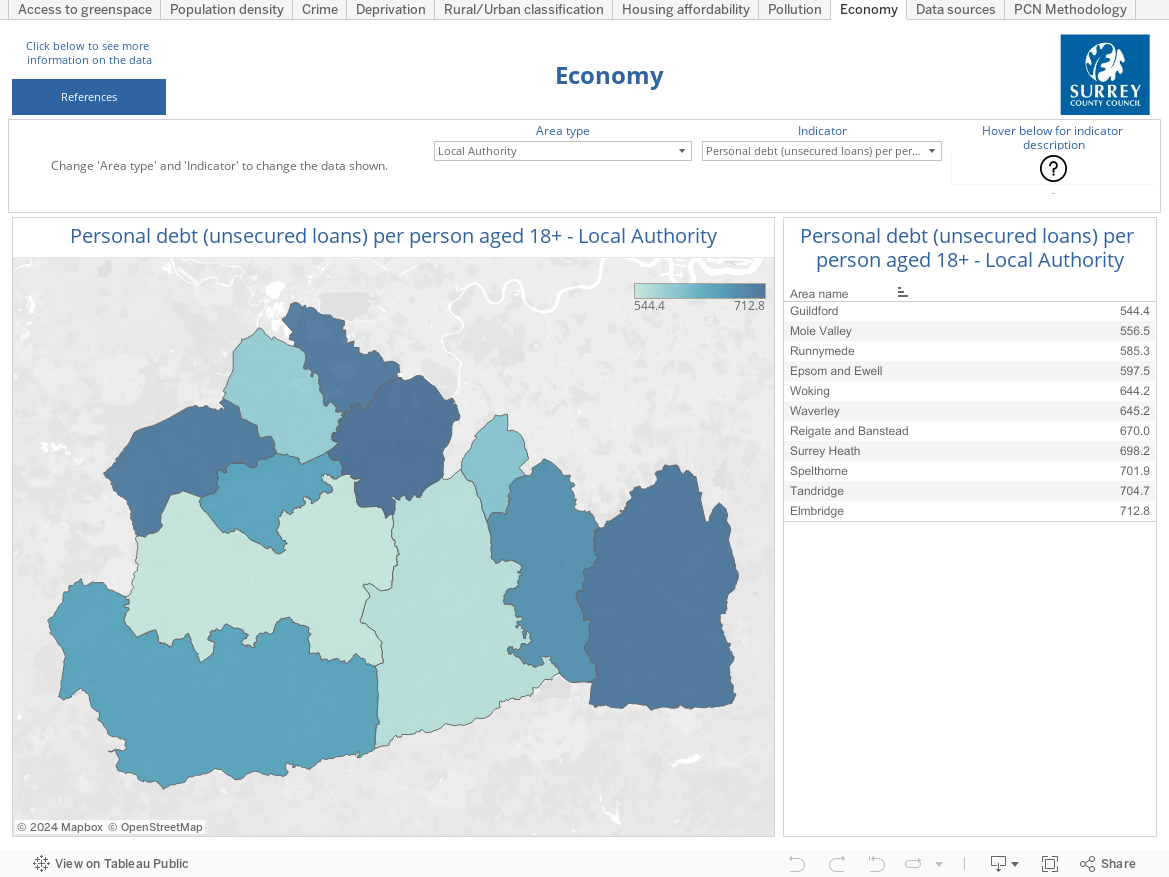
Personal debt
Those with personal debt are more likely to be in poor health due to stress, health-harming behaviours and less access to disposable income to engage in healthy behaviours. Equally when in poor health, debt management can become increasingly difficult.
Average personal debt (unsecured loans) per person aged 18+ in Surrey is £641.20. This is highest in Elmbridge and lowest in Guildford. Being in debt is linked to mental ill-health [3].
Further details on economy in relation to employment in Surrey is provided in the Overview of people (young people out of work) section of this chapter.
Deprivation and Health Inequalities
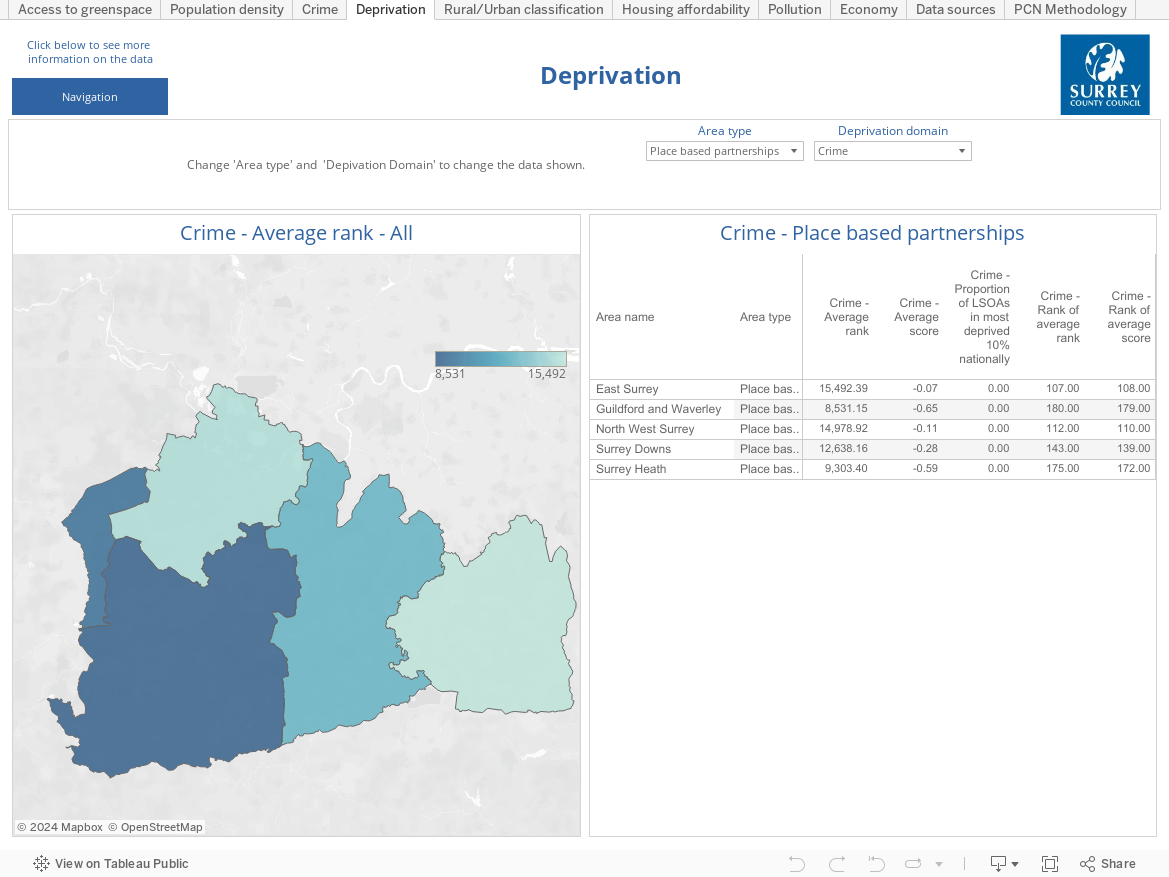
Deprivation
Please follow the link or explore the ‘deprivation’ indicators page of the Surrey place tableau dashboard below. Deprivation can impact life expectancy, healthy life expectancy, morbidity and mortality.
The Index of Multiple Deprivation
The Indices of Deprivation are a unique measure of relative deprivation at a small local area level (LSOA) across England and have been produced by the Ministry of Housing, Communities and Local Government (MHCLG) and its predecessors in similar way since 2000. The Indices of Deprivation 2019 (IoD2019) is the most recent release. The Indices provide a set of relative measures of deprivation for small areas across England, based on seven different domains, or facets, of deprivation.
The Index of multiple deprivation (IMD) is a useful composite measure of the above seven domains, which can be used for identifying localities where health outcomes are likely to remain poorest.
The domains are combined using the following weights (percentages shown in brackets):
- Income Deprivation (22.5%)
- Employment Deprivation (22.5%)
- Education, Skills and Training Deprivation (13.5%)
- Health Deprivation and Disability (13.5%)
- Crime (9.3%)
- Barriers to Housing and Services (9.3%)
- Living Environment Deprivation (9.3%)
There are also two supplementary indicators:
The Income Deprivation Affecting Children Index (IDACI) measures the proportion of all children aged 0 to 15 living in income deprived families. It is a subset of the Income Deprivation Domain which measures the proportion of the population in an area experiencing deprivation relating to low income. The definition of low income used includes both those people that are out-of-work, and those that are in work but who have low earnings (and who satisfy the respective means tests).
The Income Deprivation Affecting Older People Index (IDAOPI) measures the proportion of all those aged 60 or over who experience income deprivation. It is a subset of the Income Deprivation Domain which measures the proportion of the population in an area experiencing deprivation relating to low income. The definition of low income used includes both those people that are out-of-work, and those that are in work but who have low earnings (and who satisfy the respective means tests).
Further summary of the IMD in Surrey is available on Surrey-i Indices of Deprivation 2019 for areas in Surrey
The Surrey place tableau dashboard shows that the majority (68.5%) of LSOAs in Surrey are in in the least deprived deciles 8, 9 and 10. There are no Surrey LSOAs in decile 1 of the overall Index of Multiple Deprivation, and just four (0.6% of areas) in decile 2. These are parts of Westborough and Bellfields and Slyfield (previously Stoke) wards (Guildford), Hooley, Merstham and Netherne ward (Reigate & Banstead) and Canalside ward (Woking).
The figure below shows the proportion of the population in Surrey estimated to live in each of the IMD deciles. Most residents in Surrey live in the most affluent areas in England.
Figure 6: Proportion and estimated number of people living within each deprivation decile in Surrey
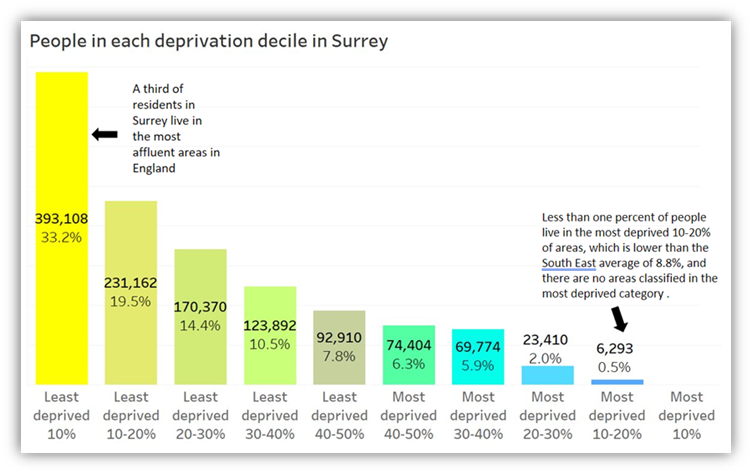
Whilst a small proportion of Surrey residents live in areas that are in the 20% most deprived nationally, it is important that these are recognised through, for example, the key neighbourhoods that are described later in the chapter. [4] Without taking such a focus there is a risk that such inequalities become hidden and are not properly addressed.
Fuel poverty
Data on fuel poverty is available by filtering the ‘deprivation’ page of the Surrey place tableau dashboard to ward level and selecting the fuel poverty indicator.
Fuel poverty in England is measured using the Low-Income Low Energy Efficiency (LILEE) indicator. Under this indicator, a household is considered to be fuel poor if:
- they are living in a property with a fuel poverty energy efficiency rating of band D or below
and
- when they spend the required amount to heat their home, they are left with a residual income below the official poverty line
There are 3 important elements in determining whether a household is fuel poor:
- household income
- household energy requirements
- fuel prices
The latest fuel poverty statistics were created by the Department for Business, Energy & Industrial Strategy using 2023 data. Overall, the South East had a lower proportion of households in fuel poverty (9.6%) compared to England (13.0%).
Subregional statistics were last produced using 2022 data and so may not represent the current levels of fuel poverty.
In subregional analyses, Surrey had smaller proportions of households in fuel poverty (8.3%) than the English average (13.1%) in 2022. All districts and boroughs have seen an increase in fuel poverty, likely associated with rising fuel cost seen in 2022 and the ongoing wider cost of living crisis. Waverley had the highest proportion of households in fuel poverty at 9.34 per cent alongside Guildford with 9.01%, Tandridge 8.95% and Mole Valley 8.85% in fuel poverty . Surrey Heath had the smallest percentage of households in fuel poverty at 6.75 per cent.
At LSOA level, the proportion of households in fuel poverty ranges by 16.43 percentage points from 2.65% in 001F Reigate and Banstead to 19.08% in 002F Runnymede. In Surrey, 24 LSOAs have a higher percentage of households in fuel poverty than the national average. Further detail on fuel poverty in Surrey is available on Surrey-i: Fuel poverty and related statistics
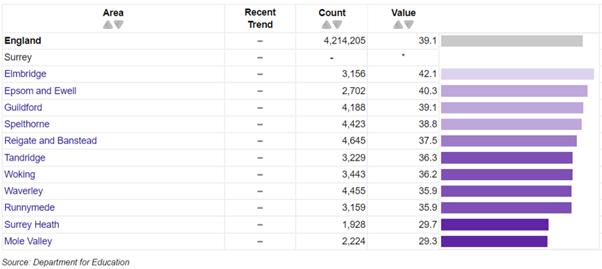
Attainment in children eligible for free school meals
The Free School Meals indicator shows attainment for children eligible for free school meals. Attainment is measured via the Average Attainment 8 measure which is calculated by adding together a student’s highest scores across eight government approved qualifications (including GCSEs and the English Baccalaureate or EBacc). Pupils are at the end of Key Stage 4 (KS4) aged 15-16 and attending state-funded schools in England.
Free school meals (FSM) does not relate to pupils who actually received free school meals but those who are eligible to receive free school meals. Pupils not eligible for free school meals or unclassified pupils are described as ‘All other pupils’.
Most areas in Surrey have a similar average attainment score to England (39.1), except for Surrey Heath (29.7) and Mole Valley (29.3), which are below the England average, while Elmbridge and Epsom & Ewell have scores just above the England average.
Figure 7: Average attainment score among children eligible for FSM (2020/21)

Attainment score data can be found on Fingertips
Children’s education and development of skills are important for their own wellbeing and for that of the nation as a whole. Learning ensures that children develop the knowledge and understanding, skills, capabilities and attributes that they need for mental, emotional, social and physical wellbeing now and in the future. Children with poorer mental health are more likely to have lower educational attainment and there is some evidence to suggest that the highest level of educational qualifications is a significant predictor of wellbeing in adult life; educational qualifications are a determinant of an individual’s labour market position, which in turn influences income, housing and other material resources.
Educational attainment is influenced by both the quality of education children receive and their family socio-economic circumstances. Being on FSM is considered to be a good indicator of socio-economic disadvantage in the UK [5]. Young people in the UK are usually eligible for free school meals (FSM) if their parents or carers are on a low income or in receipt of certain benefits. Children on FSM perform relatively poorly in educational attainment compared to counterparts without FSM [6].
Overview of people in Surrey
In 2020, a series of rapid needs assessments (RNAs) were carried out as part of the Surrey Covid-19 Community Impact Assessment to understand the impacts of the pandemic on key population groups that were identified as having different types of vulnerabilities. Hundreds of community members, people working in frontline services, volunteer and community organisations took part in this process through interviews, focus groups and surveys. The findings from the RNAs formed the basis of the priority population groups incorporated into the Surrey Health and Well-being Strategy and each group will have their own refreshed JSNA chapter.
This section gives a high-level overview of each of the priority populations of identity named in the Surrey Health and Wellbeing Strategy as well as other identified population groups. On average people in this groups experience poorer than average health access, experience and/or outcomes.
Some JSNA chapters are currently being updated and where an existing JSNA chapter has been published, a link is provided to take you to the full chapter. Links are also provided to the relevant RNAs.
The below are HWB strategy / surrey Heartlands Integrated care strategy priority populations
Adults with learning disabilities and adults with autism
In 2019/20 the number of adults diagnosed with learning disabilities in Surrey was 5,616 (0.4%).
In 2021 the number of people in Surrey Heartlands CCG who self-reported having a learning disability was 1.1%.
An Adults and Children with Learning Disabilities Rapid Needs Assessment Rapid Needs Assessment was undertaken as part of the Surrey Covid-19 Community Impact Assessment.
A JSNA chapter on people with learning disabilities has been published with high level insights on this topic. A further chapter on Neurodiversity is also planned.
Children and young people with additional needs and disabilities
In Surrey 4,565 (2.86%) children in school have Special Educational Needs (SEN).
An Adults and Children with Learning Disabilities Rapid Needs Assessment was undertaken as part of the Surrey Covid-19 Community Impact Assessment.
A JSNA chapter on children and young people with additional needs and disabilities has been developed and provides high level insights on this topic.
Young people out of work
Please follow the link or explore the relevant indicators on the ‘economy’ page of the Surrey place tableau dashboard below.
A Young people out of work Rapid Needs Assessment was undertaken as part of the Surrey Covid-19 Community Impact Assessment.
Looked after children and People with care experience
In 2021 there were 996 children in care in Surrey (38 per 10,000 of the population under 18 years old).
Surrey’s aim to enable the system of support to realise better outcomes for children and young people is outlined in the Sufficiency Strategy for Looked After Children, Care Leavers and Children on the Edge of Care 2020-2025.
People with long term health conditions, disabilities or sensory impairment
Please follow the link or explore the Long term disease tableau dashboard below.

The Quality and Outcomes Framework (QOF) reports prevalence of several long-term health conditions at various geographies across England. Below is a table showing six long-term health conditions where the data is published at county level. QOF prevalence data have been compared for 2020/21 to 2023/24 values for Surrey, the South East and England.
Table 7: QOF Prevalence of long-term health conditions
| Indicator | Surrey 2020/21 |
Surrey 2023/24 | Surrey Change |
South East 2020/21 | South East 2023/24 | South East Change | England 2020/21 | England 2023/24 | England Change |
| Hypertension | 13.1% | 14.0% | 0.9% | 14.1% | 15.0% | 0.9% | 13.9% | 14.8% | 0.9% |
| Stroke | 1.6% | 1.7% | 0.1% | 1.8% | 1.9% | 0.1% | 1.8% | 1.9% | 0.1% |
| Diabetes | 5.7% | 6.2% | 0.5% | 6.5% | 7.1% | 0.6% | 7.1% | 7.7% | 0.7% |
| Coronary Heart Disease | 2.6% | 2.7% | 0.1% | 2.8% | 2.8% | 0.0% | 3.0% | 3.0% | 0.0% |
| Osteoporosis | 0.9% | 1.2% | 0.3% | 1.0% | 1.4% | 0.4% | 0.8% | 1.1% | 0.3% |
| Rheumatoid Arthritis | 0.7% | 0.7% | 0.0% | 0.8% | 0.8% | 0.0% | 0.8% | 0.8% | 0.0% |
Hypertension saw the largest change in prevalence. In the 2023/24 QOF period, the prevalence of hypertension across registered patients in Surrey GP practices was 14% (182,801 people) compared to 15% across the South East and 14.8% across England. In the 2020/21 QOF period prevalence of hypertension was 13.1% (166,745 people), this equates to a 0.9% increase in Surrey. This is in line with the change observed in the South East and England.
Across Surrey, Mole Valley Local Authority had the highest prevalence of hypertension in 2023/24 with a value of 16.2%, Guildford had the lowest prevalence with a value of 12.1%.
No conditions saw a decrease in their prevalence. Prevalence on rheumatoid arthritis remained static at 0.7% in surrey, and 0.8% in the South East and England. Only small increases were observed in coronary heart disease (0.1% in Surrey and static in South East and England) and stroke prevalence (increased by 0.1% in Surrey, South East and England).
The Royal National Institute of Blindness (RNIB) estimates that across Surrey in 2022, 43,100 people are living with sight loss, this figure is made up of 38,280 people living with partial sight and 5,850 living with blindness[7]. This equates to 3.6% of the Surrey population living with sight loss compared to a national value of 3.3%. By 2032 it is predicted that 51,000 people across Surrey will be living with sight loss. A summary of the main health conditions contributing to this increasing level of sight loss across Surrey can be found below.
Table 8: Estimated number of people living with sight threatening eye conditions
| Cause | 2022 | 2032 |
| Early-stage Age-related Macular Degeneration (AMD) | 55,700 | 64,000 |
| Late-stage dry AMD | 4,360 | 5,290 |
| Late-stage wet AMD | 8,970 | 11,000 |
| Total late state AMD | 12,600 | 15,500 |
| Cataract | 13,900 | 16,900 |
| Ocular hypertension | 25,200 | 25,800 |
| Glaucoma | 13,400 | 15,500 |
| Diabetes | 79,200 | 84,200 |
| Diabetic retinopathy | 23,500 | 24,300 |
| Severe retinopathy | 2,160 | 2,240 |
Older people (80+) and people in care homes
Please follow the link or explore the Older people and people in care homes tableau dashboard below.
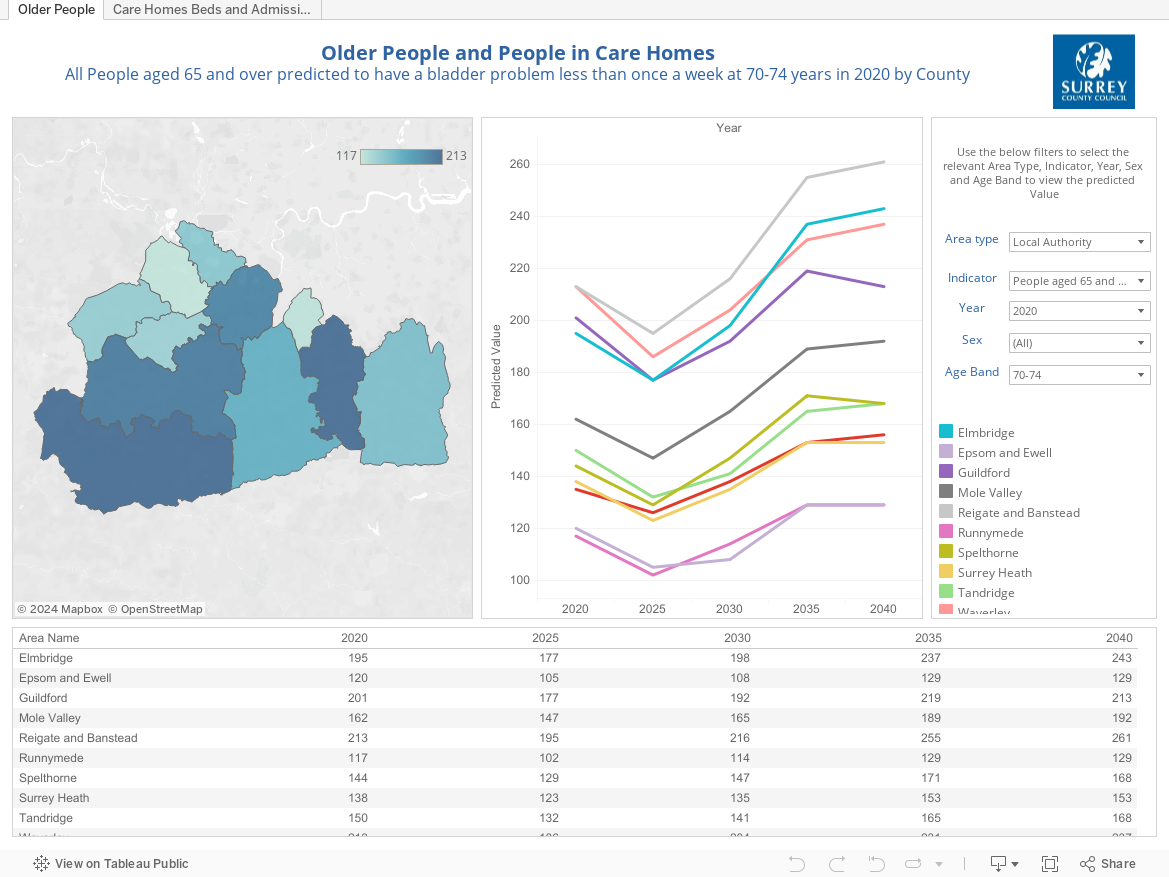
In 2020 in Surrey, males over the age of 80 years account for 2.36% (28,399 people) of the population compared to 2.06% in England. Females over the age of 80 years make up 3.43% (41,094 people) of the population compared to 2.99% in England.
Surrey’s older population is expected to increase to 49,109 males over 80 years old and 64,119 females over 80 years old by 2043. This has important implications for social care provision as the likelihood of being disabled and/or experiencing multiple chronic and complex health conditions among those aged 65 years and over increases with age[8]. In 2020/21, there were 1,067 admissions to care homes, a rate of 464 per 100,000 of the population aged 65 years and older.
Ratings of personal well-being are lowest around mid-life but then start to rise around ages 60 to 64 years, peaking between the mid-60s and mid-70s before starting to decrease with age.
Needs assessments on Residential Care and Older People who were Shielding, had Chronic Illnesses and/or Physical Disabilities were undertaken as part of the Surrey Covid-19 Rapid Needs Assessments.
Carers and young carers
Please follow the link or explore the Carers tableau dashboard below.
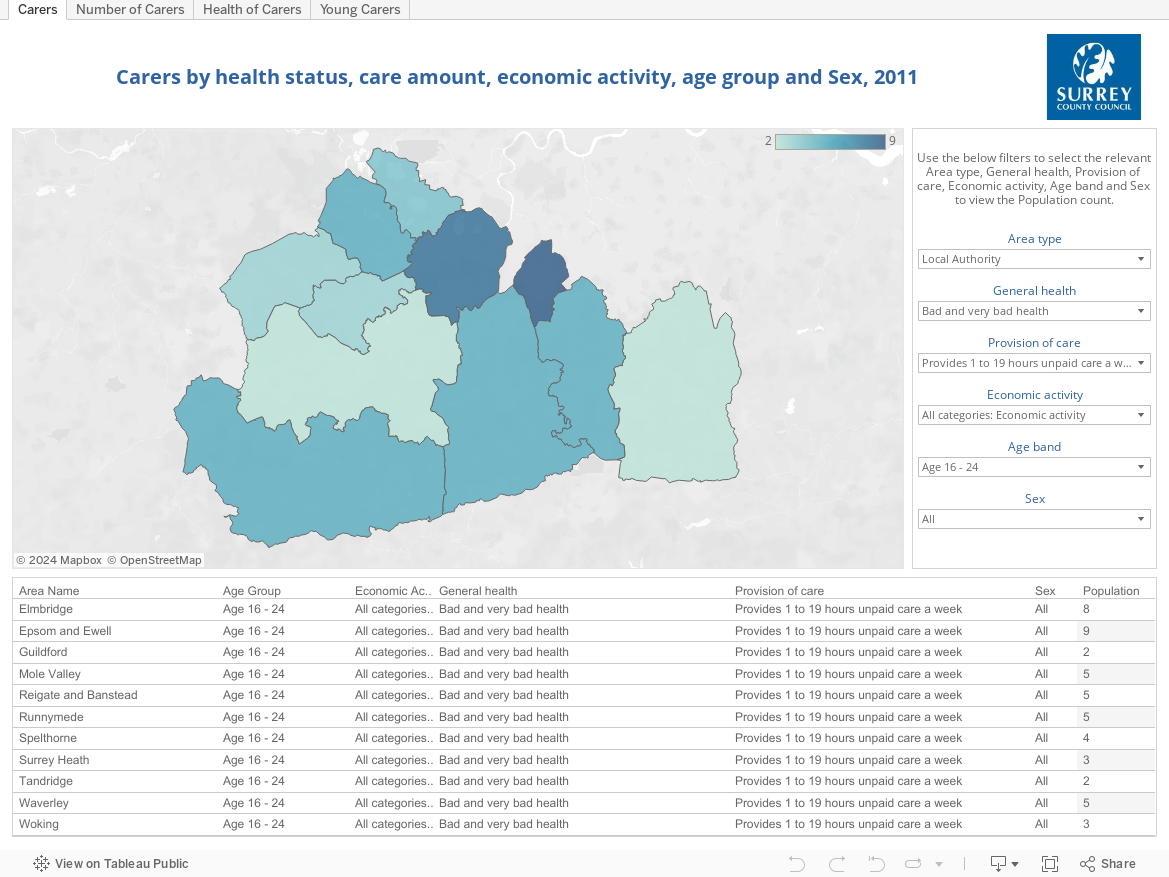
According to the 2021 Census, 90,497 (7.5%) Surrey residents reported that they provide unpaid care. The proportion has changed since 2001 and 2011 when 9.4% and 9.6% respectively were providing care. This change may be a result of the covid-19 pandemic restrictions. Most carers are providing less than 20 hours per week, but 15,059 are providing 20 to 49 hours per week and 23,469 are providing more than 50 hours per week.
The 2021 Census asked people to rate their general health as either ‘very good’, ‘good’, ‘fair’, ‘bad’ or ‘very bad’. Generally, the self-rated health of unpaid carers deteriorated with the amount of unpaid care that they provided. Compared with people providing no unpaid care, those providing 50 hours or more of unpaid care a week were two to three times more likely to report their general health as not good (i.e. fair, bad or very bad). This trend is broadly seen in Surrey, however the difference in reported bad or very bad health in those who provide unpaid care and those who don’t reduces in the older age groups.
In Surrey, 2.1% of the population provide more than 50 hours unpaid care. Spelthorne has the highest proportion of the population providing this much care (2.4%), and Elmbridge has the lowest (1.8%).
There are proportionally fewer young carers (under 24 years old) in Surrey compared to the South East and England. The proportion of young carers aged 0 – 15 years old are highest in Woking and Waverley and lowest in Tandridge.
The Surrey Carers Strategy 2021 to 2024 sets out local aims and priorities and the young carers joint strategy (across the County Council and NHS) has been extended until 2026. More information about unpaid care can be found on Surrey-i.
People experiencing homelessness
Please follow the link or explore the Homelessness tableau dashboard below.

Statutory homelessness is used to describe a household when a local authority decides that that the occupiers of the home do not have a legal right to occupy accommodation that is accessible, physically available and which would be reasonable for the household to continue to live in[9]. Comparing the years 2008 with 2017 the rate of statutory homelessness per 1,000 households has stayed relatively consistent in England, values of 2.48 and 2.41. Looking at the same metric across Surrey there has been a sharp increase across the same period, in 2008 the rate was 0.35 per 1,000 households and in 2017 it was 1.34 per 1,000 households.
Looking at statutory homelessness on a district and borough level shows a great deal of variation across Surrey. In 2017 the highest rate of 2.87 per 1,000 households was seen in Spelthorne, during the same year the lowest rate was seen in Guildford with a value of 0.38 per 1,000 households. The rate is roughly seven times higher in Spelthorne than it is in Guildford.
The Homelessness Reduction Act (HRA) 2017 introduced new prevention and relief duties, that are owed to all eligible households who are homeless or threatened with becoming homeless, including those single adult households who do not have ‘priority need’ under the legislation. These meant significantly more households are being provided with a statutory service by local housing authorities[10]. One metric related to this is the number of households owed a duty (statutory service) under the HRA per 1,000 estimated households. In 2019 the England rate was 12.25 per 1,000 households, dropping to 11.34 in 2020. Across Surrey the value in 2019 was 7.78 per 1,000 households, dropping to 6.68 in 2020. Surrey’s rate in both 2019 and 2020 was lower than the South East values of 10.58 and 9.87 respectively.
Looking at the same metric as above at a district and borough level there is again a large difference between the areas with the highest and lowest values. In 2020 the district/borough in Surrey with the highest value was Spelthorne where the rate was 9.5 per 1,000 households. The area with the lowest value was Surrey Heath where the rate was 4.2 per 1,000 households.
A Homelessness Rapid Needs Assessment was undertaken as part of the Surrey Covid-19 Rapid Needs Assessments.
People experiencing domestic abuse
Please follow the link or explore the Domestic Abuse tableau dashboard below.
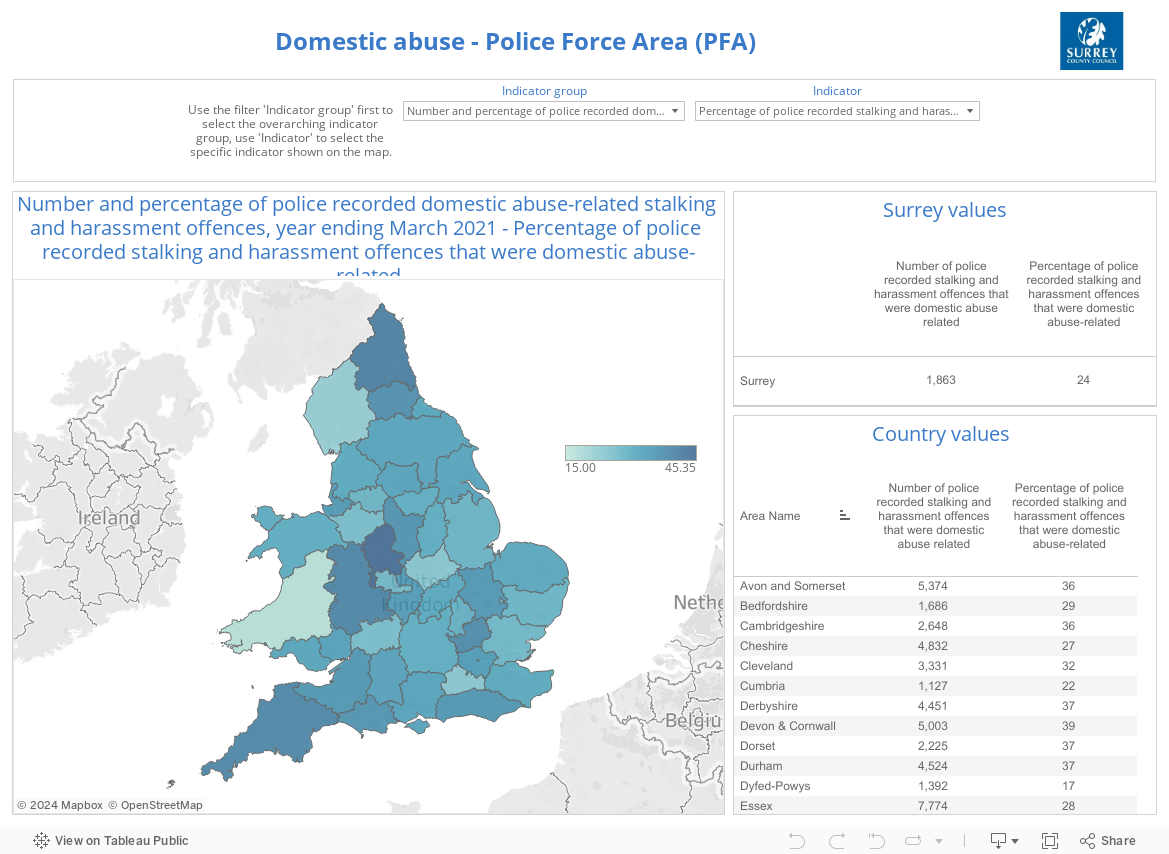
In Surrey, 10,125 domestic abuse related crimes were recorded by Surrey Police in the year to 31st December 2023.This rate is lower than the South East and England, at 21 and 24 per 1,000 population respectively. In 2022/23 there were 10,125 domestic abuse-related incidents and crimes were recorded. The rate of domestic abuse crimes and the proportion of all crimes that are domestic abuse related in Surrey are also low compared to other police areas across the country.
Women experiencing domestic abuse are more likely to experience a mental health problem, while women with mental health problems are more likely to be domestically abused, with 30-60% of women with a mental health problem having experienced domestic violence[11].
Domestic violence is associated with depression, anxiety, PTSD and substance abuse in the general population[12].
Exposure to domestic abuse has a significant impact on children’s mental health. Many studies have found strong links with poorer educational outcomes and higher levels of mental health problems[13].
The Surrey Against Domestic Abuse Strategy 2014-2029 outlines local priorities and actions. A Domestic Abuse Rapid Needs Assessment was also undertaken as part of the Surrey Covid-19 Rapid Needs Assessments.
People with serious mental illness
In 2020/21, 9,343 (0.73%) people in Surrey had been diagnosed with Serious Mental Illness (SMI). Where SMI are mental health problems so significant, they impact a person’s functional ability as well as their ability to work, attend education or in other ways achieve their potential.
A Mental Health Rapid Needs Assessment was undertaken as part of the Surrey Covid-19 Community Impact Assessment.
A JSNA chapter on mental health has been published here: Emotional and Mental Wellbeing in Surrey Adults
People with drug and alcohol problems
Please follow the link or explore the Substance Use Adults tableau dashboard below.
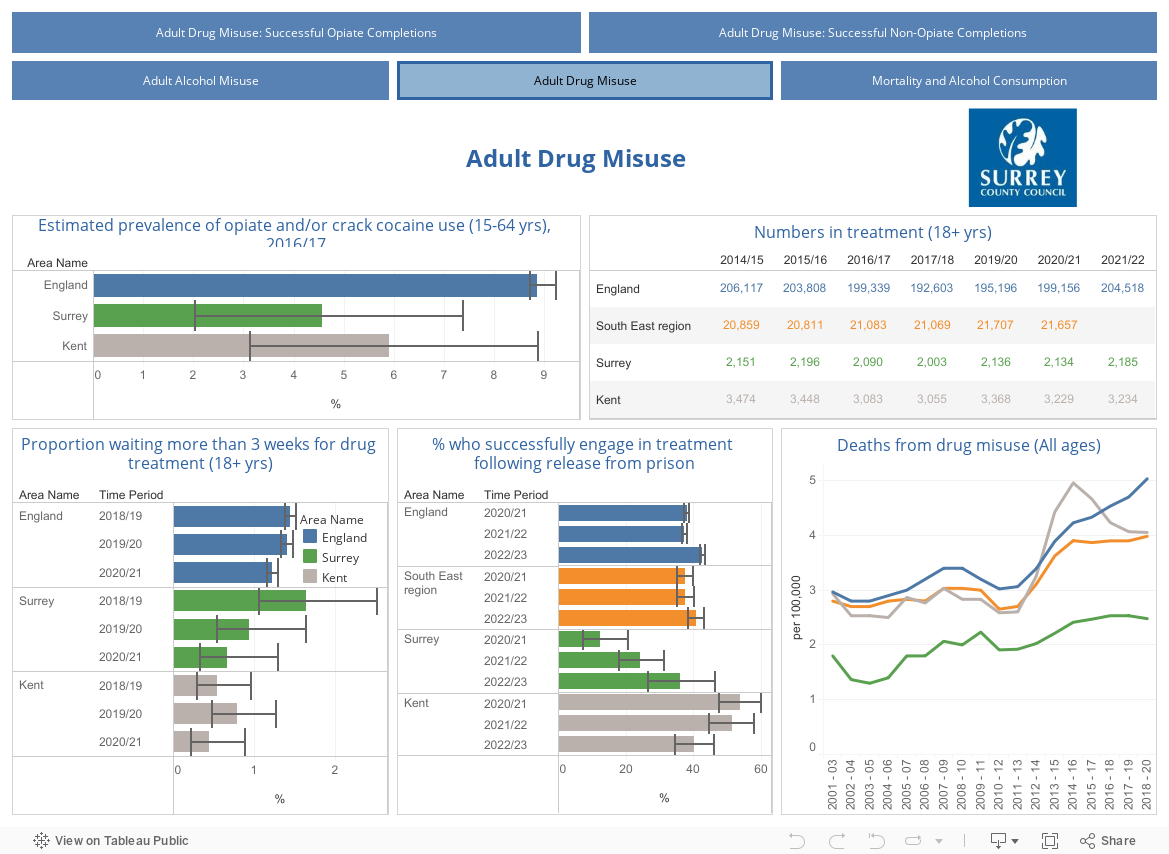
Following an overall downward trend from 2009/10 in the number of adults in substance misuse treatment in Surrey, an increase has been seen between 2017/18 and 2020/21. However, this is in the context of unmet need ranging from 54% of opiate users to 79% of alcohol users[14]. In 2020/21, 2,134 people in Surrey received in patient treatment for drug misuse and there were 3,954 admissions to hospital for an alcohol related condition.
Drug misuse and dependency can lead to a range of harms for the user including:
- poor physical and mental health and ultimately death
- unemployment
- homelessness
- family breakdown
- criminal activity[15]
The Surrey Substance Misuse Strategy sections on Drugs and Alcohol were refreshed in 2019. A Young People and Substance Misuse Rapid Needs Assessment was undertaken as part of the Surrey Covid-19 Community Impact Assessment.
Minoritised ethnic group
Please follow the link to explore the ‘Religion, language and ethnicity’ page of the Surrey population tableau dashboard as this covers the data on population groups from minority ethnicities in Surrey. The dashboard also allows users to explore the data for health-based geographies including PCNs, place-based partnerships and ICS.
Surrey is less diverse than England as a whole and the older population is less diverse than the younger cohorts in Surrey; the majority of people aged 65 and older are white British with under 3% from other ethnic groups. The highest proportion of Asian ethnicities (other than Indian and Pakistani) are in young adults aged 16-24 and the proportion of mixed/multiple ethnic groups is highest among children under 16.
Although the proportion of the population from minority ethnic groups is smaller in Surrey than in the country as a whole, it is essential to work across partner organisations to ensure that the needs of these small communities and individuals are appropriately met. Some minority ethnic groups may be seldom heard because of language or differences in culture which contribute to inequalities. The movement of Gypsy, Roma and Traveller people may also influence the ability of health services to reach and meet needs of this group. Levels of trust in different communities regarding healthcare and providers, different cultural patterns and behaviours may influence the experience of health and social care services for residents from different ethnicity groups in Surrey.
A Black, Asian and Minority Ethnic (BAME) Rapid Needs Assessment was undertaken as part of the Surrey Covid-19 Rapid Needs Assessments.
Gypsy, Roma and Traveller Communities
The term Gypsy, Roma and Traveller (GRT) has been used to describe a range of ethnic groups or people with nomadic ways of life who are not from a specific ethnicity. These groups are distinct, but are often reported together. In the UK, it is common in data collections to differentiate between:
- Gypsies (including English Gypsies, Scottish Gypsies or Travellers, Welsh Gypsies and other Romany people)
- Irish Travellers (who have specific Irish roots)
- Roma, understood to be more recent migrants from Central and Eastern Europe
Further details are available in the summary: Gypsy, Roma and Irish Traveller ethnicity summary – GOV.UK Ethnicity facts and figures (ethnicity-facts-figures.service.gov.uk).
It is widely believed that the Gypsy, Roma and Traveller community is under reported in the Census. The April 2019 House of Commons Women and Equalities Select Committee report on inequalities faced by Gypsy, Roma and Traveller communities noted that there was a lack of data on these groups. For the first time, the 2011 Census ethnic group question included a tick box for the ethnic group ‘Gypsy or Irish Traveller’ and the 2021 Census had a ‘Gypsy or Irish Traveller’ category, and a new ‘Roma’ category.
Data about Gypsy, Roma, and Traveller groups in Surrey is summarised from the 2021 census on surrey-i. In Surrey, a small proportion (0.2%) of the population (2,680 people) described themselves as White: Gypsy or Irish Traveller, and 1,675 (0.1%) described themselves as White: Roma in the 2021 Census. GRT communities have the poorest health outcomes of any ethnic groups, not only in the UK but internationally[16].
A Gypsy, Roma and Traveller Rapid Needs Assessment was undertaken as part of the Surrey Covid-19 Rapid Needs Assessments.
Other Priority Populations of identity:
Although the following groups are not currently listed as priority populations within the health and wellbeing strategy in Surrey, it is important for the JSNA to consider the needs of these groups when thinking about the population of Surrey and the needs of these groups when thinking about the population of Surrey and the needs of residents.
People in contact with the criminal justice system
In September 2018 there were 2,592 people in prison in Surrey. The five prisons in Surrey are:
- HMP & YOI Bronzefield: a privately run female prison in Ashford.
- HMP Coldingley: a prison for adult men in Woking.
- HMP & YOI Downview: a prison and young offender institution (YOI) in Sutton, for women aged 18 and over.
- HMP High Down: a men’s prison and young offender institution (YOI) near Sutton.
- HMP Send: a women’s prison in Woking.
Please see the Health Needs Assessments for the individual prisons for more information.
Students
There were 201,993 pupils registered in Surrey in 2021/22. Just under 1 in 5 Surrey pupils attend an independent school.
Just under half (46%) of Surrey pupils attend state-funded primary schools (Key Stages 1 to 2 which take place from ages 5 to 11). Just under 1 in 3 (32%) of pupils in Surrey are from state-funded secondary schools (Key Stages 3 to 4 which take place from ages 12 to 16).
The number of Surrey pupils in state-funded special schools increased by 8 per cent (223 pupils) in the last year. The number of pupils in state-funded special schools rose by 44 per cent in the last six years between 2015/16 to 2021/22 (from 2,024 to 2,911). Further detail on schools and students in Surrey is kept up to date and available on Surrey-i Number of schools and pupils by type of school.
There are four higher education establishments in Surrey; Surrey University in Guildford, Royal Holloway University in the borough of Runnymede, the University of Creative Arts which has campuses in Epsom and Farnham. (Royal Holloway, and the Farnham campus of the University of Creative Arts are outside the area covered by Surrey’s Health and Wellbeing Board) and the Academy of Contemporary Music in Guildford. Despite this Surrey is a net exporter of students, with the out of term time population almost 5,000 higher than during term time.
Armed forces & veterans
At the time of the 2021 Census, there were 32,596 residents of Surrey who had previously served in the armed forces which represented 3.4 percent of the Surrey population aged 16 and over. Around every 1 in 40 Surrey residents aged 16 or over were veterans of the regular UK armed forces (2.4%, representing 23,769 persons).
Just under three quarters of UK armed forces veterans residing in Surrey had previously served in the regular armed forces only (23,769, 72.9%), while 7,404 (22.7%) had served only in the reserve armed forces. The remaining 1,423 (4.4%) had served in both the regular and the reserve armed forces.
Of the UK armed forces veteran population in Surrey, 96.5 per cent lived in households and 3.5 per cent lived in communal establishments (including Guildford (Pirbright Barracks) and Surrey Heath (Deepcut Barracks)). A higher percentage of Surrey veterans lived in communal establishments on Census Day than veterans in the whole of England (2.0%).
The veteran population also had a much higher percentage who lived in communal establishments than the overall Surrey population (including non-veterans) at 2.3 per cent, whilst England had similar proportions for the veteran and the overall population.
Please see the summary Census 2021: UK Armed Forces Veterans | Surrey-i (surreyi.gov.uk) and the Armed Forces Community JSNA chapter for more information.
People in the LGBTQIA+ community
The 2022 ONS data found 1.3% of people in the South East identified as gay or lesbian, 1.4% bisexual, 0.5% responded other and 2.2% answered don’t know or declined to answer. This is a similar picture to what was seen nationally. Evidence suggests LGBTQIA+ people have disproportionately worse health outcomes and experiences of healthcare[17].
Chapter acknowledgements and contributions
Project supervisor: Negin Sarafraz-Shekary
Authors: Katie Patrick, Cassandra Ranatunga, Conor Woolley, Lauren Ashley
Data team: Conor Woolley, Minerva Lemonidou, Lorenzo Reitano, Beth Griffiths
Glossary
CCG Clinical Commissioning Group
DEFRA The Department for Environment, Food and Rural Affairs
HRA Homelessness Reduction Act
HWB Health and Wellbeing Board
ICB Integrated Care Board
ICS Integrated Care System
IMD Index of Multiple Deprivation
JSNA Joint Strategic Needs Assessment
LA Local Authority
LILEE Low-Income Low Energy Efficiency
LSOA Lower layer super output area
MHCLG Ministry of Housing, Communities and Local Government
MSOA Middle layer super output area
NHS National Health Service
NHSE NHS England
OHID The Office for Health Improvement and Disparities, formerly PHE
ONS Office for National Statistics
PCN Primary care networks
PHE Public Health England
RNIB Royal National Institute of Blindness
UKSHA UK Health Security Agency
VCSE Voluntary and Community Sector
References
[1] WHO Europe Urban green spaces and health: A review of evidence
[2] Public Health England Improving outdoor air quality and health: review of interventions
[3] Jenkins R, Bhugra D, Bebbington P, Brugha T, Farrell M, Coid J, Fryers T, Weich S, Singleton N, Meltzer H. Debt, income and mental disorder in the general population. Psychol Med. 2008 Oct;38(10):1485-93. doi: 10.1017/S0033291707002516. Epub 2008 Jan 10. PMID: 18184442.
[4] Core 20 Plus 5 supporting document: Core 20 Plus 5: An Approach to Reducing Health Inequalities
[5] HE provider Good Practice briefing for students in receipt of free school meals [accessed 14/03/22]
[6] Sutton Trust: 6 findings from the latest EEF Report on the Attainment Gap [accessed 14/03/22]
[8] CQC: The state of adult social services 2014 to 2017
[9] Ministry of Housing, Communities & Local Government Statutory Homelessness, October to December (Q4) 2018
[10] Homelessness Reduction Act 2017
[11] Howard, L.M., Trevillion, K., Khalifeh, H., Woodall, A., Agnew-Davies, R., & Feder, G. (2009). Domestic violence and severe psychiatric disorders: Prevalence and interventions. Psychological Medicine, 40(6), 881–893. DOI: 10.1017/S0033291709991589
[12] Trevillion, K., Oram, S., Feder, G., & Howard, L.M. (2012). Experiences of domestic violence and mental disorders: A systematic review and meta-analysis. PLOS One, 7, e51740.
[13] Gilbert, R., Kemp, A., Thoburn, J., Sidebotham, P., Radford, L., Glaser, D., & MacMillan, H. (2009). Recognising and responding to child maltreatment. The Lancet, 373(9658), 167–180.
[14] NDTMS Adult profiles: Adults in treatment
[15] Public Health England Health matters: preventing drug misuse deaths
[16] UK Parliament Achieving better health outcomes for Gypsy, Roma and Traveller communities