Health Inequalities
Health Inequalities
Health inequalities are avoidable, unfair, and systematic differences in health between different groups of people. There are many kinds of health inequality, and many ways in which the term is used. This means that when we talk about ‘health inequality’, it is useful to be clear on which measure is unequally distributed, and between which people.
Health inequalities ultimately relate to differences in the status of people’s health, but the term is also used to refer to differences in the care that people receive and the opportunities they have to lead healthy lives – both of which can contribute to their health status. Health inequalities can therefore involve differences in:
- health status (for example: life expectancy)
- knowledge and awareness of unhealthy behaviours, available care and treatment
- access to care (for example: availability of given services)
- quality and experience of care (for example: levels of patient satisfaction)
- behavioural risks to health (for example: smoking rates)
- wider determinants of health (for example: quality of housing).
The King’s Fund have created a webpage to help people understand what health inequalities are:
What are health inequalities? (The King’s Fund)
Addressing and reducing Health inequalities is a key priority for our Surrey Health and Wellbeing Board which includes a range of partners including Surrey County Council, the Surrey Borough and District Councils, Surrey Heartlands Integrated Care System, Surrey Police, and our associated public and voluntary sector partner organisations and community groups. The Surrey Health and Wellbeing Strategy is a good starting point for information on the coordinated activities that are underway to achieve this aim and provides a helpful partnership focus on priority populations which includes communities of identity and geography which are often overlooked and currently most at risk of experiencing poor health outcomes.
There is therefore an increasing appetite for data and information resources that help describe the range and scale of health inequalities in the county, and some key links to useful health inequalities datasets, reports and resources are given below:
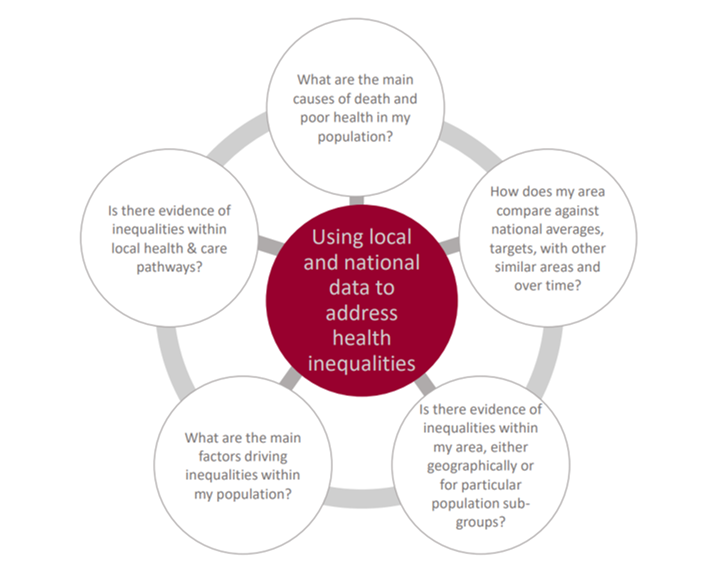
Key questions to ask to understand health inequalities
Figure 1: Using local and national data to address health inequalities
National health inequalities data sources
Table 1: Health inequalities, National data sources
| Resource | Purpose | Areas covered | Key indicators available |
| Fingertips Local Inequalities Explorer Tool 2023 | To support decision making by demonstrating local, within-area, inequalities | Ward, Integrated Care Board, County | Life expectancy, Income Deprivation, Association with deprivation, disease burden, and area variation in relation to IMD |
| National Health Inequalities Improvement Dashboard (HIID) | Focus on the five urgent actions and Core 20 Plus 5 | Integrated Care Partnership, Sustainability & Transformation Partnerships, NHS Regions | Five clinical areas of Core 20 Plus 5 |
| OHID segmentation tool | Present causes of death and age groups driving life expectancy gap | England, Regions, Local authorities, NHS regions, Previous Clinical Commissioning Groups, Sustainability and Transformation Partnerships | Breakdown of life expectancy gaps between local authorities and England, and between most and least deprived within each area, by cause of death and age group |
| Fingertips Wider Determinants of Health | Describes wider determinants of health | England, Regions, Counties, Unitary Authorities, PHE Centre, Local authorities (districts and boroughs), Deprivation deciles | Natural and built environment, work and the labour, market, vulnerability, income, crime, education, and Marmot indicators |
| OHID Local Health Mapping Tool | Quality assured small area health-related data visualised in maps, charts, area profiles, and reports | England, Regions, Local authorities (districts and boroughs), Wards, LSOAs, MSOAs, UTLAs, LTLAs, Previous Clinical Commissioning Groups | Community/population profiles, behavioural risk factors, child health, disease and poor health, life expectancy and cause of death |
| Public Health Outcomes Framework | Range of public health indicators and population health outcomes | England, Regions, Counties, PHE Centre, Local authorities (districts and boroughs), Combined Authorities, Sustainability & Transformation Partnerships, Integrated Care Board, Deprivation deciles | Life expectancy and healthy life expectancy, wider determinants, health improvement, health protection, healthcare and premature mortality |
| Strategic Health Asset Planning and Evaluation (SHAPE) Tool | Maps location of healthcare services against population health metrics, includes travel time and impact analysis (Access by registration) | Place based partnerships, Hospitals, Local authorities (districts and boroughs), LSOAs, Integrated care partnerships | Population demographics e.g. IMD and population change, health outcomes, environmental data, journey times |
| Global Burden of Disease | To compare diseases, injuries, and risk factors to show most important contributors to health loss | UK (and its constituent countries), English regions (former Government Office), English counties and unitary authorities | Synthetic estimates of most common diseases, injuries and risk factors, expressed as prevalences, incidences, Disability Adjusted Life Years, Years of Life Lived with Disability, and Deaths |
| Atlas of variation | Helps to identify variation and assess the value that healthcare provides to both populations and individuals. | 10 hospital-based indicators | Covering the four subject areas: outpatients, cataract surgery intravitreal injections, retinal detachments |
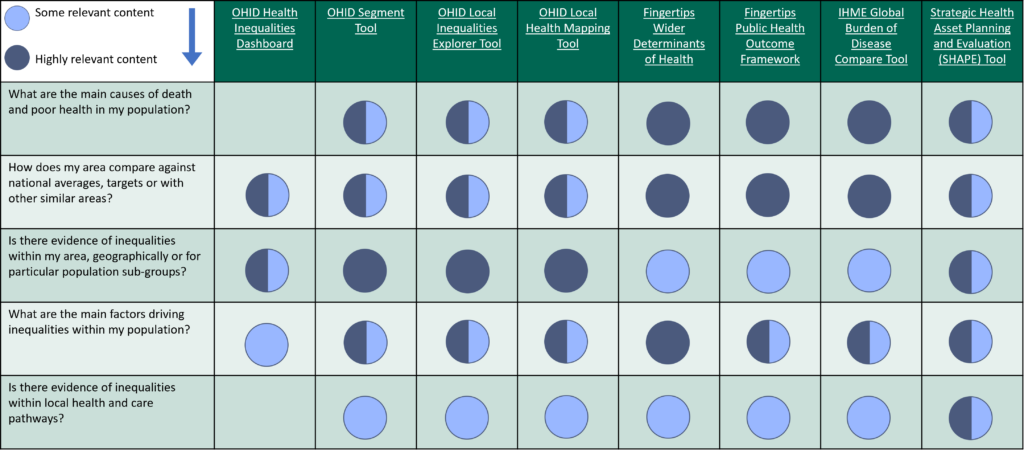
Table 2: National health intelligence tools to support work on inequalities
Local health inequalities data sources: population
The Surrey Health and Well-Being Strategy – update 2022 | Healthy Surrey focuses on delivering key outcomes within our priority populations which are often overlooked and currently most at risk of experiencing poor health outcomes. The table below summarises some key data sources related to population.
National Framework for NHS Action on Inclusion Health: Launch of the South East OHID Inclusion Health Datapacks and the Regional Public Health Group Webinar Recording
The ‘South East Office of Health Improvement and Disparities (OHID) Inclusion Health Integrated Care System (ICS) Datapacks’ are intended to provide a one-off summary of available data and evidence for inclusion health groups in the South East region. Six datapacks, one for each ICS area in the SE, present an initial overview to support systems to understand need in their area and provide a resource including data and summaries that can be taken out and used as required, as well as be further developed by local Systems.
For each inclusion health population group, the key messages for systems are presented, followed by an overview of health issues and available data. The end of each section includes links to further resources and organisations. The packs can be found to download at: Homelessness and inclusion health network webinars 2023-24 – Welcome (southeastclinicalnetworks.nhs.uk)
It is recommended that the datapack is used in conjunction with the newly published National Framework for NHS Action on Inclusion Health.
Table 3: Health inequalities, Local data sources related to population
| Resources | Purpose | Areas covered | Key indicators available |
| Surrey Index – Surrey-i | Highlights areas of Surrey that perform well or poorly against various outcomes | LCN, Local authorities (districts and boroughs), PCN, Ward | Advanced Education, Skills and Employment Housing, Inclusive Communities, Making a Great Start in Life, Environmental Quality, Wellness, Personal Safety, Access to Information and Communication, Business and Economy |
| JSNA: Surrey Context (Intro and demographics chapter) | High level overview of Surrey’s population and demographics | Country, Region, County, Integrated Care System, Local authorities (districts and boroughs), Primary care support networks, Place based partnership, Ward, MSOA | Population Estimates: Proportion of population by Area, Sex, Religion, Language and Ethnicity.
Proportion in good/very good health, Causes of Mortality, Quality of life, Life Expectancy, Population Projections Births, Deaths and Migration |
| Health and Wellbeing Strategy Index | Provides the data on selected HWB metrics | Data down to district and ward level and by some priority populations (availability depends on the indicators and data collected) | Marmot indicators.
Active Adults, Inactive Adults, Anti-Social Behaviour, Violent and Sexual Offences, Social Care users social contact, Employment gap for learning disabilities, Employment gap for secondary mental health, Learning disability stable and appropriate accommodation |
| Surrey’s digital exclusion map | Maps showing the main risk factors identified through national and local research as key factors or proxy indicators to the propensity for digital exclusion. | Local authorities (districts and boroughs), Integrated care partnerships, Ward | Social Indicators
Technology Indicators: Broadband Speed and usage, User classification (e-Veterans), People filling Census 2011 Online Digital Inclusion Index |
| The Health Foundation Local Authority dashboard | Brings together Local Authority data on health inequalities and wider health determinants | Local Authority (districts and boroughs), MSOA | Life expectancy, Healthy life expectancy, indicators related to wider determinants (work, money and resources, housing, transport) |
Local health inequalities data sources: place
Key Neighbourhoods
The Key Neighbourhoods | Surrey-i (surreyi.gov.uk web page provides insight summaries for each of the 21 key neighbourhoods which are the wards which included the most deprived “pockets” within the county. Surrey’s Health and Well-being Strategy was refreshed in 2022 to include a particular focus on certain geographic areas of the county which experience the poorest health outcomes in Surrey. These areas were selected on the basis of the Overall deprivation score established in the English deprivation indices 2019.
Table 4: Local authority health profiles
| Surrey | View data | View reports |
| Elmbridge Borough Council | View data | View reports |
| Epsom and Ewell Borough Council | View data | View reports |
| Guildford Borough Council | View data | View reports |
| Mole Valley District Council | View data | View reports |
| Reigate and Banstead Borough Council | View data | View reports |
| Runnymede Borough Council | View data | View reports |
| Spelthorne Borough Council | View data | View reports |
| Surrey Heath Borough Council | View data | View reports |
| Tandridge District Council | View data | View reports |
| Waverley Borough Council | View data | View reports |
| Woking Borough Council | View data | View reports |
Key data sources relevant for the five clinical areas and Core 20 Plus 5
Table 5: Five clinical areas of Core 20 plus 5, key data sources
| Clinical area | Data and intelligence source | Indicators | Areas covered |
| Cardiovascular disease | Home | CVDPREVENT | The Cardiovascular Disease Prevention Audit (CVDPREVENT) is a national primary care audit that automatically extracts routinely held GP data. This tool provides open access to the data, with clear, actionable insights for those tasked with improving cardiovascular health in England | National, regional, Integrated Care Board (ICB), Sub-ICB, Primary Care Network, GP practice |
| Cardiovascular disease | Fingertips Public Health data: Cardiovascular Disease, Diabetes and Kidney Disease | The profiles are for commissioners and health professionals when assessing the impact of CVD on their local population and making decisions about services. They include data on: primary care and condition management for CVD and CVD risk conditions, emergency care, hospital admissions, acute care procedures, mortality | County level, Regional, Integrated Care Board (ICB), Sub-ICB, GP practice |
| Cardiovascular disease | BHF Local intelligence | Infographics and local report | Integrated care board, GP practice |
| Cardiovascular disease | NHS Health Checks | NHS performance and uptake data | County level, see CVD deep dive |
| Respiratory | Fingertips: Respiratory disease profile | This profile (previously known as INHALE (the INteractive Health Atlas of Lung conditions in England)) is an online tool showing data from a range of sources about respiratory diseases, including chronic obstructive pulmonary disease (COPD) and asthma. This profile includes data from: the Quality and Outcomes Framework (QOF), Hospital Episode Statistics (HES), the Public Health Outcomes Framework (PHOF), the Office of National Statistics (ONS) mortality |
Various levels of data available |
| Maternity | Fingertips: Child and Maternal Health | A comprehensive range of profiles available for: Child health, Pregnancy and birth, early years, school-age children, breastfeeding, health behaviours in 15 year olds, healthcare use, mortality, oral health, unintentional injuries, vaccine and immunization vulnerable children, maternity high impact areas, early years high impact areas, young children high impact areas | County, Ward, Integrated Care Board (ICB), Sub-ICB, local maternity services, Regions, Previous Clinical commissioning groups |
| Early cancer diagnosis | Cancer services | Indicators include cancer incidence, cancer screening, diagnostic services, urgent suspected cancer (USC) referrals, emergency presentations, emergency admissions | National, Integrated care board (ICB), Sub-ICB, Primary care network (PCN), GP practice |
| Early cancer diagnosis | JSNA: Screening | Indicators include cancer screening uptake and related inequalities, behavioural risk factors | National, Regional (depending on the type of data), Integrated care board (ICB), Local authority (district and borough), NHS Trust |
| Mental health | Fingertips: Mental Health | Profiles available by: Children and Young People’s Mental Health and Wellbeing, Common Mental Health Disorders, Co-occurring substance misuse and mental health issues Mental Health and Wellbeing JSNA, Perinatal Mental Health, Severe Mental Illness, Suicide Prevention Profile | National, County, Regional, Wards, Integrated care board (ICB), Previous Clinical commissioning groups, Sustainability and Transformation Partnerships |
| Mental health | JSNA: MH | Mental and emotional wellbeing, behavioural risk factors, impact of the wider determinants of health including cots of living and Covid-19 | County, Wards, integrated care board (ICB, national, depending on the type of data |
| Smoking | Tobacco Control Dashboard Fingertips: Local Tobacco Control Profiles |
Socioeconomic and inequalities related to smoking, Burden of disease, prevalence, smoking and pregnancy, substance misuse and mental health | National, Regional, County, Ward |
Evidence-based and NICE quality standards for health determinants and the five clinical areas of Core 20 plus 5 (adults and children)
Factors that determine health and wellbeing: Evidence-based NICE guidance and quality standards
The government uses Labonte R Health promotion and empowerment: Practice Frameworks: Centre for Health promotion, University of Toronto; 1993, as a simple, but effective, map of the causes of health inequalities. This can guide effective strategies to reduce them. Full details are available on the NICE and health inequalities | What we do | About | NICE webpage, and the model is provided in Figure 2, below.
Figure 2: System map of the causes of health inequalities
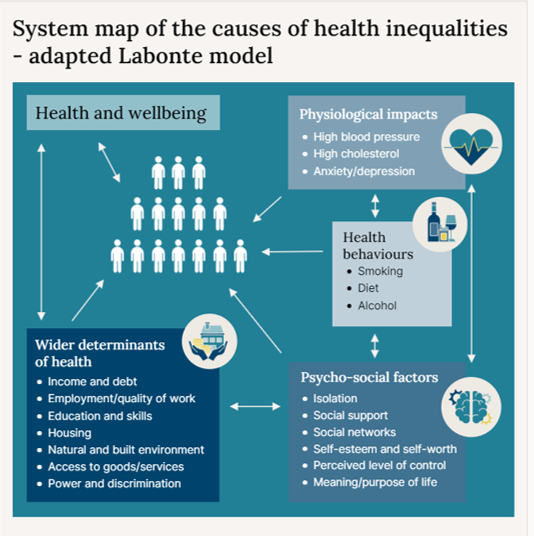
The NICE webpage also details the following factors that determine health and wellbeing:
- Wider determinants of health
- Psycho-social factors
- Health behaviours
- Physiological impacts
Return on investment (ROI) data sources
| Title | Summary | Link/ source |
| ASH – Ready Reckoner | An easy-to-use cost calculator, allowing you to see the costs of smoking to society in local authorities, combined authorities, regions, and England. Also find estimates for wards and constituencies. Costs are in the categories of productivity, social care, healthcare and fire. | ASH Ready Reckoner |
| ASH – Tobacco Dependence Treatment Service ROI Calculator | An easy-to-use calculator – Uses the Ottawa model for Smoking Cessation to estimate the impact of fully implementing Tobacco Dependency Treatment Services which can broken down by Trust, ICB and NHS region.) (on hospital admissions, A&E presentations, financial savings, beds etc) | Tobacco Dependence Treatment Service ROI Calculator – (ASH) |
| Maternal Smoking Cessation Benefits Calculator | A calculator to provide insight into potential savings for rolling out tobacco dependence treatment services into maternity settings. | |
| Alcohol Care Team (ACT) Return on Investment tool | This Return-on-Investment tool (ROI) has been developed to support Alcohol Care Team (ACT) providers to develop sustainability business cases. It uses a range of evidence from published sources alongside key assumptions to illustrate the impact of ACTs. | https://future.nhs.uk/NHSpp/view?objectID=182161957 |
| Cardiovascular Disease (CVD) ROI Tool | Gov.uk’s press release on the launch of the tool – contains links to the tool itself, an accompanying report and a user guide to help local commissioners decide the best approach to preventing cardiovascular disease (CVD) within their populations. | New ROI tool shows best ways to prevent cardiovascular disease |
| Movement into Employment ROI Tool | The tool itself and an accompanying report /guidance to help local commissioners estimate the benefits of moving an individual from worklessness into employment. | Movement into employment: return on investment tool – GOV.UK (www.gov.uk) |
**These resources will be kept under review and this page further revised as necessary**