2011 Census – Ethnicity
Headlines
- Surrey has become more ethnically diverse with rising numbers of people identifying with minority ethnic groups in 2011.
- White was the majority ethnic group at 1,023,700 in 2011 (90.4 per cent). Within this ethnic group, White British was the largest group at 945,700 (83.5 per cent).
- The White ethnic group accounted for 90.4 per cent of the usual resident population in 2011, a decrease from 95.0 per cent in 2001 and 97.2 per cent in 1991.
- White British and White Irish decreased between 2001 and 2011. The remaining ethnic groups increased, Any Other White background had the largest increase of 16,600 (1.2 percentage points).
- Across the districts in Surrey, Woking was the most ethnically diverse area, and Waverley the least.
Why is ethnicity important?
The 1991 Census first introduced a question on ethnic grouping to enable private and public organisations to monitor equal opportunities /anti-discrimination policies and to plan for the future through resource allocation and provision of services.
Ethnicity in Surrey
The majority of the population, 1,023,682 people (90.4 per cent of the population), reported their ethnic group as White in the 2011 Census. Within this ethnic group, White British was the largest, with 945,673 people (83.5 per cent), followed by those categorised as “Any Other White” with 62,736 people (5.5 per cent).
Indian was the next largest single ethnic group with 20,232 people (1.8 per cent) followed by Pakistani (1.0 per cent). However those categorised as “Other Asian” accounted for 1.7% of the population in total.
There were two new tick boxes in the 2011 Census: Gypsy or Irish Traveller and Arab. Arab accounted for 4,101 usual residents (0.4 per cent of the population). Gypsy or Irish Traveller accounted for 2,261 usual residents (0.2 per cent of the population), making it the smallest ethnic category (with a tick box) in 2011.
Figure 1: Ethnic groups, Surrey, 2011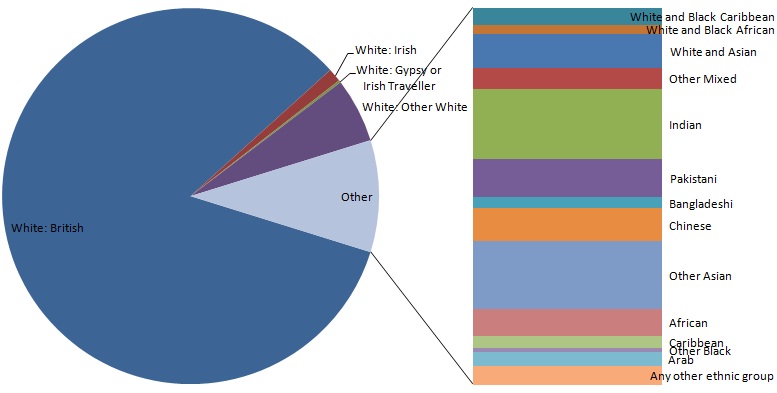
Source: Census – Office for National Statistics
Changing picture of ethnicity over time
Over the last decade Surrey became more ethnically diverse. Caution is needed when comparing census ethnic data over the years due to changes and increases in tick boxes and changes to how the question was worded (change from cultural to ethnic background).
While White continued to be the majority ethnic group people identify with, it decreased over the last decade. In 2001, the White ethnic group accounted for 95.0 per cent of the population. This decreased between the 2001 and 2011 Censuses to 90.4 per cent. Within the White ethnic group, White British had decreased from 89.3 per cent in 2001 to 83.5 per cent in 2011.
There was an increase in all other minority ethnic groups with a big increase in people reporting their ethnicity in “Other Asian” groups.
Table 1: Ethnic Groups, 2001 – 2011, Surrey
| Ethnic group | 2011 | 2001 | ||
| White: British | 945,673 | 83.5% | 946,074 | 89.3% |
| White: Irish | 13,012 | 1.1% | 13,868 | 1.3% |
| White: Gypsy or Irish Traveller | 2,261 | 0.2% | not counted | |
| White: Other White | 62,736 | 5.5% | 46,147 | 4.4% |
| Mixed/multiple ethnic groups: White and Black Caribbean | 4,920 | 0.4% | 2,360 | 0.2% |
| Mixed/multiple ethnic groups: White and Black African | 2,736 | 0.2% | 1,226 | 0.1% |
| Mixed/multiple ethnic groups: White and Asian | 9,657 | 0.9% | 5,335 | 0.5% |
| Mixed/multiple ethnic groups: Other Mixed | 6,241 | 0.6% | 3,788 | 0.4% |
| Asian/Asian British: Indian | 20,232 | 1.8% | 10,640 | 1.0% |
| Asian/Asian British: Pakistani | 10,818 | 1.0% | 6,265 | 0.6% |
| Asian/Asian British: Bangladeshi | 3,400 | 0.3% | 1,903 | 0.2% |
| Asian/Asian British: Chinese | 9,461 | 0.8% | 5,452 | 0.5% |
| Asian/Asian British: Other Asian | 19,587 | 1.7% | 4,307 | 0.4% |
| Black/African/Caribbean/Black British: African | 7,828 | 0.7% | 2,827 | 0.3% |
| Black/African/Caribbean/Black British: Caribbean | 3,303 | 0.3% | 2,250 | 0.2% |
| Black/African/Caribbean/Black British: Other Black | 1,299 | 0.1% | 548 | 0.1% |
| Other ethnic group: Arab | 4,101 | 0.4% | not counted | |
| Other ethnic group: Any other ethnic group | 5,125 | 0.5% | 6,025 | 0.6% |
Source: Census – Office for National Statistics
Differences in ethnicity across local authorities
Woking is the most diverse district in Surrey with 75.0 per cent of its population identified as White British. Waverley is the least diverse with 90.6 per cent White British.
Elmbridge has the highest proportion (10.4 per cent) in all other white groups with Tandridge the lowest (4.6 per cent)
Spelthorne has the highest proportion of Indian ethnic group (4.2 per cent) and Woking has the highest proportion of Pakistani ethnic group (5.7 per cent)
Table 2: Ethnic groups 2011, Local Authorities in Surrey
| White British | All other White groups | Mixed/ multiple ethnic groups | Asian/Asian British: Indian | Asian/Asian British: Pakistani |
All other Asian ethnic groups | Black/ African/ Caribbean/ Black British |
Other ethnic groups | All non-white ethnic groups | |
| Surrey | 83.5% | 6.9% | 2.1% | 1.8% | 1.0% | 2.9% | 1.1% | 0.8% | 9.6% |
| Elmbridge | 79.9% | 10.4% | 2.6% | 1.9% | 0.4% | 3.1% | 0.8% | 1.0% | 9.7% |
| Epsom and Ewell | 78.6% | 7.3% | 2.6% | 2.4% | 0.9% | 5.3% | 1.5% | 1.4% | 14.1% |
| Guildford | 83.5% | 7.4% | 1.8% | 1.2% | 0.4% | 3.3% | 1.2% | 1.2% | 9.1% |
| Mole Valley | 90.1% | 5.0% | 1.5% | 0.8% | 0.2% | 1.5% | 0.5% | 0.4% | 4.9% |
| Reigate and Banstead | 85.0% | 5.7% | 2.2% | 1.6% | 0.9% | 2.6% | 1.6% | 0.6% | 9.4% |
| Runnymede | 80.0% | 9.0% | 2.1% | 2.5% | 0.5% | 3.9% | 1.1% | 1.0% | 11.0% |
| Spelthorne | 81.0% | 6.3% | 2.5% | 4.2% | 0.7% | 2.8% | 1.6% | 1.0% | 12.7% |
| Surrey Heath | 85.0% | 5.2% | 1.9% | 2.0% | 0.8% | 3.5% | 1.0% | 0.7% | 9.8% |
| Tandridge | 89.3% | 4.6% | 2.2% | 0.9% | 0.2% | 1.5% | 1.1% | 0.3% | 6.2% |
| Waverley | 90.6% | 5.4% | 1.3% | 0.4% | 0.2% | 1.2% | 0.4% | 0.3% | 4.0% |
| Woking | 74.9% | 8.7% | 2.4% | 2.4% | 5.7% | 3.5% | 1.4% | 1.1% | 16.4% |
Source: Census – Office for National Statistics
How does Surrey compare with England and the South East?
Surrey is less diverse than England as a whole with 83.5 per cent of the population reporting their ethnic group as White British compared with 79.8 per cent in England. However in the South East as a whole 85.2 percent were recorded as White British.
More people in Surrey (6.9 percent) were recorded in other white ethnic groups than in England (5.7 percent) with fewer (9.6 per cent compared with 14.6 per cent) in all other ethnic groups.
Table 3: Ethnic groups 2011, Surrey, England and South East
| Surrey | South East | England | |
| White British | 83.5% | 85.2% | 79.8% |
| All other White groups | 6.9% | 5.4% | 5.7% |
| Mixed/multiple ethnic groups | 2.1% | 1.9% | 2.3% |
| Asian/Asian British: Indian | 1.8% | 1.8% | 2.6% |
| Asian/Asian British: Pakistani | 1.0% | 1.2% | 2.1% |
| All other Asian ethnic groups | 2.9% | 2.3% | 3.1% |
| Black/African/Caribbean/Black British | 1.1% | 1.6% | 3.5% |
| Other ethnic groups | 0.8% | 0.6% | 1.0% |
| All non-white ethnic groups | 9.6% | 9.4% | 14.6% |
Source: Census – Office for National Statistics
Figure 2: Ethnic groups excluding White British 2011, Local Authorities in Surrey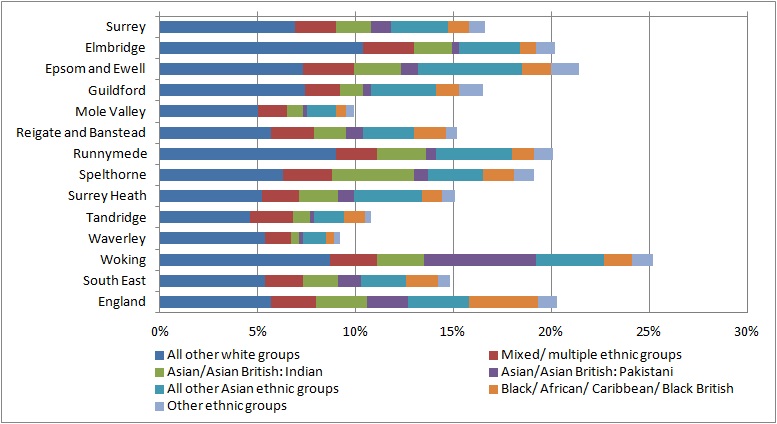
Source: Census – Office for National Statistics
Differences across age groups
The older population is less diverse than the younger cohorts. 92.5 percent of people aged 65+ are White British with just 2.7 per cent in non white ethnic groups. Other white ethnicities are most dominant in the 25-64 age group (8.4 per cent). The highest proportion of Asian ethnicities (other than Indian and Pakistani) is among young adults aged 16-24 (4.5 per cent). The proportion of mixed/multiple ethnic groups is highest among children under 16 (5.2 percent).
Table 4: Ethnic groups by age group 2011
| Age 0-15 | Age 16 to 24 | Age 25 to 64 | Age 65+ | All people | |
| White British | 81.4% | 80.9% | 81.9% | 92.5% | 83.5% |
| All other white groups | 5.1% | 6.1% | 8.4% | 4.8% | 6.9% |
| Mixed/multiple ethnic group | 5.2% | 3.1% | 1.3% | 0.3% | 2.1% |
| Asian/Asian British: Indian | 1.9% | 1.6% | 2.1% | 0.7% | 1.8% |
| Asian/Asian British: Pakistani | 1.5% | 1.3% | 0.9% | 0.3% | 1.0% |
| All other Asian groups | 2.9% | 4.5% | 3.2% | 0.8% | 2.9% |
| Black/African/Caribbean/Black British | 1.1% | 1.5% | 1.3% | 0.2% | 1.1% |
| Other ethnic groups | 0.9% | 1.0% | 0.9% | 0.3% | 0.8% |
| All non-white ethnic groups | 13.5% | 13.0% | 9.8% | 2.7% | 9.6% |
Source: Census – Office for National Statistics
Figure 3: Ethnic groups excluding White British by age group 2011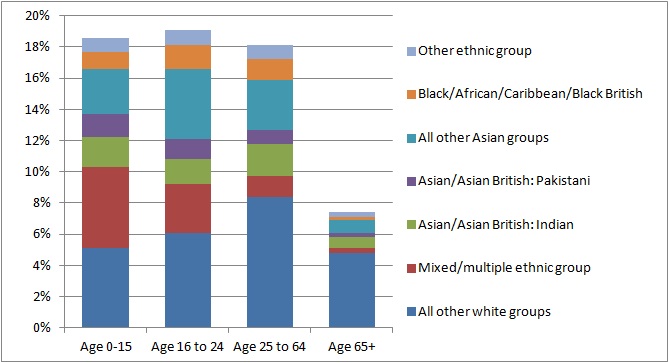
Source: Census – Office for National Statistics