INDICES OF DEPRIVATION 2025
N.B. This release updates the English Indices of Deprivation 2019.
External link to statistical release, frequently asked questions, and data files for all of England: English indices of deprivation 2025 - GOV.UK
Introduction
The English Indices of Deprivation (IoD25) measure relative levels of deprivation in 33,755 small areas or neighbourhoods, called Lower-layer Super Output Areas (LSOAs), across the whole of England. Surrey county is split into 719 LSOAs. LSOAs are designed to be consistent, accounting for a similar population size across the country – on average 1,500 residents or 650 households – and all types of geographic area (urban, rural, costal, island or otherwise) in the same way.
The IoD25 suite of resources comprises of 7 standalone indexes which are combined and weighted together to form the Index of Multiple Deprivation 2025 (IMD25) – the official measure of deprivation in England.
The Income Deprivation Affecting Children Index (IDACI) and Income Deprivation Affecting Older People Index (IDAOPI) have also been updated.
New datasets, methodologies and geographies have been used to produce the IoD25, meaning outputs are less directly comparable to previous Indices. Do not attempt to compare areas over time, but instead reflect on each area’s relative standing in comparison to the rest of the nation, at this one point in time.
Main findings
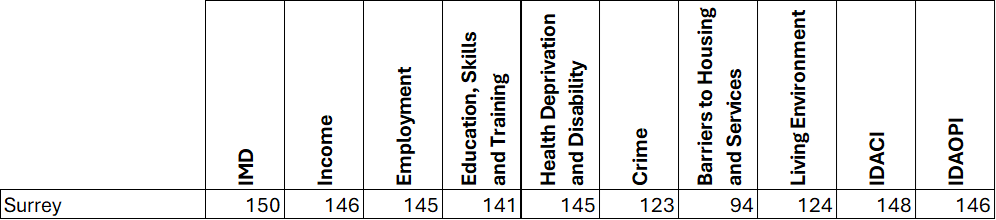
Overall, Surrey County is ranked as 150th most deprived upper tier local authorities (out of 153). We are therefore not terribly deprived as a single county. For Barriers to Housing and Services we are ranked within the middle third of English counties, due primarily to high cost of housing; for all other elements we rank within the least deprived third. Nonetheless, Surrey contains six neighbourhoods within the most deprived 20% of England, and a further 22 among the most deprived 30% (see table 3).
Table 1: Surrey county ranked against 153 English upper-tier authorities.
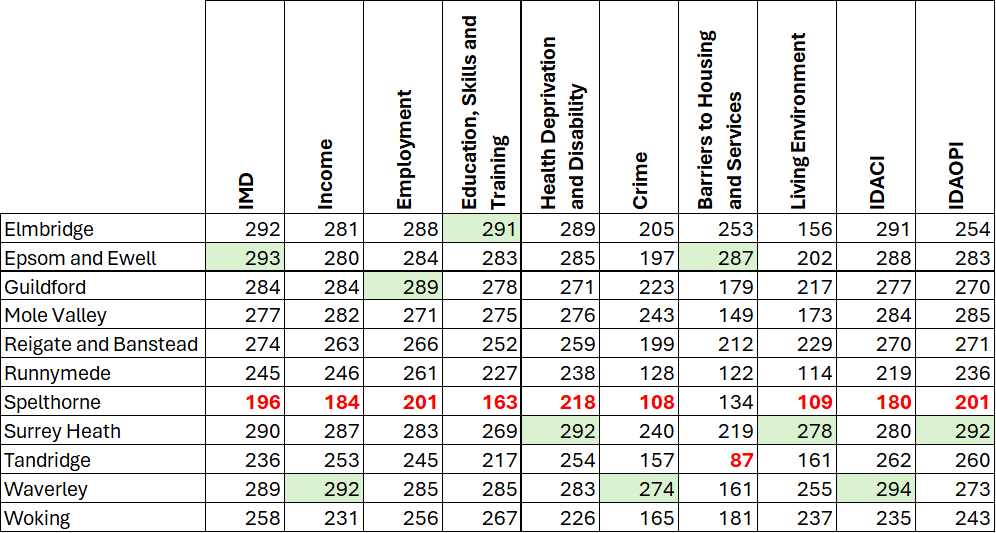
Each of Surrey’s District and Borough councils are ranked against the 296 English lower-tier authorities, where 1 is most deprived and 296 is least deprived. Values between 1 and 100 therefore equate to an overall position amongst the most-deprived third of council areas. Spelthorne is the most deprived of Surrey’s individual council areas, with values in the middle third of councils; this is true for both overall IMD and all but one of the sub-indices and domains. Tandridge is the most deprived in terms of Barriers to Housing and Services (ranked 87th of 296). Epsom and Ewell is the least deprived overall (ranked 293 of 296).
Table 2: Surrey District and Borough councils ranked against all 296 English lower-tier authorities.
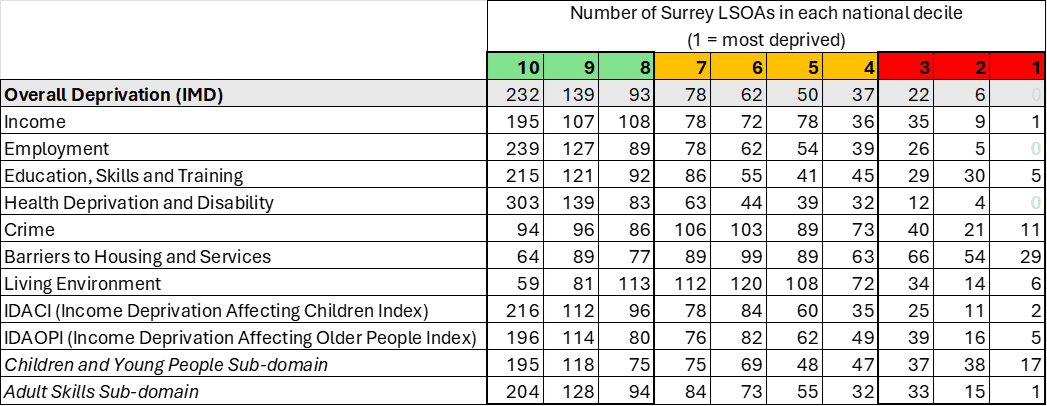
Deprivation scores for all 33,755 English LSOAs are arranged in order from most deprived (=1) to least deprived (=33,755). An individual LSOA's position within this ranking determines its relative deprivation compared to other areas. The whole distribution is then broken into 10 equal sized pieces, called deciles, for ease of determining relative position. Decile 1 = the 10% most deprived; decile 2 = amongst the 20% most deprived, and so on. Despite Surrey's relative overall low deprivation, we do have neighbourhoods amongst the 20% most deprived parts of England for Overall IMD, and amongst the 10% most deprived for individual Indexes and subdomains.
Table 3: Number of LSOAs within Surrey that lie within each national decile.
Individual Council reports have been created and can be downloaded from the attached PDF files at end of this page. A full set of LSOA data for Surrey can be downloaded from the bottom of this page. Other individual Surrey specific excerpts of the published national data files will be added shortly.
Tableau Dashboard
The Tableau dashboard below can be used to drill further into the Indices of Deprivation. Here you can view summaries for the County, individual District and Borough Councils, current electoral wards, and for the two new Unitary Authorities that will come into existence in April 2027, as well as identifying the specific LSOAs that are most (and least) deprived for all aspects.
To use the Tableau, please click to expand it, read the notes on the first page, then use the Menu Button at top left to navigate your way through. You can select options in drop down boxes, hover over items to bring up notes, and use the Postcode section to find information on where you live.
You may also find the following external links useful resources to view, particularly for local areas outside of Surrey: Local Deprivation Explorer - Home and Home | Local Insight