2011 Census – Hours worked by Surrey residents
Headlines
- In 2011, 72.7% of Surrey’s residents in employment worked full-time
- The borough with the highest proportion of people employed full-time was Spelthorne
- The borough with the highest proportion of people employed part-time was Waverley
- 56.6% of Surrey’s female residents in employment worked full-time
- 86.8% of Surrey’s male residents in employment worked full-time
Hours worked – all people – 2011 Census
The Census asked people how many hours a week (including paid and unpaid overtime) they usually worked in their main job. Full-time is defined as 31 hours or more and part-time 30 hours or less.
In 2011, the highest proportion of Surrey’s residents in employment worked full-time (72.7%), while the proportion for England as a whole was 70.9%.
The borough with the highest percentage of people employed full-time was Spelthorne (75.1%) and the borough with the lowest was Waverley (70.2%).
56% of the Surrey’s residents worked 31 to 48 hours and 16.7% worked 49 or more hours.
The borough with the highest proportion of people working 49 or more hours was Elmbridge (20.9%).
10.4% of the Surrey’s residents in employment worked 15 hours or less.
The borough with the highest proportion of residents working 15 hours or less was Waverley (11.9%).
Table 1: Hours worked – all people
| % Part-time: Total | % Part-time: 15 hours or less worked |
% Part-time: 16 to 30 hours worked |
% Full-time: Total | % Full-time: 31 to 48 hours worked |
% Full-time: 49 or more hours worked |
|
| Surrey | 27.3 | 10.4 | 16.9 | 72.7 | 56.0 | 16.7 |
| Elmbridge | 26.2 | 10.0 | 16.2 | 73.8 | 52.9 | 20.9 |
| Epsom and Ewell | 28.1 | 10.5 | 17.6 | 72.0 | 57.1 | 14.9 |
| Guildford | 28.2 | 11.7 | 16.5 | 71.8 | 55.2 | 16.6 |
| Mole Valley | 29.4 | 11.3 | 18.1 | 70.6 | 53.6 | 17.0 |
| Reigate and Banstead | 26.4 | 9.5 | 16.9 | 73.6 | 58.0 | 15.6 |
| Runnymede | 27.5 | 11.0 | 16.5 | 72.5 | 56.5 | 16.0 |
| Spelthorne | 24.9 | 8.5 | 16.4 | 75.1 | 61.6 | 13.5 |
| Surrey Heath | 26.8 | 10.0 | 16.8 | 73.2 | 56.3 | 16.9 |
| Tandridge | 27.9 | 10.4 | 17.5 | 72.1 | 55.1 | 17.0 |
| Waverley | 29.9 | 11.9 | 18.0 | 70.2 | 52.2 | 18.0 |
| Woking | 25.5 | 9.5 | 16.0 | 74.4 | 58.6 | 15.8 |
| South East | 28.6 | 10.3 | 18.3 | 71.4 | 56.8 | 14.6 |
| England | 29.0 | 9.6 | 19.4 | 70.9 | 57.6 | 13.3 |
Source: Census – Office for National Statistics
Figure 1: Hours worked – all people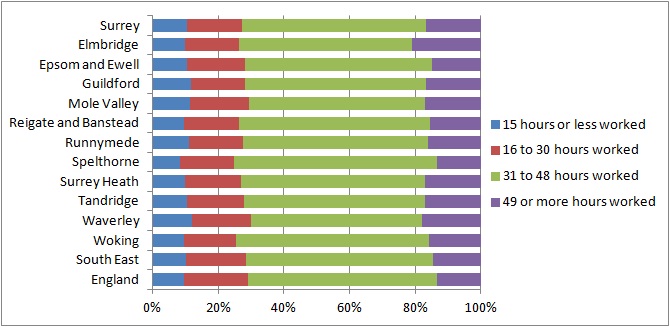
Source: Census – Office for National Statistics
Hours worked – females
In 2011, 56.6% of Surrey’s female residents in employment worked full-time and 43.4% worked part-time.
The borough with the highest proportion of female working full-time was Spelthorne (60.6%) and with the highest proportion part-time was Waverley (48.3%).
Table 2: Hours worked – females
| % Part-time: Total | % Part-time: 15 hours or less worked |
% Part-time: 16 to 30 hours worked |
% Full-time:Total | % Full-time: 31 to 48 hours worked |
% Full-time: 49 or more hours worked |
|
| Surrey | 43.4 | 15.9 | 27.5 | 56.6 | 48.3 | 8.3 |
| Elmbridge | 42.0 | 15.6 | 26.5 | 58.0 | 47.3 | 10.6 |
| Epsom and Ewell | 43.8 | 15.7 | 28.1 | 56.2 | 49.0 | 7.2 |
| Guildford | 44.8 | 17.8 | 27.0 | 55.2 | 47.0 | 8.2 |
| Mole Valley | 47.1 | 17.6 | 29.5 | 52.9 | 44.6 | 8.3 |
| Reigate and Banstead | 41.7 | 14.5 | 27.2 | 58.3 | 50.5 | 7.8 |
| Runnymede | 42.5 | 16.4 | 26.2 | 57.5 | 49.3 | 8.1 |
| Spelthorne | 39.4 | 12.6 | 26.8 | 60.6 | 53.5 | 7.1 |
| Surrey Heath | 43.1 | 15.4 | 27.7 | 56.9 | 48.9 | 8.0 |
| Tandridge | 44.1 | 15.8 | 28.3 | 55.9 | 47.5 | 8.3 |
| Waverley | 48.3 | 18.6 | 29.7 | 51.7 | 43.0 | 8.7 |
| Woking | 40.6 | 14.6 | 26.0 | 59.4 | 51.5 | 7.9 |
| South East | 44.8 | 15.3 | 29.5 | 55.2 | 48.1 | 7.2 |
| England | 44.1 | 13.9 | 30.2 | 55.9 | 49.2 | 6.6 |
Source: Census – Office for National Statistics
Figure 2: Hours worked – females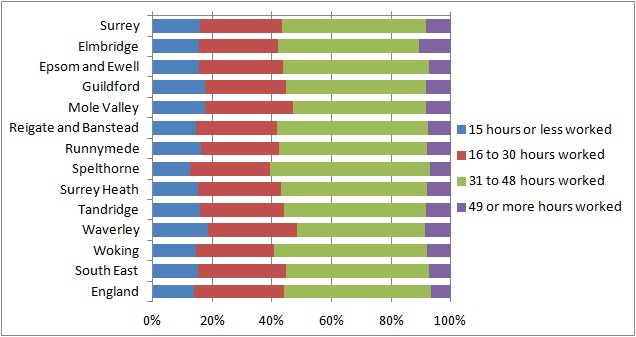
Source: Census – Office for National Statistics
Hours worked – males
In 2011, 86.8% of Surrey’s male residents in employment worked full-time.
The borough with the highest proportion of male working full-time was Spelthorne (87.9%) and with the highest proportion part-time was Runnymede (14.2%).
Table 3: Hours worked – males
| % Part-time: Total | % Part-time: 15 hours or less worked |
% Part-time: 16 to 30 hours worked |
% Full-time:Total | % Full-time: 31 to 48 hours worked |
%Full-time: 49 or more hours worked |
|
| Surrey | 13.2 | 5.6 | 7.6 | 86.8 | 62.7 | 24.0 |
| Elmbridge | 12.5 | 5.2 | 7.3 | 87.5 | 57.8 | 29.8 |
| Epsom and Ewell | 13.8 | 5.7 | 8.0 | 86.2 | 64.4 | 21.8 |
| Guildford | 13.9 | 6.5 | 7.3 | 86.1 | 62.4 | 23.8 |
| Mole Valley | 13.9 | 5.8 | 8.1 | 86.1 | 61.5 | 24.6 |
| Reigate and Banstead | 12.8 | 5.1 | 7.7 | 87.2 | 64.6 | 22.6 |
| Runnymede | 14.2 | 6.3 | 7.9 | 85.8 | 62.9 | 22.9 |
| Spelthorne | 12.1 | 4.9 | 7.2 | 87.9 | 68.7 | 19.2 |
| Surrey Heath | 12.8 | 5.4 | 7.4 | 87.2 | 62.6 | 24.6 |
| Tandridge | 13.2 | 5.6 | 7.7 | 86.8 | 61.9 | 24.8 |
| Waverley | 13.8 | 6.0 | 7.8 | 86.2 | 60.1 | 26.1 |
| Woking | 13.0 | 5.3 | 7.7 | 87.0 | 64.6 | 22.4 |
| South East | 14.3 | 5.8 | 8.5 | 85.7 | 64.5 | 21.2 |
| England | 15.6 | 5.8 | 9.8 | 84.4 | 65.1 | 19.3 |
Source: Census – Office for National Statistics
Figure 3: Hours worked – males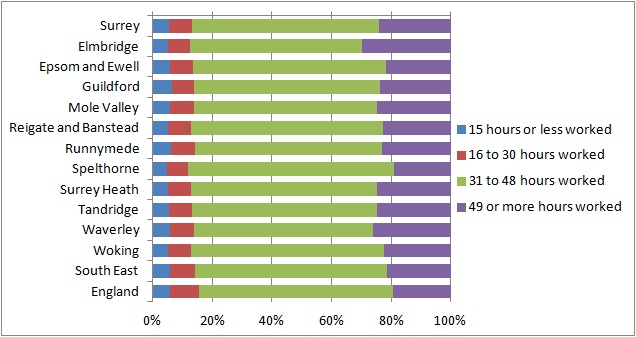
Source: Census – Office for National Statistics
Over 40% of the female residents in employment worked part-time, while the percentage of male was just over 10%.
The proportion of female residents working 15 hours or less was almost 3 times higher than the proportion of males. On the contrary the proportion of females working 49 or more hours was 3 times lower.
Figure 4: Hours worked – females and males – Census 2011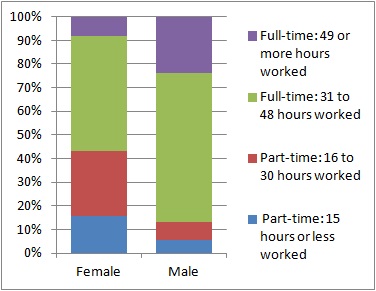
Source: Census – Office for National Statistics