2011 Census – Industry of Surrey residents
Headlines
- In 2011, the highest proportion of Surrey’s residents in employment worked in the “Wholesale and retail trade; repair of motor vehicles and motor cycles” industry.
- 10.6% of the Surrey’s residents in employment worked in “Human health and social work activities” and 10.1% worked in “Professional scientific and technical activities”.
- “Human health and social work activities” and “Education” were the industries that employed the highest proportion of Surrey’s female residents.
Industry of all residents – 2011 Census
The Census asked people in employment to provide information on the main activity of their employer or business for their main job. This is used to assign responses to an industry code based on the Standard Industrial Classification 2007. Data is not comparable to the 2001 Census which used a classification based on the Standard Industrial Classification 1992.
In 2011, the highest proportion of Surrey’s residents in employment worked in the “Wholesale and retail trade; repair of motor vehicles and motor cycles industry” (13.9%), while the percentage for the whole England was 15.9%.
The borough with the highest proportion of people employed in “Wholesale and retail trade; repair of motor vehicles and motor cycles” was Runnymede (15.6%) and the boroughs with the lowest proportion were Mole Valley and Elmbridge (both 12.7%).
10.6% of the Surrey’s residents in employment worked in “Human health and social work activities” and 10.1% worked in “Professional scientific and technical activities”. England as a whole had a higher percentage of people working in “Human health and social work activities” (12.4%) and a lower proportion of people working in “Professional scientific and technical activities” (6.7%).
Spelthorne was the borough with the lowest proportion of people employed in “Professional scientific and technical activities” (6.3%) and “Human health and social work activities” (8.6%).
Table 1: Industry of all residents
| % Manufacturing | % Construction | % Wholesale and retail trade 1 |
%Transport and storage |
% Information and communication |
% Financial and insurance |
% Professional scientific and technical |
% Administrative and support service |
% Public administration and defence 2 |
% Education | %Human health and social work |
%Others | |
| Surrey | 5.2 | 7.5 | 13.9 | 5.8 | 7.0 | 6.1 | 10.1 | 5.5 | 5.3 | 9.7 | 10.6 | 13.2 |
| Elmbridge | 5.0 | 5.9 | 12.7 | 4.2 | 8.6 | 7.7 | 13.5 | 5.6 | 4.3 | 9.7 | 8.8 | 13.8 |
| Epsom and Ewell | 3.7 | 8.3 | 13.6 | 4.3 | 5.9 | 7.1 | 10.3 | 5.0 | 6.0 | 10.1 | 13.3 | 12.3 |
| Guildford | 5.5 | 7.0 | 14.0 | 3.6 | 7.6 | 5.1 | 10.7 | 4.9 | 6.0 | 11.4 | 10.6 | 13.7 |
| Mole Valley | 5.0 | 8.2 | 12.7 | 3.8 | 6.0 | 6.6 | 11.6 | 5.9 | 4.8 | 10.5 | 10.3 | 14.5 |
| Reigate and Banstead | 4.6 | 8.3 | 13.3 | 6.3 | 5.3 | 8.9 | 8.8 | 5.9 | 5.3 | 8.9 | 12.3 | 12.1 |
| Runnymede | 6.0 | 7.2 | 15.6 | 8.7 | 6.8 | 3.3 | 8.1 | 5.5 | 4.7 | 9.3 | 10.3 | 14.5 |
| Spelthorne | 5.3 | 7.4 | 14.6 | 15.0 | 6.8 | 3.6 | 6.3 | 5.8 | 5.7 | 7.9 | 8.6 | 12.9 |
| Surrey Heath | 6.8 | 7.2 | 14.6 | 6.1 | 8.5 | 4.2 | 8.4 | 5.6 | 6.7 | 8.4 | 10.8 | 12.7 |
| Tandridge | 4.6 | 9.7 | 13.4 | 4.7 | 5.0 | 8.3 | 9.5 | 5.4 | 5.9 | 10.0 | 11.2 | 12.4 |
| Waverley | 5.2 | 7.4 | 13.7 | 3.2 | 7.5 | 5.5 | 11.8 | 5.3 | 4.5 | 12.2 | 10.2 | 13.5 |
| Woking | 5.9 | 6.4 | 14.8 | 5.4 | 8.2 | 5.8 | 10.7 | 5.7 | 5.3 | 8.2 | 10.4 | 13.2 |
| South East | 7.2 | 8.0 | 15.6 | 5.2 | 5.5 | 4.5 | 7.5 | 5.2 | 6.0 | 10.1 | 11.6 | 13.7 |
| England | 8.8 | 7.7 | 15.9 | 5.0 | 4.1 | 4.4 | 6.7 | 4.9 | 5.9 | 9.9 | 12.4 | 14.3 |
1 includes repair of motor vehicles and motor cycle
2 includes compulsory social security
Source: Census – Office for National Statistics
Figure 1: Industry of all residents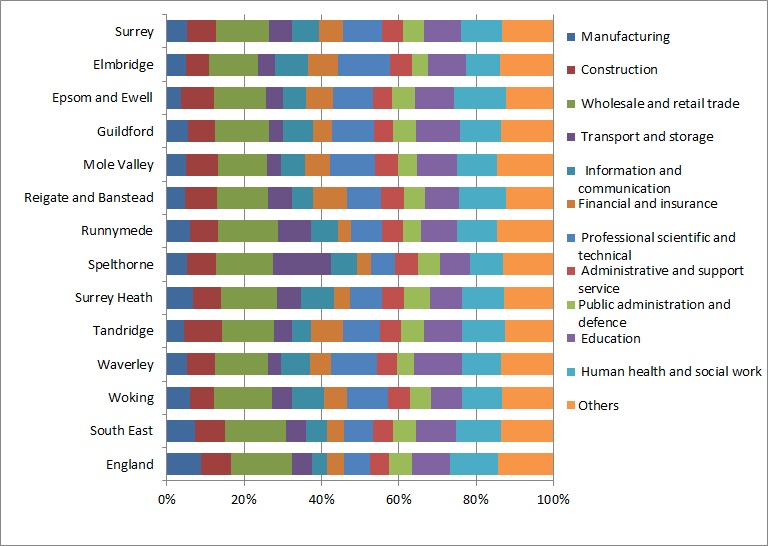
Source: Census – Office for National Statistics
Industry of female residents – 2011 Census
In 2011, the highest proportion of Surrey’s female residents in employment worked in the “Human health and social work activities” (18%), while the percentage for the whole England was 20.7%.
The borough with the highest proportion of people employed in “Human health and social work activities” was Epsom and Ewell (21.4%) and the borough with the lowest proportion was Spelthorne (15%).
15.5% of the Surrey’s female residents in employment worked in “Education”, a very similar proportion to England as a whole (15.1%).
Waverley was the borough with the highest proportion of female employed in “Education” (19.1%) and Spelthorne was the borough with the lowest proportion (13%).
Table 2: Industry of female residents
| % Manufacturing | % Construction | %Wholesale and retail trade 1 | % Transport and storage | % Information and communication |
% Financial and insurance | % Professional scientific and technical | % Administrative and support service |
% Public administration and defence 2 |
%Education | % Human health and social work | % Others | |
| Surrey | 3.5 | 2.4 | 13.6 | 3.5 | 4.5 | 5.1 | 9.6 | 5.2 | 5.0 | 15.5 | 18.0 | 14.1 |
| Elmbridge | 3.8 | 2.1 | 12.6 | 2.9 | 5.6 | 4.9 | 12.4 | 5.5 | 4.2 | 15.9 | 15.4 | 14.9 |
| Epsom and Ewell | 2.5 | 2.6 | 13.7 | 1.8 | 3.6 | 5.8 | 9.8 | 4.7 | 5.5 | 15.6 | 21.4 | 12.8 |
| Guildford | 3.5 | 2.1 | 13.9 | 1.9 | 4.7 | 4.0 | 10.2 | 4.6 | 5.0 | 17.3 | 18.3 | 14.5 |
| Mole Valley | 3.3 | 2.8 | 12.1 | 2.2 | 3.6 | 5.6 | 10.5 | 5.4 | 4.5 | 17.0 | 17.6 | 15.5 |
| Reigate and Banstead | 2.9 | 2.7 | 12.9 | 3.9 | 3.2 | 8.3 | 8.2 | 5.7 | 5.1 | 14.1 | 20.3 | 12.6 |
| Runnymede | 4.3 | 2.3 | 15.2 | 5.6 | 4.8 | 3.1 | 7.9 | 5.3 | 4.5 | 14.2 | 17.2 | 15.6 |
| Spelthorne | 3.8 | 2.4 | 14.7 | 10.1 | 4.9 | 4.1 | 6.5 | 5.9 | 5.5 | 13.0 | 15.0 | 14.2 |
| Surrey Heath | 4.3 | 2.4 | 14.4 | 4.0 | 5.5 | 3.8 | 8.0 | 5.5 | 5.6 | 14.0 | 18.7 | 13.7 |
| Tandridge | 2.8 | 3.5 | 12.9 | 2.7 | 3.4 | 7.4 | 9.1 | 4.8 | 5.6 | 16.1 | 18.5 | 13.1 |
| Waverley | 3.3 | 2.1 | 13.4 | 1.7 | 4.5 | 3.9 | 10.9 | 4.6 | 4.2 | 19.1 | 17.6 | 14.8 |
| Woking | 3.9 | 2.1 | 14.4 | 2.5 | 5.3 | 4.5 | 10.5 | 5.4 | 5.4 | 13.7 | 18.0 | 14.2 |
| South East | 4.2 | 2.1 | 15.6 | 2.6 | 3.6 | 4.4 | 7.2 | 4.9 | 5.4 | 15.6 | 19.7 | 14.7 |
| England | 4.7 | 2.0 | 16.0 | 2.2 | 2.7 | 4.4 | 6.6 | 4.7 | 5.8 | 15.1 | 20.7 | 15.1 |
1 includes repair of motor vehicles and motor cycle
2 includes compulsory social security
Source: Census – Office for National Statistics
Figure 2: Industry of female residents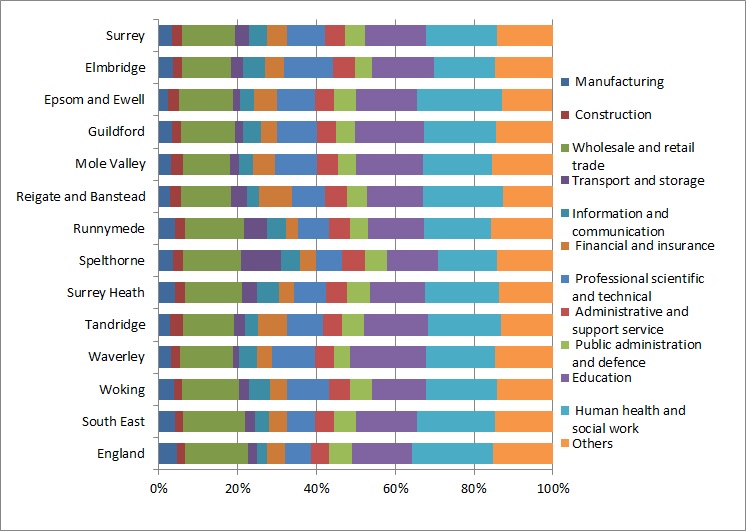
Source: Census – Office for National Statistics
Industry of male residents – 2011 Census
In 2011, the highest proportion of Surrey’s male residents in employment worked in the “Wholesale and retail trade; repair of motor vehicles and motor cycles” (14.1%), while the percentage for the whole England was 15.9%.
The borough with the highest proportion of people employed in “Wholesale and retail trade; repair of motor vehicles and motor cycles” was Woking (15.2%) and the borough with the lowest proportion was Elmbridge (12.9%).
11.9% of the Surrey’s male residents in employment worked in “Construction” and 10.6% worked in “Professional scientific and technical activities”.
Tandridge was the borough with the highest proportion of male employed in “Construction” (15.2%) and Elmbridge was the borough with the highest proportion of male employed in “Professional scientific and technical activities” (14.5%).
Table 3: Industry of male residents
| % Manufacturing | %Construction | % Wholesale and retail trade1 | %Transport and storage | % Information and communication |
% Financial and insurance activities | % Professional scientific and technical | %Administrative and support service |
% Public administration and defence 2 |
% Education | % Human health and social work | %Other | |
| Surrey | 6.8 | 11.9 | 14.1 | 7.8 | 9.2 | 7 | 10.6 | 5.8 | 5.7 | 4.7 | 4.1 | 12.4 |
| Elmbridge | 6.1 | 9.2 | 12.9 | 5.5 | 11.1 | 10.1 | 14.5 | 5.8 | 4.4 | 4.4 | 3.2 | 12.9 |
| Epsom and Ewell | 4.9 | 13.5 | 13.4 | 6.6 | 8.1 | 8.2 | 10.8 | 5.2 | 6.5 | 5.1 | 5.9 | 11.7 |
| Guildford | 7.1 | 11.3 | 14.1 | 5 | 10.2 | 6 | 11.2 | 5.1 | 6.8 | 6.2 | 3.9 | 12.9 |
| Mole Valley | 6.4 | 13 | 13.2 | 5.2 | 8.2 | 7.5 | 12.6 | 6.4 | 5.1 | 4.9 | 3.9 | 13.6 |
| Reigate and Banstead | 6.1 | 13.2 | 13.7 | 8.4 | 7.1 | 9.4 | 9.4 | 6.1 | 5.6 | 4.3 | 5.2 | 11.7 |
| Runnymede | 7.4 | 11.5 | 16 | 11.4 | 8.6 | 3.6 | 8.3 | 5.6 | 4.9 | 5 | 4.1 | 13.5 |
| Spelthorne | 6.7 | 11.9 | 14.6 | 19.3 | 8.5 | 3.2 | 6.2 | 5.7 | 5.8 | 3.4 | 2.8 | 11.9 |
| Surrey Heath | 8.9 | 11.2 | 14.7 | 7.9 | 11 | 4.6 | 8.8 | 5.7 | 7.7 | 3.6 | 4 | 11.9 |
| Tandridge | 6.2 | 15.2 | 13.9 | 6.5 | 6.4 | 9.2 | 9.8 | 5.9 | 6.1 | 4.5 | 4.5 | 11.9 |
| Waverley | 6.9 | 12 | 14 | 4.6 | 10.1 | 6.8 | 12.6 | 5.9 | 4.7 | 6.2 | 3.8 | 12.4 |
| Woking | 7.6 | 9.9 | 15.2 | 7.8 | 10.6 | 6.9 | 10.9 | 6 | 5.2 | 3.6 | 4 | 12.4 |
| South East | 9.9 | 13.1 | 15.5 | 7.5 | 7.3 | 4.6 | 7.7 | 5.4 | 6.5 | 5.3 | 4.5 | 12.9 |
| England | 12.5 | 12.7 | 15.9 | 7.5 | 5.3 | 4.4 | 6.8 | 5.1 | 5.9 | 5.3 | 5 | 13.6 |
1 includes repair of motor vehicles and motor cycle
2 includes compulsory social security
Source: Census – Office for National Statistics
Figure 3: Industry of male residents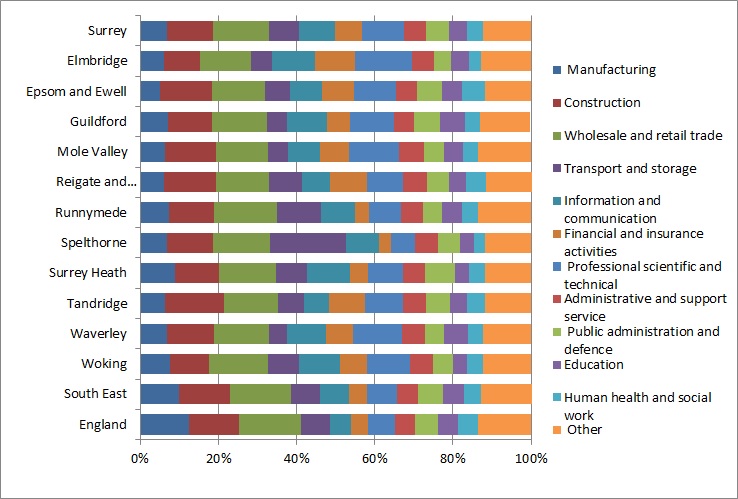
Source: Census – Office for National Statistics
The main differences when comparing males and females in Surrey were in “Human health and social work activities” and “Education”; for both Industries there was a much higher proportion of females. On the contrary the industry with a higher proportion of males was “Construction”.
Figure 4: Surrey – Main industries, male and female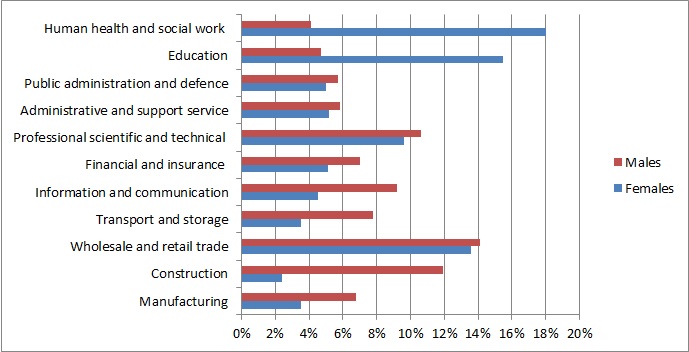
Source: Census – Office for National Statistics