2011 Census – Occupation of Surrey residents
Headlines
- In 2011, the highest proportion of Surrey’s residents in employment worked in “Professional occupations” (21.7%).
- Surrey has twice as many residents working as “Managers, directors and senior officials” than residents employed in “Elementary occupations”.
- “Professional occupations” and “Administrative and secretarial occupations” were the most common occupations for the Surrey’s female residents in employment.
- “Professional occupations” and “Managers, directors and senior officials occupations” were the most common occupations for the Surrey’s male residents in employment.
Occupation of all residents in employment – 2011 Census
The Census asked people in employment to provide their job title and information about activities involved in their job. This is used to assign responses to an occupation code based on the Standard Occupational Classification 2010 (SOC2010). Data is not comparable to the 2001 Census which used a classification based on the Standard Industrial Classification 2000.
In 2011, the highest proportion of Surrey’s residents in employment worked in “Professional occupations” (21.7%), while the proportion of England as a whole was 17.5%.
The boroughs with the highest proportion of people employed in “Professional occupations” were Guilford (24.5%) and Elmbridge (24.4%), and the borough with the lowest proportion was Spelthorne (16.3%).
83,868 (14.6%) of the Surrey’s residents in employment, worked as “Managers, directors and senior officials” while only 41,228 (7.2%) were employed in “Elementary occupations”.
England as a whole had a higher percentage of people working in “Elementary occupations” (11.1%) and a lower proportion of people employed as “Managers, directors and senior officials” (10.9%).
Elmbridge was the borough with the highest proportion of “Managers, directors and senior officials” (18.7%) and the lowest proportion of residents in “Elementary occupations” (5.3%).
On the contrary Spelthorne was the borough with the lowest proportion of “Managers, directors and senior officials” (11.7%) and a higher proportion of residents in “Elementary occupations” (9%). Runnymede had the highest proportion of residents in “Elementary occupations” (9.1%).
Table 1: Occupation of all residents in employment
| % Managers directors and senior officials | % Professional occupations | % Associate professional and technical occupations | % Administrative and secretarial occupations | % Skilled trades occupations | % Caring leisure and other service occupations | % Sales and customer service occupations | % Process plant and machine operatives | % Elementary occupations | |
| Surrey | 14.6 | 21.7 | 15.7 | 12.0 | 9.7 | 8.6 | 6.5 | 4.1 | 7.2 |
| Elmbridge | 18.7 | 24.4 | 17.7 | 10.8 | 7.4 | 7.5 | 5.3 | 3.0 | 5.3 |
| Epsom and Ewell | 13.0 | 22.9 | 15.5 | 13.3 | 9.4 | 8.6 | 6.7 | 4.0 | 6.6 |
| Guildford | 13.6 | 24.5 | 16.0 | 10.3 | 9.5 | 7.8 | 7.0 | 3.6 | 7.8 |
| Mole Valley | 15.1 | 22.4 | 15.6 | 11.9 | 10.6 | 8.7 | 5.5 | 3.5 | 6.6 |
| Reigate and Banstead | 13.8 | 20.6 | 15.8 | 12.8 | 9.6 | 9.4 | 6.4 | 4.3 | 7.1 |
| Runnymede | 13.4 | 18.9 | 14.4 | 12.4 | 10.5 | 9.0 | 7.4 | 4.9 | 9.1 |
| Spelthorne | 11.7 | 16.3 | 14.8 | 15.2 | 10.4 | 8.9 | 7.4 | 6.4 | 9.0 |
| Surrey Heath | 15.5 | 20.3 | 16.1 | 12.1 | 9.6 | 8.5 | 6.7 | 4.1 | 7.1 |
| Tandridge | 15.6 | 18.8 | 15.6 | 12.8 | 11.2 | 9.7 | 5.8 | 4.1 | 6.3 |
| Waverley | 15.8 | 23.9 | 15.2 | 10.4 | 10.4 | 8.3 | 6.0 | 3.2 | 6.9 |
| Woking | 13.4 | 22.9 | 15.0 | 11.7 | 8.9 | 8.5 | 7.3 | 4.8 | 7.5 |
| South East | 12.3 | 18.7 | 13.8 | 11.5 | 11.1 | 9.3 | 7.9 | 5.7 | 9.7 |
| England | 10.9 | 17.5 | 12.8 | 11.5 | 11.4 | 9.3 | 8.4 | 7.2 | 11.1 |
Source: Office for National Statistics
Figure 1: Occupation of all residents in employment 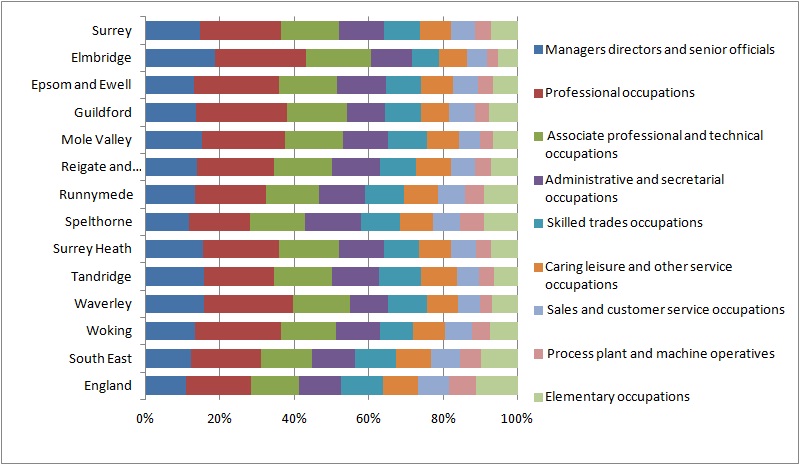
Source: Office for National Statistics
Occupation of female residents in employment – 2011 Census
In 2011, the highest proportion of Surrey’s female residents in employment worked in “Professional occupations” (21.6%) and “Administrative and secretarial occupations” (20.5%).
The boroughs with the highest proportion of female working in “Professional occupations” were Elmbridge and Guilford, both 24.4%; the borough with the lowest was Spelthorne (16.2%).
The borough with the highest proportion of female in “Administrative and secretarial occupations” was Spelthorne (24.7%) and the one with the lowest was Guilford (17.8%).
Table 2: Occupation of female residents
| % Managers directors and senior officials | % Professional occupations | % Associate professional and technical occupations | % Administrative and secretarial occupations | % Skilled trades occupations | % Caring leisure and other service occupations | % Sales and customer service occupations | % Process plant and machine operatives | % Elementary occupations | |
| Surrey | 10.1 | 21.6 | 14.1 | 20.5 | 2.3 | 15.1 | 8.6 | 0.9 | 6.9 |
| Elmbridge | 12.5 | 24.4 | 16.4 | 18.3 | 1.9 | 13.6 | 6.9 | 0.7 | 5.1 |
| Epsom and Ewell | 9.1 | 22.8 | 13.7 | 22.4 | 1.8 | 14.5 | 8.9 | 0.7 | 6.2 |
| Guildford | 9.3 | 24.4 | 14.0 | 17.8 | 2.5 | 13.9 | 9.3 | 0.8 | 7.9 |
| Mole Valley | 10.3 | 22.3 | 14.4 | 20.5 | 2.5 | 15.4 | 7.2 | 0.9 | 6.6 |
| Reigate and Banstead | 9.7 | 20.7 | 14.2 | 21.4 | 2.2 | 16.1 | 8.4 | 0.8 | 6.6 |
| Runnymede | 9.6 | 19.3 | 13.1 | 20.8 | 2.4 | 15.4 | 10.0 | 0.9 | 8.5 |
| Spelthorne | 8.6 | 16.2 | 13.6 | 24.7 | 2.1 | 15.6 | 10.2 | 1.1 | 7.9 |
| Surrey Heath | 10.3 | 19.9 | 14.2 | 21.2 | 2.3 | 15.4 | 9.2 | 0.9 | 6.7 |
| Tandridge | 11.0 | 19.0 | 13.8 | 22.2 | 2.6 | 16.7 | 7.8 | 0.9 | 6.1 |
| Waverley | 10.7 | 24.0 | 13.8 | 18.3 | 2.8 | 14.7 | 7.8 | 0.8 | 7.2 |
| Woking | 9.5 | 22.0 | 13.7 | 20.1 | 1.9 | 15.2 | 9.5 | 1.0 | 7.1 |
| South East | 8.8 | 19.2 | 12.2 | 19.4 | 2.5 | 16.3 | 10.8 | 1.4 | 9.3 |
| England | 8.1 | 18.6 | 11.5 | 19.0 | 2.6 | 16.2 | 11.5 | 1.8 | 10.7 |
Source: Office for National Statistics
Figure 2: Occupation of female residents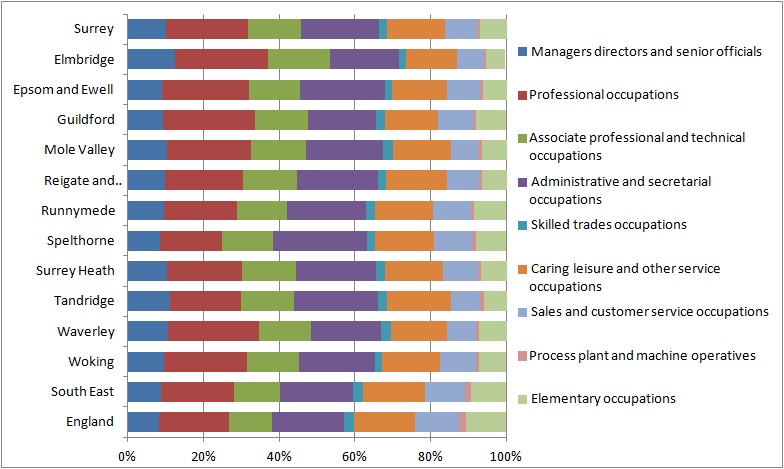
Source: Office for National Statistics
Occupation of male residents in employment – 2011 Census
In 2011, the highest proportion of Surrey’s male residents in employment worked in “Professional occupations” (21.8%) and as “Managers, directors and senior officials” (18.5%).
The borough with the highest proportion of male working in “Professional occupations” was Guilford (24.6%) and with the lowest was Spelthorne (16.4%). The borough with the highest proportion of male employed as “Managers, directors and senior officials” was Elmbridge (23.9%) and the lowest was Spelthorne (14.5%).
Table 3: Occupation of male residents
| % Managers directors and senior officials | % Professional occupations | % Associate professional and technical occupations | % Administrative and secretarial occupations | % Skilled trades occupations | % Caring leisure and other service occupations | % Sales and customer service occupations | % Process plant and machine operatives | % Elementary occupations | |
| Surrey | 18.5 | 21.8 | 17.0 | 4.6 | 16.1 | 2.9 | 4.6 | 7.0 | 7.4 |
| Elmbridge | 23.9 | 24.4 | 18.8 | 4.2 | 12.1 | 2.3 | 3.9 | 5.0 | 5.4 |
| Epsom and Ewell | 16.5 | 22.9 | 17.2 | 5.1 | 16.4 | 3.3 | 4.7 | 7.0 | 6.9 |
| Guildford | 17.3 | 24.6 | 17.8 | 3.8 | 15.5 | 2.5 | 5.0 | 5.9 | 7.6 |
| Mole Valley | 19.4 | 22.6 | 16.7 | 4.3 | 17.7 | 2.8 | 4.0 | 5.8 | 6.7 |
| Reigate and Banstead | 17.5 | 20.6 | 17.2 | 5.2 | 16.3 | 3.6 | 4.5 | 7.5 | 7.7 |
| Runnymede | 16.9 | 18.5 | 15.5 | 4.9 | 17.6 | 3.2 | 5.2 | 8.5 | 9.7 |
| Spelthorne | 14.5 | 16.4 | 15.9 | 6.6 | 17.7 | 2.9 | 4.9 | 11.2 | 10.0 |
| Surrey Heath | 19.9 | 20.7 | 17.8 | 4.3 | 15.9 | 2.5 | 4.5 | 7.0 | 7.5 |
| Tandridge | 19.8 | 18.7 | 17.3 | 4.4 | 19.1 | 3.3 | 4.0 | 7.0 | 6.4 |
| Waverley | 20.3 | 23.8 | 16.4 | 3.6 | 16.9 | 2.8 | 4.4 | 5.2 | 6.5 |
| Woking | 16.7 | 23.7 | 16.0 | 4.7 | 14.8 | 2.8 | 5.5 | 8.0 | 7.8 |
| South East | 15.3 | 18.3 | 15.2 | 4.4 | 18.7 | 3.1 | 5.3 | 9.5 | 10.1 |
| England | 13.3 | 16.5 | 14.0 | 4.8 | 19.1 | 3.2 | 5.7 | 11.9 | 11.5 |
Source: Office for National Statistics
Figure 3: Occupation of male residents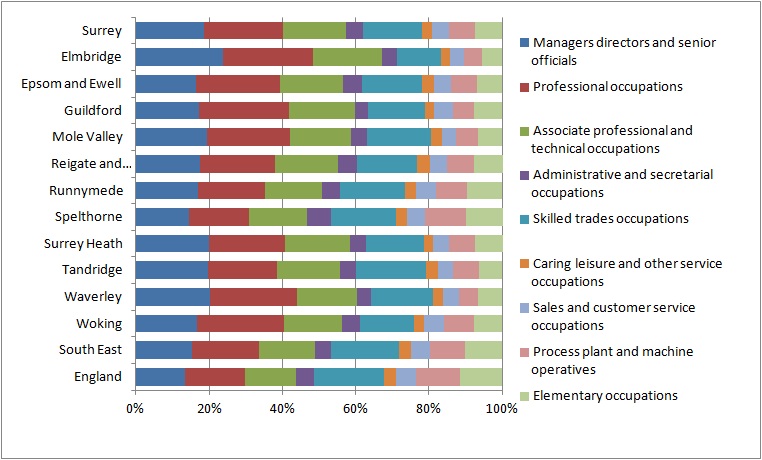
Source: Office for National Statistics
In Surrey, the proportion of male working in “Professional occupations” (21.8%) was very similar to the proportion of females (21.6%).
The occupations for which the female proportion was much higher than the male were “Administrative and secretarial occupations” and “Caring leisure and other service occupations”, with the female proportion being respectively 4 and 5 times higher than the male.
The occupations for which the male proportion was much higher than the female were “Skilled trade occupations” and “Process Plant and machine operatives” with both a male proportion 7 times higher than the female.
Figure 4: Occupations of Surrey’s residents, male and female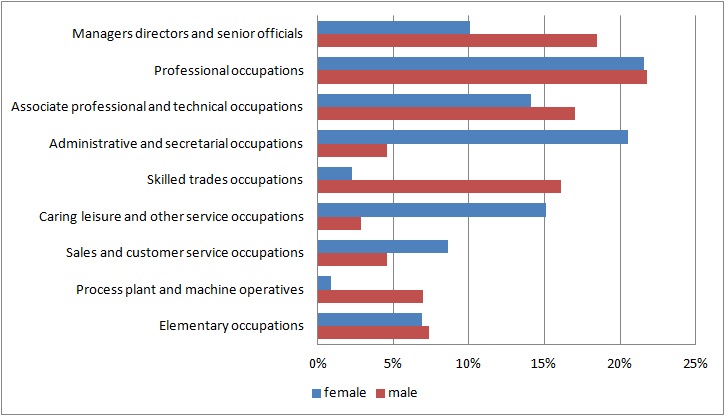
Source: Office for National Statistics