2011 Census – First results (population change, age structure and household size)
Headlines
- Surrey population now 1,132,400.
- Recent increase in birth rate is reflected in an increased number of under 5s, who now make up a greater proportion of the population than 10 years ago.
- Older people aged over 65 also make up a greater proportion of the population than 10 years ago.
- Population is growing faster than the number of households and average household size has increased, reversing the long established trend.
Total population
The usually resident population of Surrey, counted by the 2011 Census was 1,132,400. This is an increase of 73,400 (6.9%) since 2001. The fastest growing borough is Epsom & Ewell which has seen a 11.9% increase in population since 2001, while Runnymede has seen the lowest increase of 3.2%.
Table 1: Population change by Local Authority
| Area | 2011 Census | 2001 Census | change | % change |
| Surrey | 1,132,400 | 1,059,000 | 73,400 | 6.9% |
| Elmbridge | 130,900 | 121,900 | 9,000 | 7.4% |
| Epsom and Ewell | 75,100 | 67,100 | 8,000 | 11.9% |
| Guildford | 137,200 | 129,700 | 7,500 | 5.8% |
| Mole Valley | 85,400 | 80,300 | 5,100 | 6.4% |
| Reigate and Banstead | 137,800 | 126,500 | 11,300 | 8.9% |
| Runnymede | 80,500 | 78,000 | 2,500 | 3.2% |
| Spelthorne | 95,600 | 90,400 | 5,200 | 5.8% |
| Surrey Heath | 86,200 | 80,300 | 5,900 | 7.3% |
| Tandridge | 83,000 | 79,300 | 3,700 | 4.7% |
| Waverley | 121,600 | 115,700 | 5,900 | 5.1% |
| Woking | 99,200 | 89,800 | 9,400 | 10.5% |
Age
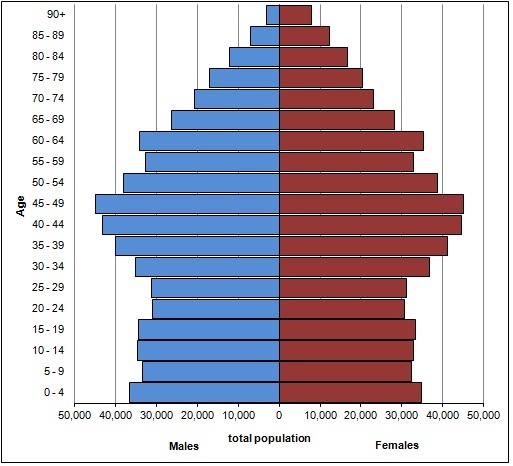
The largest 5 year cohort is aged 45-49 with a population of 89,700. This reflects the baby boom of the early 1960s. The fastest growing cohort since 2001 is the 60-64 age group which has increased by 35%. This reflects the post war baby boom.
Table 2: Surrey Population by 5 year age group
| Age | 2011 Census | 2001 Census | change | % change |
| All ages | 1,132,400 | 1,059,000 | 73,400 | 6.9% |
| Age 0-4 | 71,300 | 62,800 | 8,500 | 13.5% |
| Age 5-9 | 65,800 | 65,600 | 200 | 0.3% |
| Age 10-14 | 67,600 | 65,300 | 2,300 | 3.5% |
| Age 15-19 | 67,700 | 59,800 | 7,900 | 13.2% |
| Age 20-24 | 61,500 | 56,400 | 5,100 | 9.0% |
| Age 25-29 | 62,200 | 64,200 | -2,000 | -3.1% |
| Age 30-34 | 71,900 | 79,700 | -7,800 | -9.8% |
| Age 35-39 | 81,000 | 88,500 | -7,500 | -8.5% |
| Age 40-44 | 87,700 | 78,900 | 8,800 | 11.2% |
| Age 45-49 | 89,700 | 71,500 | 18,200 | 25.5% |
| Age 50-54 | 76,600 | 78,700 | -2,100 | -2.7% |
| Age 55-59 | 65,600 | 64,000 | 1,600 | 2.5% |
| Age 60-64 | 69,400 | 51,400 | 18,000 | 35.0% |
| Age 65-69 | 54,300 | 46,600 | 7,700 | 16.5% |
| Age 70-74 | 43,600 | 41,400 | 2,200 | 5.3% |
| Age 75-79 | 37,700 | 35,400 | 2,300 | 6.5% |
| Age 80-84 | 28,900 | 24,900 | 4,000 | 16.1% |
| Age 85-89 | 19,100 | 15,700 | 3,400 | 21.7% |
| Age 90+ | 10,900 | 8,200 | 2,700 | 32.9% |
Gender
Overall 51% of the Surrey population is female and 49% male. The proportion of females is greater in the older age groups as shown in Figure 1.
Figure 1: Surrey population by 5 year age group and sex (population pyramid)
Key age groups
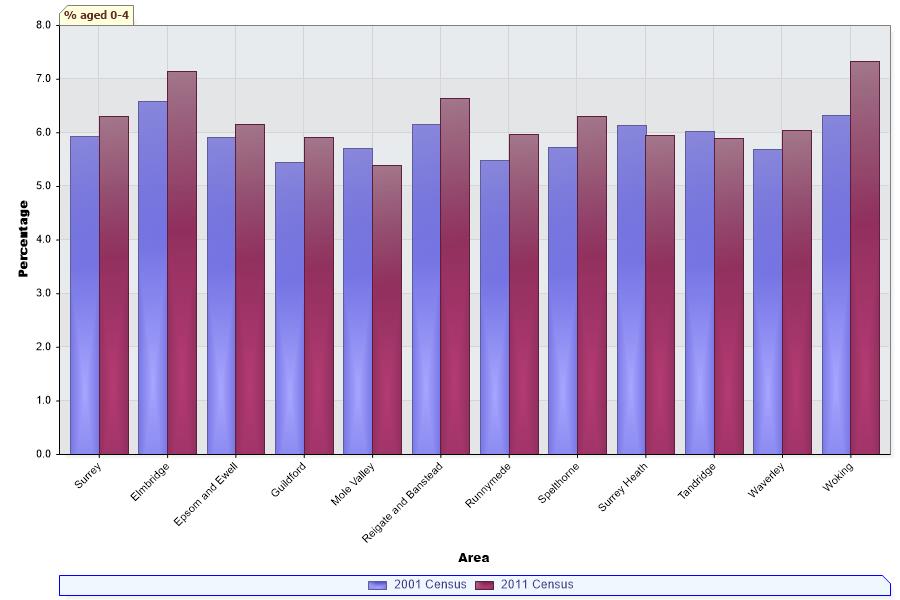
Under 5
The population aged 0-4 has increased by 13.5% since 2001. This age group makes up 6.3% of the population, up from 5.9% in 2001.
Table 3: Change in population aged 0-4 by Local Authority
| Area | 2011 Census | 2001 Census | change | % change |
| Surrey | 71,300 | 62,800 | 8,500 | 13.5% |
| Elmbridge | 9,400 | 8,000 | 1,400 | 17.5% |
| Epsom and Ewell | 4,600 | 4,000 | 600 | 15.0% |
| Guildford | 8,100 | 7,100 | 1,000 | 14.1% |
| Mole Valley | 4,600 | 4,600 | 0 | 0.0% |
| Reigate and Banstead | 9,200 | 7,800 | 1,400 | 17.9% |
| Runnymede | 4,800 | 4,300 | 500 | 11.6% |
| Spelthorne | 6,000 | 5,200 | 800 | 15.4% |
| Surrey Heath | 5,100 | 4,900 | 200 | 4.1% |
| Tandridge | 4,900 | 4,800 | 100 | 2.1% |
| Waverley | 7,300 | 6,600 | 700 | 10.6% |
| Woking | 7,300 | 5,700 | 1,600 | 28.1% |
Figure 2: Percentage of population age 0-4
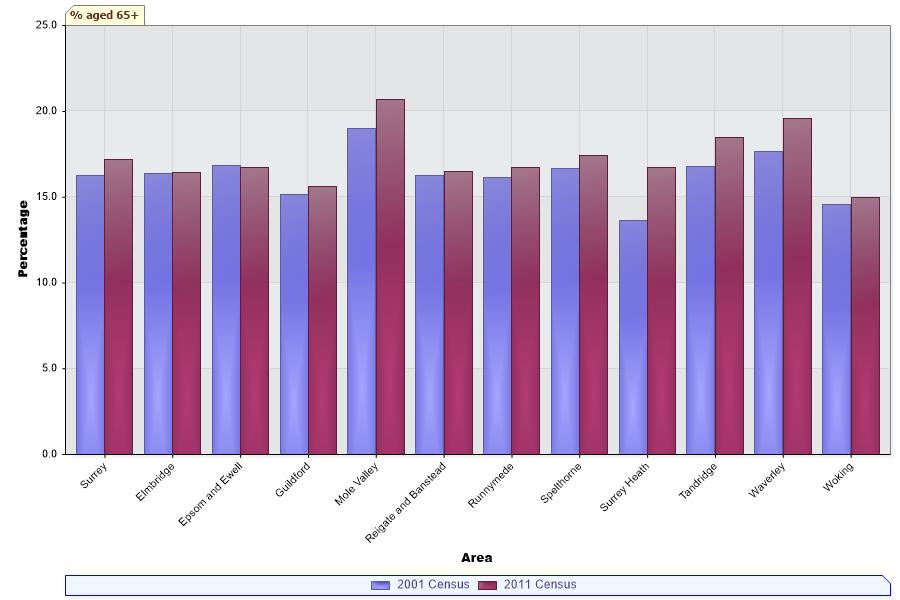
Over 65
The population aged over 65 has increased by 13% since 2001. This age group makes up 17.2% of the population, up from 16.3% in 2001.
Table 4: Change in population aged 65+ by Local Authority
| Area | 2011 Census | 2001 Census | change | % change |
| Surrey | 194,500 | 172,200 | 22,300 | 13.0% |
| Elmbridge | 21,400 | 20,000 | 1,400 | 7.0% |
| Epsom and Ewell | 12,600 | 11,300 | 1,300 | 11.5% |
| Guildford | 21,400 | 19,700 | 1,700 | 8.6% |
| Mole Valley | 17,800 | 15,300 | 2,500 | 16.3% |
| Reigate and Banstead | 22,700 | 20,600 | 2,100 | 10.2% |
| Runnymede | 13,400 | 12,600 | 800 | 6.3% |
| Spelthorne | 16,600 | 15,100 | 1,500 | 9.9% |
| Surrey Heath | 14,500 | 11,000 | 3,500 | 31.8% |
| Tandridge | 15,400 | 13,300 | 2,100 | 15.8% |
| Waverley | 23,800 | 20,400 | 3,400 | 16.7% |
| Woking | 14,900 | 13,100 | 1,800 | 13.7% |
Figure 3: Percentage of population age 65+
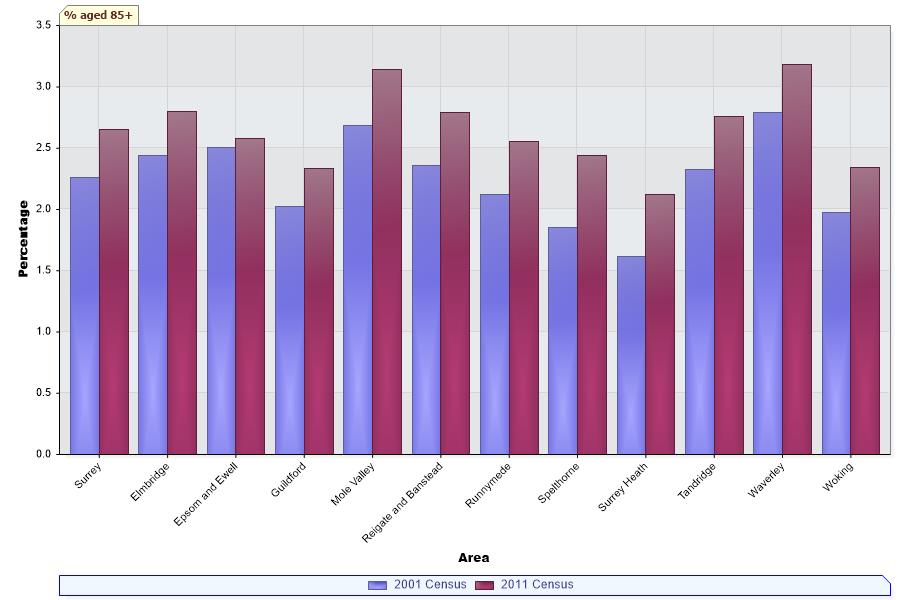
Over 85
The population aged over 85 has increased by 25.5% since 2001. This age group makes up 2.7% of the population, up from 2.3% in 2001.
Table 5: Change in population aged 85+ by Local Authority
| Area | 2011 Census | 2001 Census | change | % change |
| Surrey | 30,000 | 23,900 | 6,100 | 25.5% |
| Elmbridge | 3,600 | 3,000 | 600 | 20.0% |
| Epsom and Ewell | 1,900 | 1,700 | 200 | 11.8% |
| Guildford | 3,200 | 2,600 | 600 | 23.1% |
| Mole Valley | 2,700 | 2,200 | 500 | 22.7% |
| Reigate and Banstead | 3,800 | 3,000 | 800 | 26.7% |
| Runnymede | 2,000 | 1,700 | 300 | 17.6% |
| Spelthorne | 2,300 | 1,700 | 600 | 35.3% |
| Surrey Heath | 1,800 | 1,300 | 500 | 38.5% |
| Tandridge | 2,300 | 1,800 | 500 | 27.8% |
| Waverley | 3,900 | 3,200 | 700 | 21.9% |
| Woking | 2,300 | 1,800 | 500 | 27.8% |
Figure 4: Percentage of population age 85+
Households and household size
The total number of households in Surrey, counted by the 2011 Census was 455,800. This is an increase of 22,600 (5.2%) since 2001.
In contrast to the trend over recent censuses of a decreasing household size, the average household size in Surrey has increased from 2.38 in 2001 to 2.43 in 2011. Average household size has increased in all districts except Tandridge.
Table 6: Households by Local Authority
| Area | 2011 Census | 2001 Census | change | % change |
| Surrey | 455,800 | 433,200 | 22,600 | 5.2% |
| Elmbridge | 52,900 | 50,600 | 2,300 | 4.5% |
| Epsom and Ewell | 29,800 | 27,400 | 2,400 | 8.8% |
| Guildford | 54,000 | 52,400 | 1,600 | 3.1% |
| Mole Valley | 35,800 | 33,600 | 2,200 | 6.5% |
| Reigate and Banstead | 55,400 | 51,700 | 3,700 | 7.2% |
| Runnymede | 32,700 | 31,700 | 1,000 | 3.2% |
| Spelthorne | 39,500 | 38,400 | 1,100 | 2.9% |
| Surrey Heath | 33,500 | 31,700 | 1,800 | 5.7% |
| Tandridge | 33,300 | 31,600 | 1,700 | 5.4% |
| Waverley | 49,300 | 47,200 | 2,100 | 4.4% |
| Woking | 39,500 | 36,900 | 2,600 | 7.0% |
Table 7: Average household size by Local Authority
| Area | 2011 Census | 2001 Census |
| Surrey | 2.43 | 2.38 |
| Elmbridge | 2.45 | 2.38 |
| Epsom and Ewell | 2.48 | 2.41 |
| Guildford | 2.42 | 2.37 |
| Mole Valley | 2.35 | 2.35 |
| Reigate and Banstead | 2.42 | 2.38 |
| Runnymede | 2.36 | 2.34 |
| Spelthorne | 2.4 | 2.34 |
| Surrey Heath | 2.52 | 2.48 |
| Tandridge | 2.43 | 2.44 |
| Waverley | 2.38 | 2.36 |
| Woking | 2.49 | 2.41 |
Response rates and estimation of population
The figures presented in this report are the estimated total population based on the actual census count and data from the Census Coverage Survey. The overall response rate for Surrey was 95%.
The Office for National Statistics has undertaken a rigorous quality assurance process on these estimates using a range of administrative data to validate them.