2021 Census: Hours Worked
Hours Worked from the 2021 Census
The raw data from this Census release has been processed by the Population Insight Team and is also available on Surrey-i.
As stressed by the Office for National Statistics: ‘Census 2021 took place during the coronavirus (COVID-19) pandemic, a period of unparalleled and rapid change; the national lockdown, associated guidance and furlough measures will have affected the labour market topic.’ Therefore, caution should be applied when using these figures for planning and policy purposes.
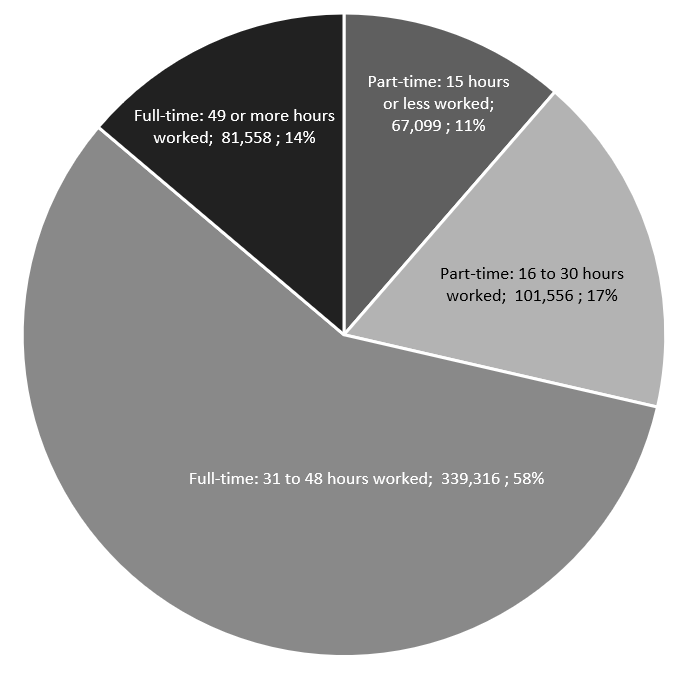
Of the 589,529 residents of Surrey were in employment the week before the 2021 Census, 71.4 per cent were in full-time employment (420,874) and 28.6 per cent were in part-time employment (168,655). The number of hours worked per week before the census includes paid and unpaid overtime. This covers the main job of anyone aged 16 years and over.
Those in full-time employment who worked 31 to 48 hours made up more than half of Surrey residents in employment at the time of the 2021 Census at 58 percent and represented 339,316 residents.
The second largest group were residents who were in part-time employment and worked for 16 to less than 30 hours per week (17% which represented 101,556 residents).
The proportion of hours worked by Surrey residents in employment, 2021
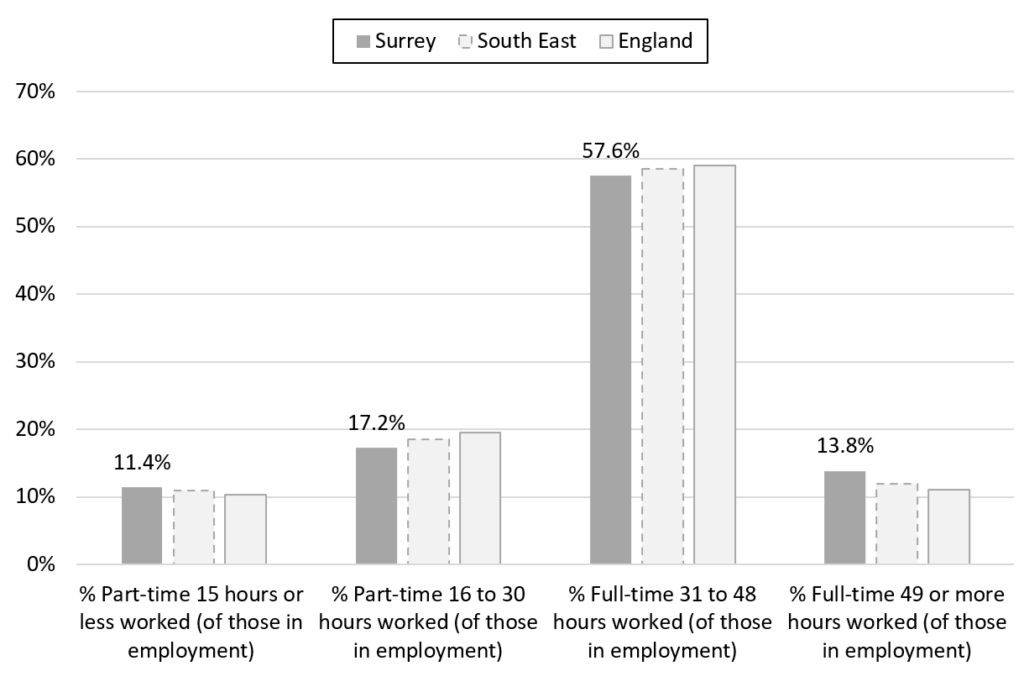
The distribution of full-time and part-time employment across Surrey was largely similar to the South East and England averages. The main difference between Surrey and England were that Surrey residents were slightly more likely to work the longest hours (Full-time work for 49 or more hours) at 13.8 per cent compared to England (11.1%).
While 28.6 per cent of Surrey residents were in part-time employment (29.8% for England), a higher proportion of these part-time workers worked the shortest hours (40% of part-time workers in Surrey worked for 15 hours or less compared to 35% in England).
The proportion of Surrey residents in part-time and full-time employment by hours worked, 2021
Waverley had the highest proportion of employed residents who were in part-time employment at just under a third (31.3%), while Woking had the lowest proportion at 27.2 per cent.
The proportion of Surrey residents in part-time and full-time employment, 2021
| Area name | % Part-time (of those in employment) | % Full-time (of those in employment) | Total part-time | Total full-time |
|---|---|---|---|---|
| Surrey | 28.6% | 71.4% | 168,655 | 420,874 |
| Elmbridge | 28.3% | 71.7% | 18,965 | 48,017 |
| Epsom and Ewell | 28.1% | 71.9% | 11,220 | 28,689 |
| Guildford | 28.9% | 71.1% | 20,161 | 49,613 |
| Mole Valley | 31.0% | 69.0% | 13,129 | 29,212 |
| Reigate and Banstead | 28.0% | 72.0% | 21,058 | 54,069 |
| Runnymede | 29.0% | 71.0% | 12,322 | 30,135 |
| Spelthorne | 26.6% | 73.4% | 13,714 | 37,825 |
| Surrey Heath | 27.3% | 72.7% | 12,384 | 32,979 |
| Tandridge | 29.3% | 70.7% | 12,489 | 30,086 |
| Waverley | 31.1% | 68.9% | 18,892 | 41,830 |
| Woking | 27.2% | 72.8% | 14,323 | 38,419 |
| South East | 29.5% | 70.5% | 1,320,834 | 3,150,945 |
| England | 29.8% | 70.2% | 7,871,438 | 18,533,776 |