2021 Census: Sexual Orientation
Sexual orientation from the 2021 Census
The raw data from this Census release has been processed by the Population Insight Team and is also available on Surrey-i.
The Office for National Statistics produced interactive maps for the 2021 Census results. The ONS interactive map of the sexual orientation statistics have been embedded at the bottom of this page.
Sexual orientation was included in the Census for the first time in 2021. As stated on the Office for National Statistics summary: ‘Sexual orientation is an umbrella term covering sexual identity, attraction, and behaviour. For an individual respondent, these may not be the same. For example, someone in an opposite-sex relationship may also experience same-sex attraction, and vice versa. This means the statistics should be interpreted purely as showing how people responded to the question, rather than being about whom they are attracted to or their actual relationships.‘
‘The question was voluntary and was only asked of people aged 16 years and over. People were asked “Which of the following best describes your sexual orientation?”. The different sexual orientations that people could choose from included:
- straight or heterosexual
- gay or lesbian
- bisexual
- other sexual orientation
If they selected “Other sexual orientation”, they were asked to write in the sexual orientation with which they identified.‘
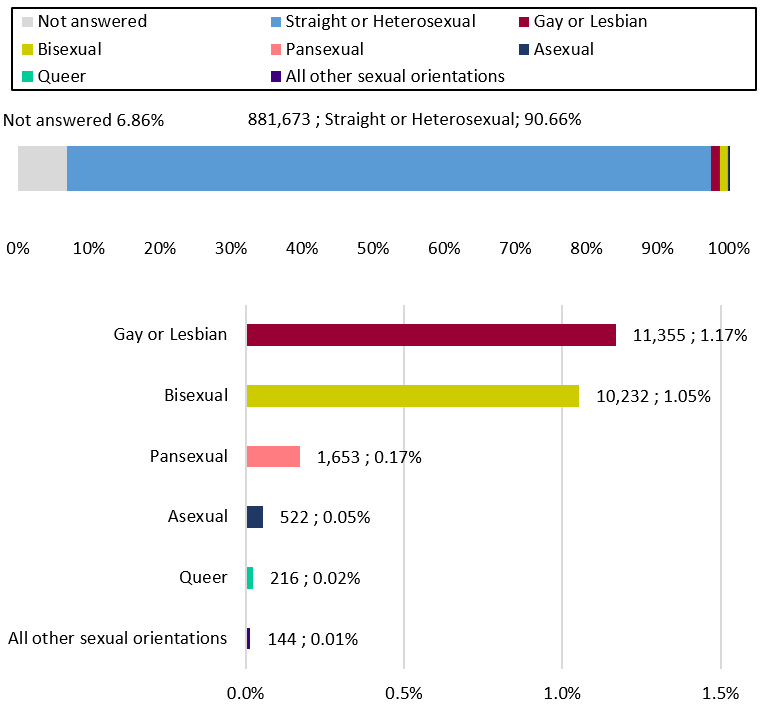
In total, 905,795 Surrey residents answered the question (93.1% of the Surrey population aged 16 years and over which is slightly higher than the 92.5% of the England population).
In total:
- 881,673 people (90.66% of the Surrey population aged 16 years and over) identified as straight or heterosexual
- 11,355 (1.17%), described themselves as gay or lesbian
- 10,232 (1.05%) described themselves as bisexual
- 2,535 (0.26%) selected “Other sexual orientation”
The overall number of residents of Surrey who identified with an LGB+ orientation (representing all sexual orientations apart from heterosexual and straight) was therefore 24,122 and represented 2.48 per cent of the population aged 16 years and over.
Of those who selected “Other sexual orientation”, the most common write-in responses included:
- 1,653 pansexual (0.17% of the Surrey population)
- 522 asexual (0.05%)
- 216 queer (0.02%)
Another 144 residents (0.01%) wrote in a different sexual orientation.
The remaining 66,717* people aged 16 years and over (6.86%* of Surrey residents) did not answer the question on sexual orientation.
*Please note that these figures differ slightly to the earlier non-response figures which was concerned with responses to the initial question on sexual orientation with broad categories, this is because these higher non-response rates now include the non-responses to further defining ‘other sexual orientation’ answers in the write-in box.
Sexual orientation of usual Surrey residents aged 16 and over, 2021
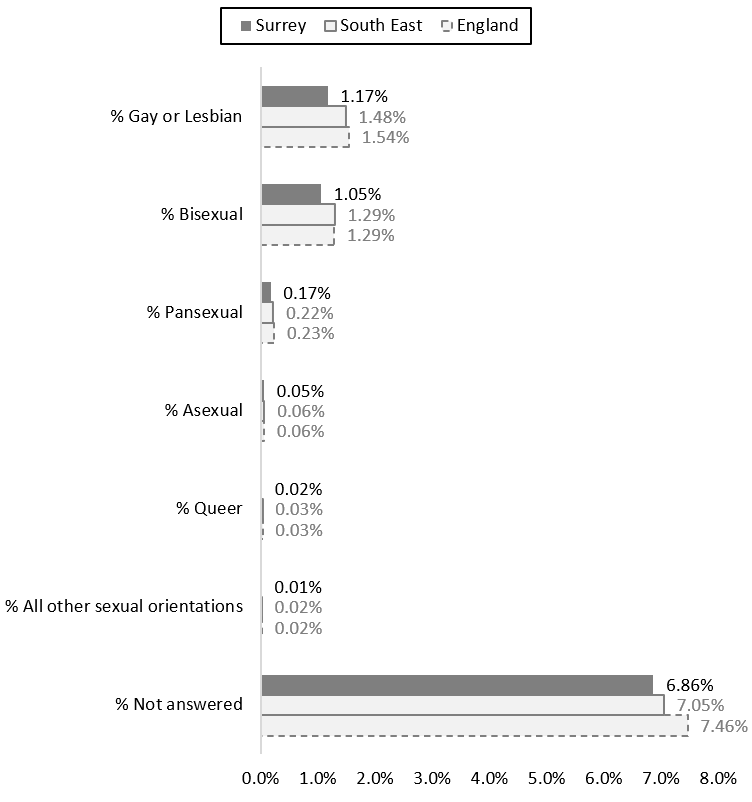
Surrey had a lower proportion of residents who reported that they identified with an LGB+ orientation (2.48%) than the South East (3.11%) and England as a whole (3.17%). This was even though a lower proportion of Surrey residents did not answer the question on sexual orientation.
Surrey also had a lower proportion of residents reporting each specific LGB+ orientation than the South East and England.
Sexual orientation of Surrey, South East, and England residents aged 16 and over in 2021
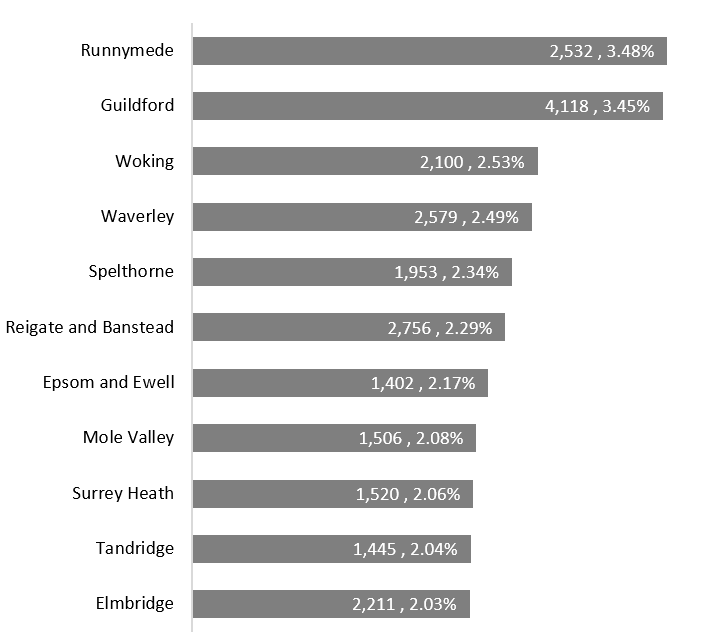
While nine of the eleven districts and boroughs in Surrey had lower proportions of residents who reported that they identified with an LGB+ orientation than England’s 3.17 per cent, Runnymede and Guildford had higher proportions than the England average at 3.48 per cent and 3.45 per cent respectively. Elmbridge had the lowest proportion of residents who reported that they identified with an LGB+ orientation at 2.03 per cent.
The percentage of Surrey residents aged 16 and over who reported a identifying with an LGB+ orientation, 2021
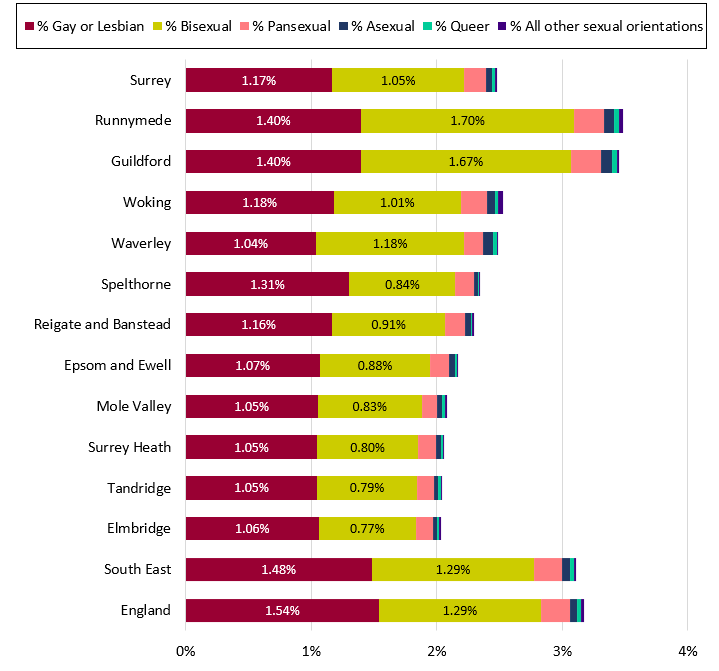
The majority of Surrey residents who reported that they identified with an LGB+ orientation identified as gay, lesbian, or bisexual. In the two Surrey districts and boroughs with higher proportions of LGB+ residents (Runnymede and Guildford), a higher proportion of all residents reported that they identified as bisexual (1.70% and 1.67% respectively) compared to gay or lesbian (1.40%). The detailed breakdown of sexual orientation is available on the Surrey-i data page.
Sexual orientation of residents aged 16 and over of the districts and boroughs in Surrey, 2021
The Office for National Statistics has produced interactive maps for the 2021 Census results. The maps below show the distribution of LGB+ residents.
Hover over the map to see each of the area names and values. Zoom in and out of these maps to see the data at smaller geographical areas.