Deaths in England
The death trends in the UK have varied over time, influenced by factors like aging populations, medical advancements, and pandemics like COVID-19. Here's a brief overview of recent death trends in the UK. From 2010 to 2019, the annual number of deaths in the UK remained relatively stable, ranging between 500,000 to 600,000 deaths per year. The number of deaths had been gradually rising due to an aging population, but improvements in healthcare helped manage premature mortality.
During the COVID-19 pandemic, deaths spiked significantly. In 2020, the UK recorded around 697,000 deaths, the highest since World War II, due to the direct and indirect impacts of the pandemic. The pandemic led to "excess deaths," meaning the number of deaths was higher than expected based on historical trends. COVID-19 became a leading cause of death during this period. In 2021, while the death toll remained elevated, vaccinations led to a significant reduction in COVID-related deaths, especially among the elderly.
Regions across the UK have continued to record excess deaths even after the peaks related to the COVID-19 pandemic in 2020-2021. The UK Office for National Statistics (ONS) have calculated that there were roughly 7% or 44,255 more deaths registered in the UK in 2022 based on comparison with the five-year average. In the first six months of 2023, this trend persisted with 9% or 28,024 more deaths recorded than expected. In the UK, deaths must be reported to the Local Registration Service, in partnership with the General Register Office (GRO). This is a legal requirement as set out in the Births and Deaths Registration Act (1836).
Deaths in Surrey
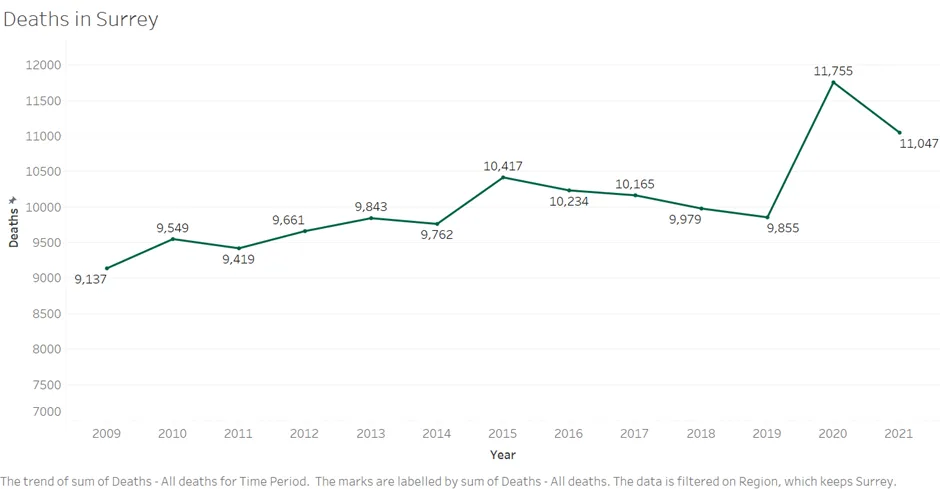
Assessing the number and rate of deaths (or mortality) in any population is important in understanding and monitoring the health status of a whole community. The below chart (Figure 1) shows the trends in death rates in Surrey from 2009 to 2021. As of 2021, the death rate had begun to return closer to pre-pandemic levels, with far fewer COVID-19 deaths due to widespread immunity and improved treatments. However, deaths in 2021 remained slightly elevated compared to the 2010s average, partially due to delayed healthcare during the pandemic and long-term impacts on health services. Surrey continues to experience an aging population, which will likely sustain a gradual increase in annual deaths over time.
Cause of Death
Understanding the underlying causes of mortality, the prevalence and trends in premature (deaths before 75 years of age) and preventable mortality (causes of death that can be mainly avoided through effective public health and primary prevention interventions) are particularly important. There will be multiple causes for these excess deaths, which will include the direct effects of Covid-19 pandemic, pressures on the NHS services resulting in poorer outcomes, disruption to chronic disease detection and management as well as demographic changes. The office for Health Improvement and Disparities found evidence of reduced ED attendances of patients with health issues during the COVID19 pandemic peak in England and an associated time-lagged increase in mortality.
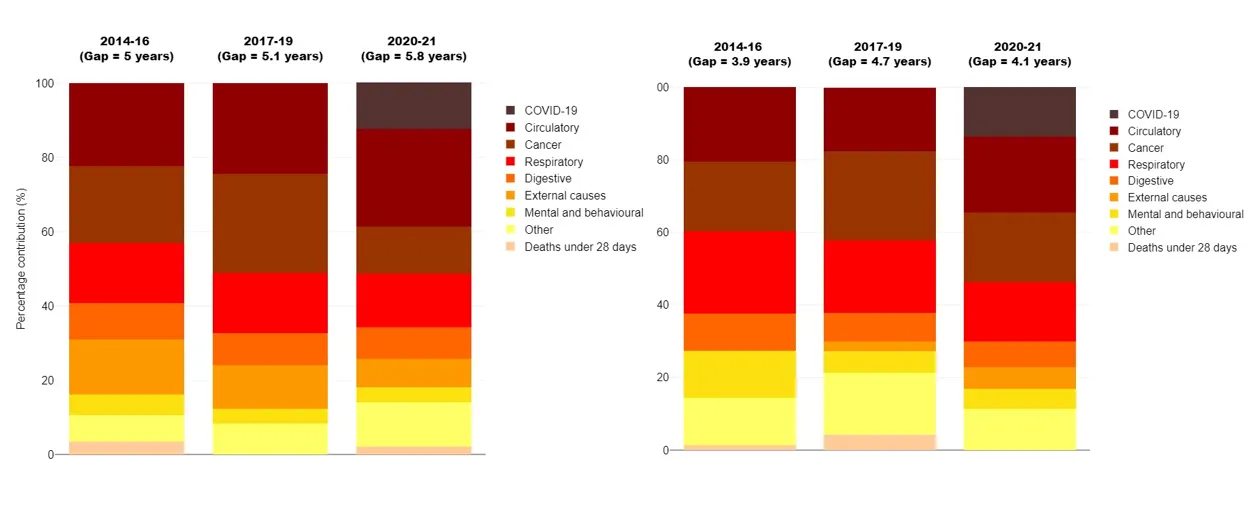
The figures below, from the OHID Segment Tool shows the broad cause of death the contribution (number of years that each cause contributes to the overall life expectancy gap between the most and least deprived quintiles of Surrey in 2020 to 2021. Data are only available for areas where the life expectancy in the most deprived quintile is lower than life expectancy in the least deprived quintile. Circulatory disease, cancer and respiratory deaths are the largest groups contributing to the gap in male and female life expectancy in Surrey.
Breakdown of the life expectancy gap between the most and least deprived quintiles of Surrey by cause of death, 2014 to 2016 to 2020 to 2021, Males & Females
Death by Age
Since approximately 2011, the rate of increase in life expectancy has slowed. More recently the coronavirus (COVID-19) pandemic led to increased mortality in 2020 and 2021, and the impact of this is seen in the life expectancy estimates for 2020 to 2022. The reasons for the post-2011 slowdown in life expectancy improvements and 2015 fall in life expectancy have been widely debated.
Public health data shows that residents of Surrey have longer life expectancy than people in the Southeast and England as a whole. The life expectancy at birth in Surrey for those born in 2020 to 2022 was 81.1 for men and 84.7 for women (compared to 80.1 and 83.8 for the Southeast and 78.9 and 82.8 for England).
Many of the factors contributing to inequality in life expectancy are preventable.3 Inequalities can also exist through specific characteristics such as sex, ethnicity, disability and social exclusion. These inequalities were made very clear in the recent COVID-19 pandemic where mortality rates were often highest in groups which already experienced poorer overall outcomes. The Covid-19 epidemic caused life expectancy in 2020 to fall to its lowest levels in a decade and has affected the population disproportionally across different geographic and socio-economic groups Surrey.
Breakdown of the life expectancy gap between the most and least deprived quintiles of Surrey by age group, 2014 to 2016 to 2020 to 2021, Males & Females
Concluding Remarks
Living a longer, healthier life requires a holistic approach. Eating a balanced diet, staying active, prioritizing mental health, avoiding harmful habits, and keeping up with routine healthcare can all contribute to a longer life. Each of these elements supports not only longevity but also a higher quality of life, helping you to feel your best at any age.