This page includes explorable data and a summary of carbon dioxide emissions.
Areas included: Surrey LAs.
Latest data included: 2019.
Summary
This publication combines data from the UK’s Greenhouse Gas Inventory with data from a number of other sources, including local energy consumption statistics, to produce a nationally consistent set of carbon dioxide emissions estimates at local authority level from 2005 to 2019. Emissions are likely to have changed since the start of the COVID-19 pandemic but this data has not yet been published.
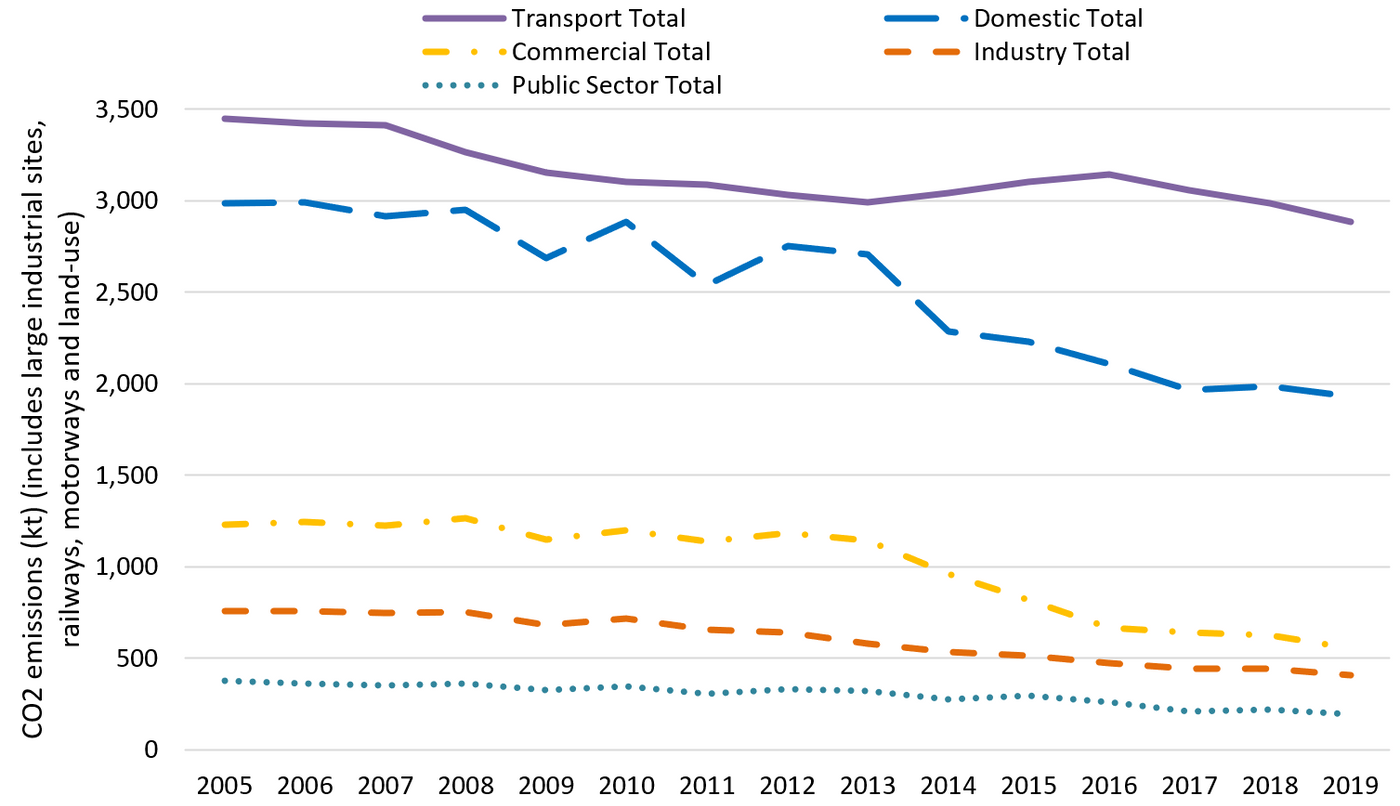
In Surrey, the highest amount of carbon dioxide emissions results from transport at 2,882 kt CO2 in 2019. Domestic emissions are the second largest contributors, although the levels of these emissions have been declining steadily since 2014 from 2,285 to 1,927 in 2019. Commercial emissions have also declined in Surrey since 2013 from 1,143 to 555 in 2019.
Estimates of territorial CO2 emissions estimates in Surrey from 2005 to 2019 – including large industrial sites, railways, motorways and land-use
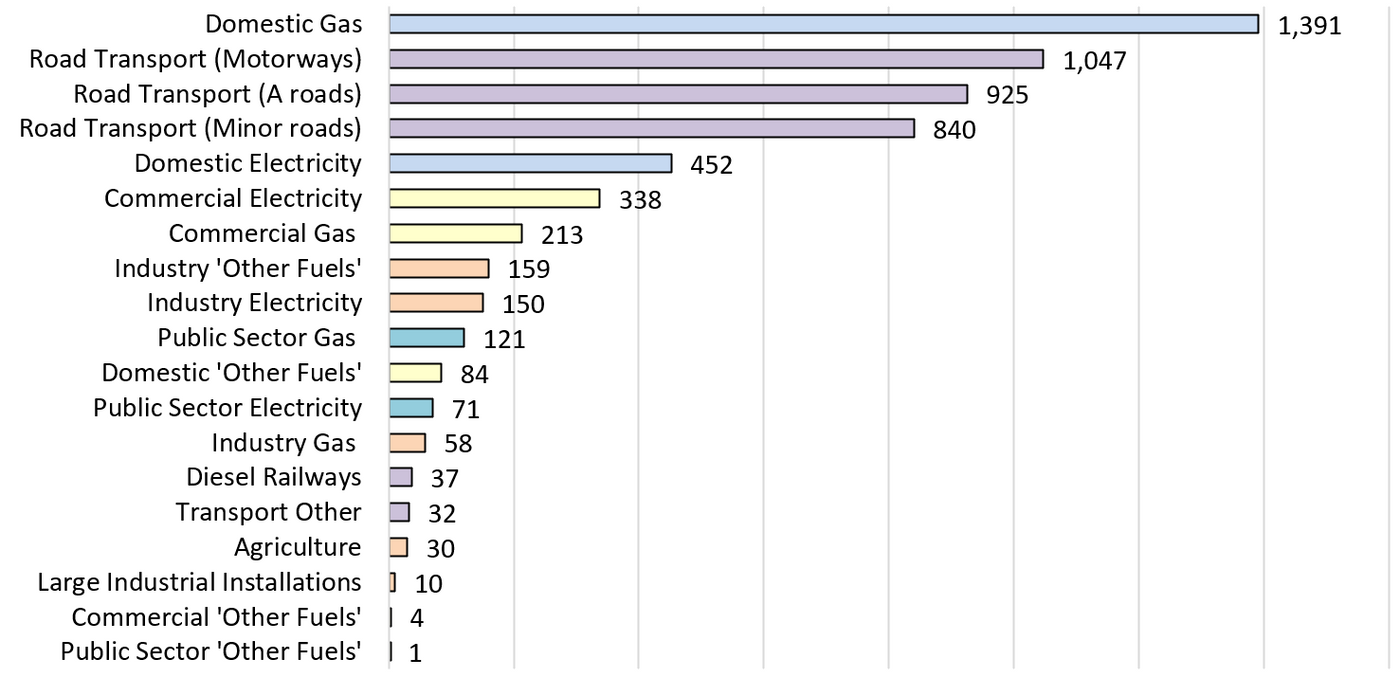
The following graph uses the same colours in the previous graph to categorise each specific contributor of carbon emission, i.e., transport is in purple. Although the largest total carbon dioxide emissions were from transport, the largest individual contributor for 2019 in Surrey was domestic gas (1,391 kt). This was followed by motorways (1,047 kt), A roads (925 kt), and minor roads (840 kt).
Estimates of territorial CO2 emissions estimates in Surrey from 2005 to 2019 by producer – including large industrial sites, railways, motorways and land-use
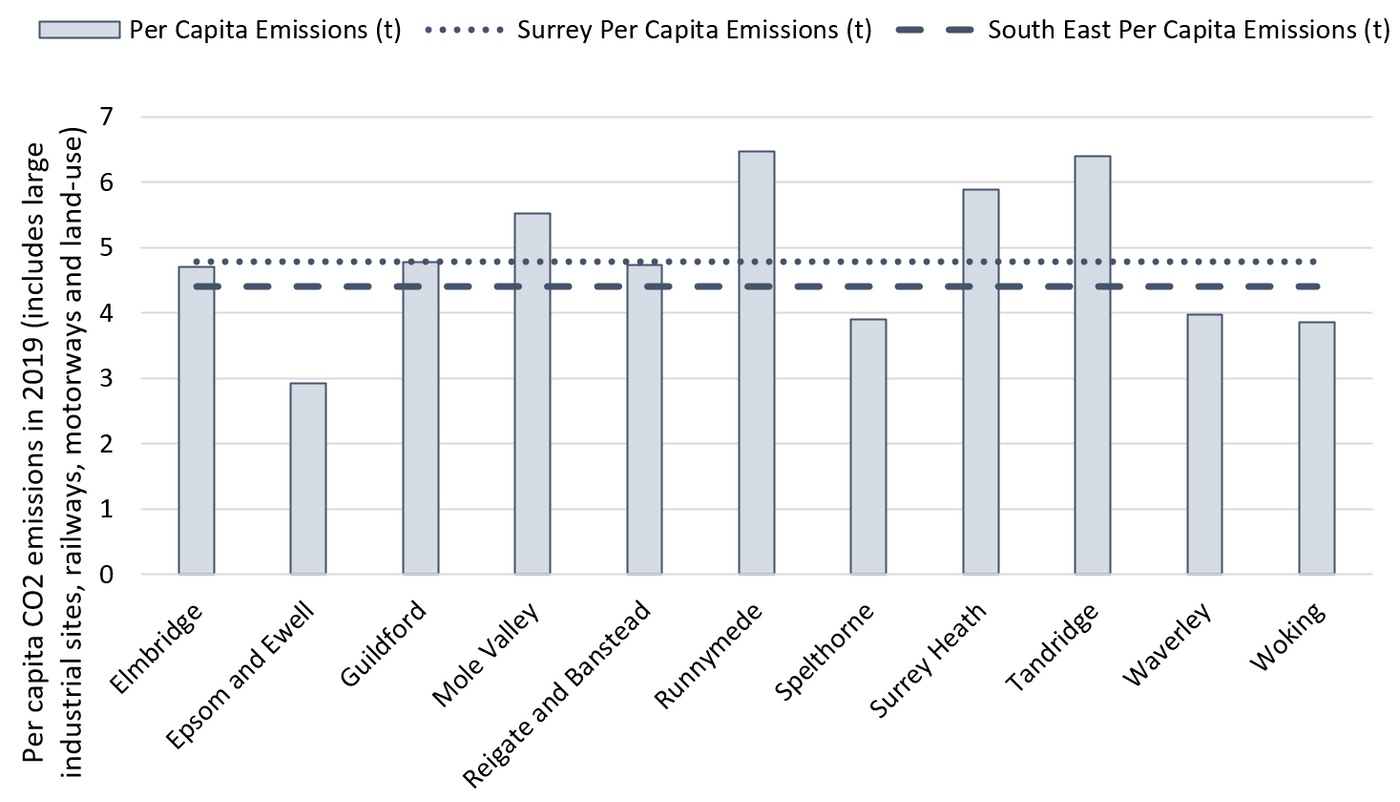
The data about total emissions are also produced per capita (emissions per population). Surrey per capita emissions were slightly higher than the South East at 4.79 compared to 4.41 in 2019 (including large industrial sites, railways, motorways and land-use). Runnymede has the highest per capita carbon dioxide emissions at 6.47 kt per capita, compared to the lowest at 2.92 kt per capita in Epsom and Ewell.
Estimates of territorial CO2 emissions in Surrey in 2019 – including large industrial sites, railways, motorways and land-use
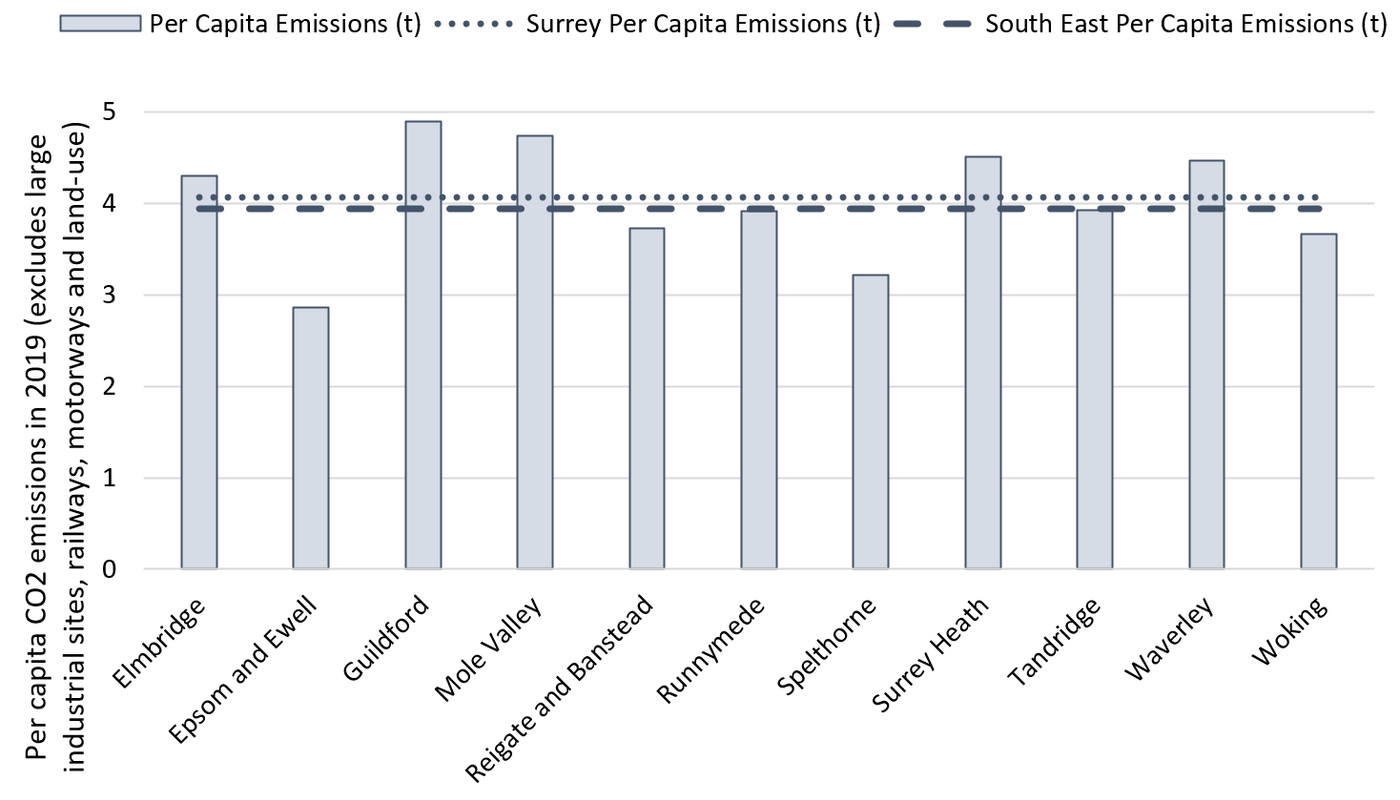
After excluding large industrial sites, railways, motorways and land-use, Runnymede no longer had the highest carbon dioxide emissions per capita in 2019. When excluding such emissions, Guildford had the highest per capita emissions in 2019 at 4.9 kt per capita and Epsom and Ewell had the lowest at 2.9 kt per capita.
Estimates of territorial CO2 emissions in Surrey in 2019 – not including large industrial sites, railways, motorways and land-use
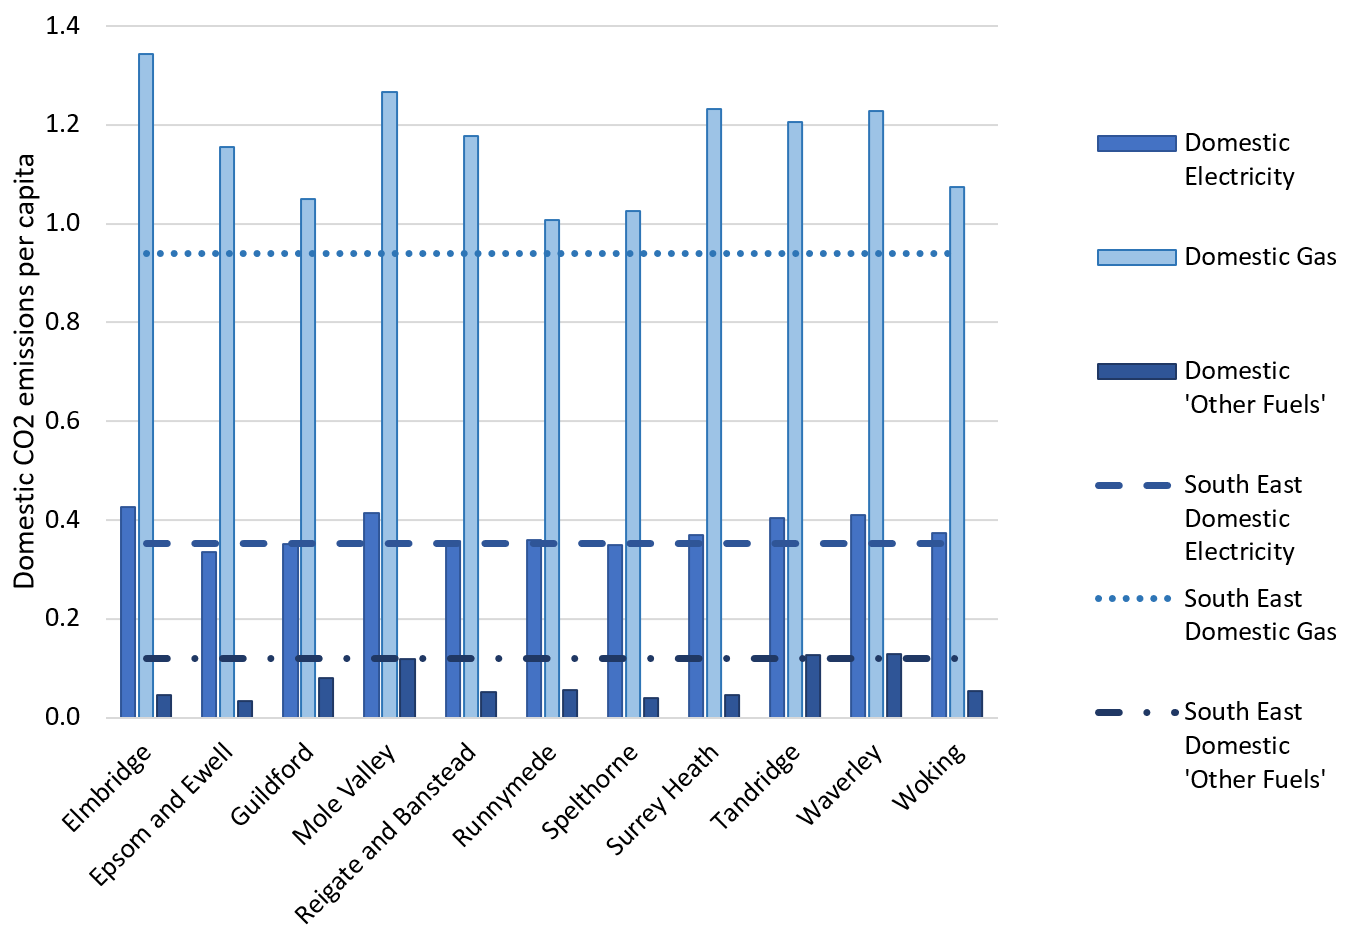
The following graphs presents the per capita carbon dioxide emissions from domestic sources for 2019 across the local authorities in Surrey. The domestic electricity CO2 emissions were slightly higher in Surrey at 0.38 in 2019 compared to the South East as a whole at 0.35. Elmbridge, Mole Valley, Surrey Heath, Tandridge, Waverley, and Woking had higher domestic electricity per capita emissions that the South East average. Epsom and Ewell had the lowest domestic electricity carbon dioxide emissions per capita in Surrey in 2019 (0.33 kt per capita). Every local authority in Surrey had higher domestic gas per capita emissions than the South East (the Surrey per capita emissions were 1.16 compared to 0.94 for the South East). Elmbridge had the highest per capita domestic gas emissions in Surrey for 2019 at 1.34 kt per capita compared to Runnymede with the lowest at 1.01 kt per capita. The Surrey carbon dioxide emissions from domestic ‘other fuels’ per capita was lower (0.07 kt per capita) than for the South East (0.12 kt per capita) in 2019.
Estimates of per capita domestic territorial CO2 emissions in 2019, by local authority
About the data
These statistics provide the most reliable and consistent breakdown of CO2 emissions across the country, using nationally available data sets going back to 2005.
The main data sources are the UK National Atmospheric Emissions Inventory and the BEIS National Statistics of energy consumption for local authority areas. All emissions included in the national inventory are covered, except aviation, shipping and military transport, for which there is no obvious basis for allocation to local areas.
Source

