Food and Health
Food and Health
Publication Date
This chapter was published in January 2025.
Contents
- Executive Summary
- Background
- National context
- Local context
- Food and health inequalities
- Food and its impact on health
- Role of food in healthy living and ageing
- Malnutrition
- Factors that influence how we choose what we eat
- Food and its impact on climate change
- Community engagement
- Weight management services
- NICE guidelines
- Recommendations
- Acknowledgements
- References
1. Executive Summary
Our food system is complex, involving many stakeholders and facing significant challenges such as rising food poverty, increasing reliance on food banks, natural resource depletion, and the effects of climate change, including declining soil and air quality. The cost of agricultural commodities, driven by global gas prices, has added new layers of difficulty. Additionally, obesity has emerged as a major public health concern in recent years. In the UK, approximately 1 in 4 adults and 1 in 5 children aged 10 to 11 are living with obesity.
Obesity places a significant burden on the NHS, costing around £6.5 billion annually. It is the second leading preventable cause of cancer and a major risk factor for other serious conditions, including diabetes, heart disease, respiratory issues, and musculoskeletal problems. Beyond physical health, obesity also affects mental wellbeing, particularly in children. The increasing consumption of foods high in salt, sugar and ultra processed carbohydrates, and unhealthy fats has also contributed to a rise in type 2 diabetes diagnoses among young children.
2. Background
Food is much more than just sustenance; it connects people, influences the environment, drives economic growth by creating jobs, impacts health, and is central to our cultural life. The way Surrey’s food system functions and what we consume are critical factors in making Surrey a better place to live, work, and visit. Food also plays a key role in promoting fairness, economic equality, and strengthening community cohesion. Food systems are international, and have impacts far away from Surrey’s borders.
However, our food system is complex, involving many stakeholders and facing numerous challenges, such as rising childhood obesity, food poverty, increased reliance on food banks, natural resource depletion, and climate impacts such as global and local loss of harvests due to flood and drought, deteriorating soil and air quality. The rising cost of food, driven by global gas prices and climate change impacts, has introduced new difficulties for many. Our food system is also causing problems, with about a third of all human-caused greenhouse gas emissions linked to food, and it is the primary driver for biodiversity loss.
Diet has now become the leading risk factor for preventable diseases (National Food Strategy, 2021) [1], significantly affecting public health, leading to debilitating illnesses, and placing an unsustainable burden on the NHS. This issue is not about individual willpower or a lack of knowledge, but rather the outcome of a food environment that makes unhealthy choices easier, especially for those with limited time and resources.
3. National context
The National Food Strategy, published in 2021, addresses the urgent challenges in our food system. Key priorities include reducing diet-related inequalities, optimising land use, and promoting a cultural shift toward healthier food choices. In June 2022, the government responded with a series of commitments, including:
- Consulting on mandatory industry reporting on health, with potential exploration of environmental and animal welfare impacts
- Exploring public food procurement policies, aiming for 50% locally sourced or higher-standard food.
More recently in November 2024, the report, “A Recipe for Health: Fixing Our Broken Food System [2]“, published by the UK Parliament’s House of Lords, explores the health, environmental, and social impacts of the current food system. Key points include:
- The urgent need to combat diet-related illnesses and health disparities.
- Reducing the environmental impacts of food production, emphasising sustainability.
- Addressing food affordability and accessibility challenges.
- Recommendations for government policies to incentivise healthier and sustainable food choices, reformulate products, and regulate advertising.
- Calls for long-term strategies integrating health, environment, and economic goals.
4. Local context
4.1 Surrey Health and Wellbeing Strategy (2022)
Surrey’s Health and Wellbeing Strategy highlights the significance of food in addressing both health and broader socioeconomic factors. Under Priority One, the strategy emphasises promoting healthy lifestyles by preventing physical illness and enhancing physical wellbeing. Priority Three focuses on helping people reach their full potential by addressing the wider determinants of health, including access to nutritious food.
4.2 Surrey County Council’s Organisation Strategy (2023-2028)
Surrey County Council’s Organisation Strategy aims to combat inequality and ensure no one is left behind. One of its four priorities is to “tackle health inequality,” which will be achieved through partnerships and service delivery, spearheaded by the Health and Wellbeing Board.
4.3 Surrey’s Climate Change Strategy (2019-2050)
Surrey’s Climate Change Strategy reflects the shared ambition of its 12 local authorities to create clean, safe, and green communities where residents and organisations take responsibility for the environment. As part of the county’s goal to achieve net-zero carbon emissions by 2050, the strategy focuses on land use and food systems. This includes the development of a land use framework to increase green spaces and promote sustainable farming practices in line with national targets.
4.4 Surrey Heartlands Integrated Health Strategy
The first ambition of Surrey Heartlands Integrated Health Strategy (Prevention) aligns with the priorities set out in Surrey’s Health and Wellbeing Strategy, reinforcing efforts to improve the overall health of the community.
5. Food and health inequalities
According to the World Food Summit 1996, “Food security exists when all people, at all times, have physical and economic access to sufficient, safe, and nutritious food that meets their dietary needs and food preferences for an active and healthy life.” It is experienced at differing levels of severity, measured on the Food Insecurity Experience Scale [3] (Figure 1).
Figure 1. Stages of food security and insecurity
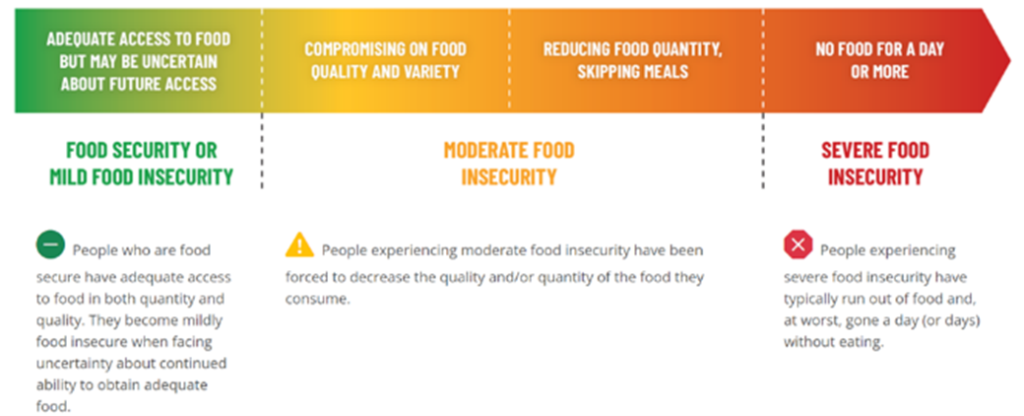
Source: Food Insecurity Experience Scale
Addressing the immediate impacts of food insecurity is crucial, but preventing poverty more broadly is also essential. The root causes of food inequalities are complex and multifaceted, often stemming from broader social, economic, and environmental factors. Understanding these factors at the local level can help tailor preventive interventions to the specific context.
Generally, those with limited financial resources are more severely affected by food insecurity, leading to poorer health outcomes. Food poverty impacts individuals across all ages but particularly affects the physical and cognitive development of children, with lifelong implications for their health, social, and economic prospects, and can contribute to child neglect. This in turn increases the demand for NHS services to treat the acute and chronic conditions caused by hunger and unhealthy diets.
5.1 Drivers of the current level of food insecurity
The main driver of food insecurity for British households is the rapidly rising cost of food (driven by a variety of factors, one of them being climate change impacts). Inflation in the cost of household goods reached 10.1% in July 2022 and although it has been slightly decreasing, its financial impact on some households is ongoing [4].
5.1.1 Geographical variation
There are variations in the prevalence of food insecurity across the nations and regions of the UK. In England, Northern Ireland, and Scotland, the rates are similar to the UK average, with England at 14%, Northern Ireland at 16%, and Scotland at 17%. However, Wales has a significantly higher rate at 20%. Within England, the North East has the highest rate of food insecurity at 26%, while the South East (6%), South West (8%), and East Midlands (8%) report notably lower rates compared to other regions (Figure 2).
Figure 2. Mapping food insecurity across the UK [5]

The national data highlights the impact of food inequity on vulnerable groups. In June 2023, 9 million adults (17% of households) experienced food insecurity. Three million adults (5.9% of households) reported not eating for a whole day due to inability to afford or access food.
The Priority Places for Food Index Version 2 (PPFI) rank is used to assess levels of food insecurity. It is a composite index formed of data compiled across seven different dimensions relating to food insecurity risk for the four nations in the UK. It is constructed using open data to capture complex and multidimensional aspects of food insecurity. It has been developed in response to the 2022 cost of living crisis which puts many of our communities under severe financial pressure and at an increased risk of food insecurity. Source data provides ranks at Lower layer Super Output Area (LSOA) level. Ranks for other geographies are derived from these, therefore LSOA ranks are often used to ensure the greatest accuracy. A lower rank indicates higher food insecurity.
In the latest data released from Consumer Data Research Centre (CDRC) in 2023, Spelthorne, Tandridge, Reigate and Banstead, and Woking are the districts/boroughs with the highest levels of food insecurity in Surrey (Figure 3).
Figure 3. Food insecurity measured by local authorities and deprivation score in Surrey (2023)
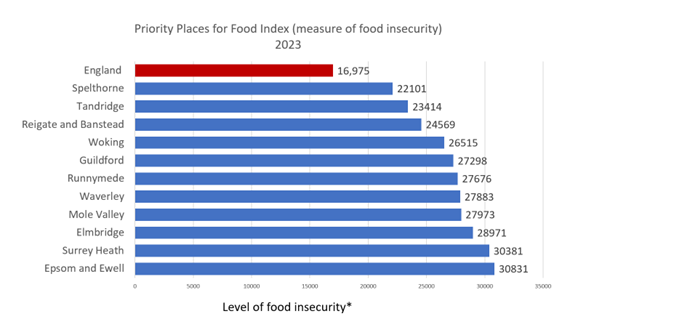
* Low rank indicates high level of food insecurity
Source: Food Insecurity Experience Scale
Deprivation score (IMD 2019) by local authority (2019)
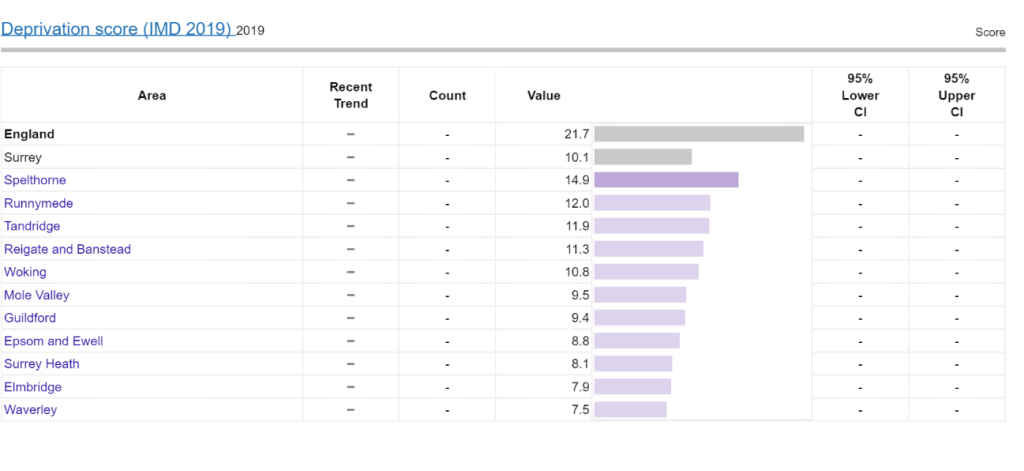
Source: Public Health Fingertips
Abbreviations: IMD, Index of Multiple Deprivation
5.1.2. Groups more likely to experience food insecurity
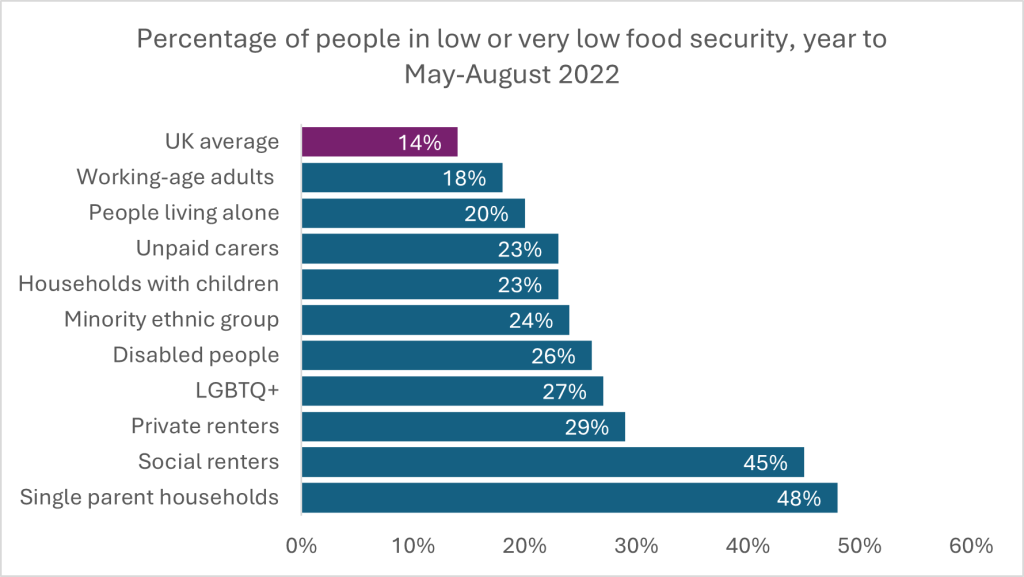
According to a survey conducted by Trussell Trust (June 2023) [6], certain groups are more likely to be affected by food insecurity. These include households with children, particularly single-parent households; renters; LGBTQ+ individuals; people with disabilities; people from minority ethnic groups; and unpaid carers (Figure 4).
The Food insecurity (Direct measure) is a complementary indicator providing a direct assessment of households experiencing food insecurity at regional and national (England) levels. The direct measure is based on data from the Family Resources Survey. Data show 7,570 (0.6%) of the Surrey population live in areas at high risk of food insecurity (2022) [7]. Data also show in 2022/23 there were 15,687 (6.7%) children in absolute low-income families (under 16) which is lower than England (15.6%). [5]
People with a disability have been impacted by the cost-of-living crisis as shown in a survey produced by Surrey Coalition for Disabled People [8]. Rates of food insecurity vary greatly by demographics, with a notable difference in levels and experiences between income groups. Low-income and disabled groups continue to be at disproportionately high risk of household food insecurity and its potential negative impacts. General inflation including energy price increases have heightened the risk of these households needing to make difficult trade-offs with their food budgets.
Key statistic: 84% of households with disabled people are classified as food secure compared to 94% for households without disabled people in FYE 2023 [9]
Figure 4. Groups with higher risk of household food insecurity [10]
Source: Hunger in the UK
In 2023, Surrey Coalition of Disabled People (The Coalition) reported that the cost-of-living crisis had impacted 97% of their members surveyed , 45% reported they had gone without food and 62% had not used their local food bank or community fridge. In a follow up report on the views of disabled people on food support in Surrey, The Coalition found 59% could not get to their nearest food bank.
In April 2024, The Coalition – in partnership with Good Company and funded by Surrey County Council – launched the Access to Food scheme. Access to Food provides funding to people struggling with the cost of living who have difficulty due to disability or long-term health condition, to get to their local food bank. The scheme covers the cost of a taxi to a local food bank or in exceptional circumstances, a supermarket voucher.
The Coalition’s interim report found the following:
1) Access to Food Totals (from April to October 2024):
- 1342 visits to the Access to Food webpage from 695 visitors.
- 29 enquired about or applied to Access to Food.
- 15 referrals to food banks by The Coalition, out of these 6 were delivered.
- 2 taxi journeys covered by The Coalition
- 16 households granted supermarket vouchers (distributed by Good Company)
2) Inaccessible Food Banks
Despite Disabled people being substantially over-represented amongst people using food banks, there is little research into the accessibility of food banks. (Source: Hunger in the UK)
In May 2024, The Coalition contacted all Surrey’s providers of food banks with an accessibility checklist. 17 out of 39 (43%) food bank providers responded.
The Coalition found:
- 17 (100%) of food banks surveyed could accommodate dietary requirements for intolerances (dairy-free/gluten-free), allergies, autism etc.
- 16 (94%) food banks’ volunteers or staff are not trained in disability awareness.
- 13 (76%) food banks deliver in special circumstances, with 3 delivering as standard.
- 13 (76%) signpost clients to additional services.
- 9 (64%) food banks are accessible for wheelchair users (venues includes ramp and handrails)
- 9 (64%) food banks have an Accessible toilet
- 8 (57%) run drop-in advice centres or cafes
- 6 (42%) food banks hold Disabled parking spaces
- 5 (29%) food banks had volunteers or staff with lived experience of disability or long-term health conditions.
- 3 (21%) food banks include Hearing Loops (sometimes called an audio induction loop; a special type of sound system for use by people with hearing aids.)
- 3 (21%) food banks have quieter rooms for clients to use.
- 0 (0%) food banks held Autism hours.
5.2. Food insecurity and its health impact across life course
Food insecurity not only affects nutrition and wellbeing but also exacerbates existing health inequalities. The lack of access to sufficient, nutritious food leads to a range of adverse health outcomes, further entrenching disparities across various dimensions of health. This impacts the population across the life course (Figure 5).
Food insecurity is linked to an increased risk of chronic diseases such as diabetes, hypertension, and cardiovascular diseases. These conditions are more prevalent in disadvantaged populations, creating a cycle where poor nutrition worsens health, leading to increased healthcare needs and costs. Despite the association with hunger, food insecurity often leads to higher rates of obesity, especially in low-income households. This “obesity paradox” arises from reliance on cheaper, calorie-dense, but nutritionally poor foods, leading to weight gain and related health issues. Healthier foods are more than twice as expensive per calorie as less healthy foods. Between October 2021 and October 2022, the price of fruit rose by 10.3% and vegetables by 15.1%. The impact of food on health is covered in detail in Section 6 of this chapter (Food and its impact on health).
Food insecurity is closely associated with mental health challenges, including stress, anxiety, and depression. The psychological strain of food scarcity disproportionately affects marginalised groups, deepening mental health disparities.
Figure 5. Impacts of food insecurity across the life course
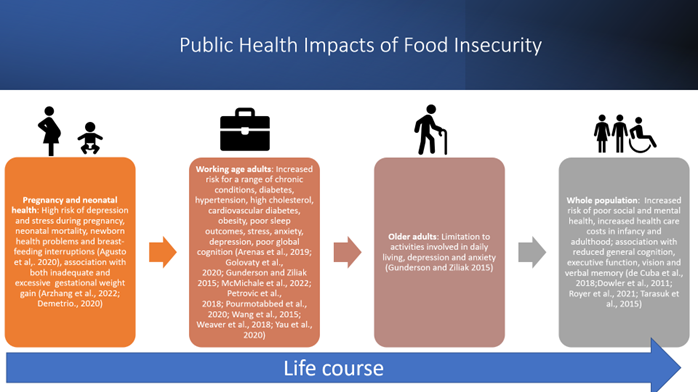
Children in food-insecure households are more likely to experience developmental delays, cognitive impairments, and mental health issues. These early life impacts can limit educational attainment and future economic prospects, perpetuating health and social inequalities.
5.3. National interventions
5.3.1. Healthy Start
The Healthy Start scheme is a national, means-tested program designed to support eligible low-income families by providing free vitamins from pregnancy until a child turns four. The scheme also offers financial assistance to purchase fruits, vegetables, pulses, cow’s milk, or Step One formula milk. At the time of writing this chapter (November 2024), the scheme has been unavailable to women and birthing individuals housed in Home Office Accommodation for approximately two years. Families who qualify can use their Healthy Start card to access vitamins for women and birthing individuals during pregnancy and while breastfeeding or chest-feeding, as well as vitamin drops for children up to the age of four. Initially this offer was provided to families through a voucher scheme, but it moved to a card format in early 2022.
Research on the impact of Healthy Start shows it plays a crucial role in helping pregnant women, birthing individuals, and their children, access healthier foods. Those enrolled in the programme have reported that it encouraged them to think more about their health and diet, leading to improved dietary choices (National Food Strategy 2021) [11].
The uptake of the Healthy Start scheme has been low nationally and locally. Nationally, between January 2019 and February 2020, uptake of the voucher scheme fell significantly. By January 2021, a similar level of uptake was reported in most districts in Surrey, indicating that participation remained stable during the pandemic (Table 1). By August 2021, uptake had started to rise across all Surrey districts, with all (apart from Elmbridge) exceeding the levels seen in January 2019 (Table 1).
Table 1. Uptake of Healthy Start Vouchers/Card Scheme by Surrey Districts and Boroughs from 2019 to 2023
| District/Borough | Voucher Uptake January 2019 | Voucher Uptake February 2020 | Voucher Uptake January 2021 | Card Scheme Uptake January 2023 |
| Elmbridge | 55% | 48% | 45% | 55% |
| Epsom and Ewell | 54% | 45% | 47% | 60% |
| Guildford | 55% | 46% | 45% | 58% |
| Mole Valley | 54% | 48% | 42% | 49% |
| Reigate and Banstead | 56% | 44% | 45% | 59% |
| Runnymede | 53% | 44% | 45% | 56% |
| Spelthorne | 50% | 45% | 45% | 60% |
| Surrey Heath | 52% | 48% | 47% | 58% |
| Tandridge | 51% | 43% | 42% | 62% |
| Waverley | 45% | 46% | 43% | 54% |
| Woking | 47% | 42% | 46% | 55% |
Despite the recent improvements in the uptake by the eligible population, Surrey has a lower uptake than the national target and is worse compared to the uptake nationally and regionally (Figure 6).
Figure 6. Healthy Start uptake across South East NHS Integrated Care Systems (ICS) compared with England and national target (to July 2023)
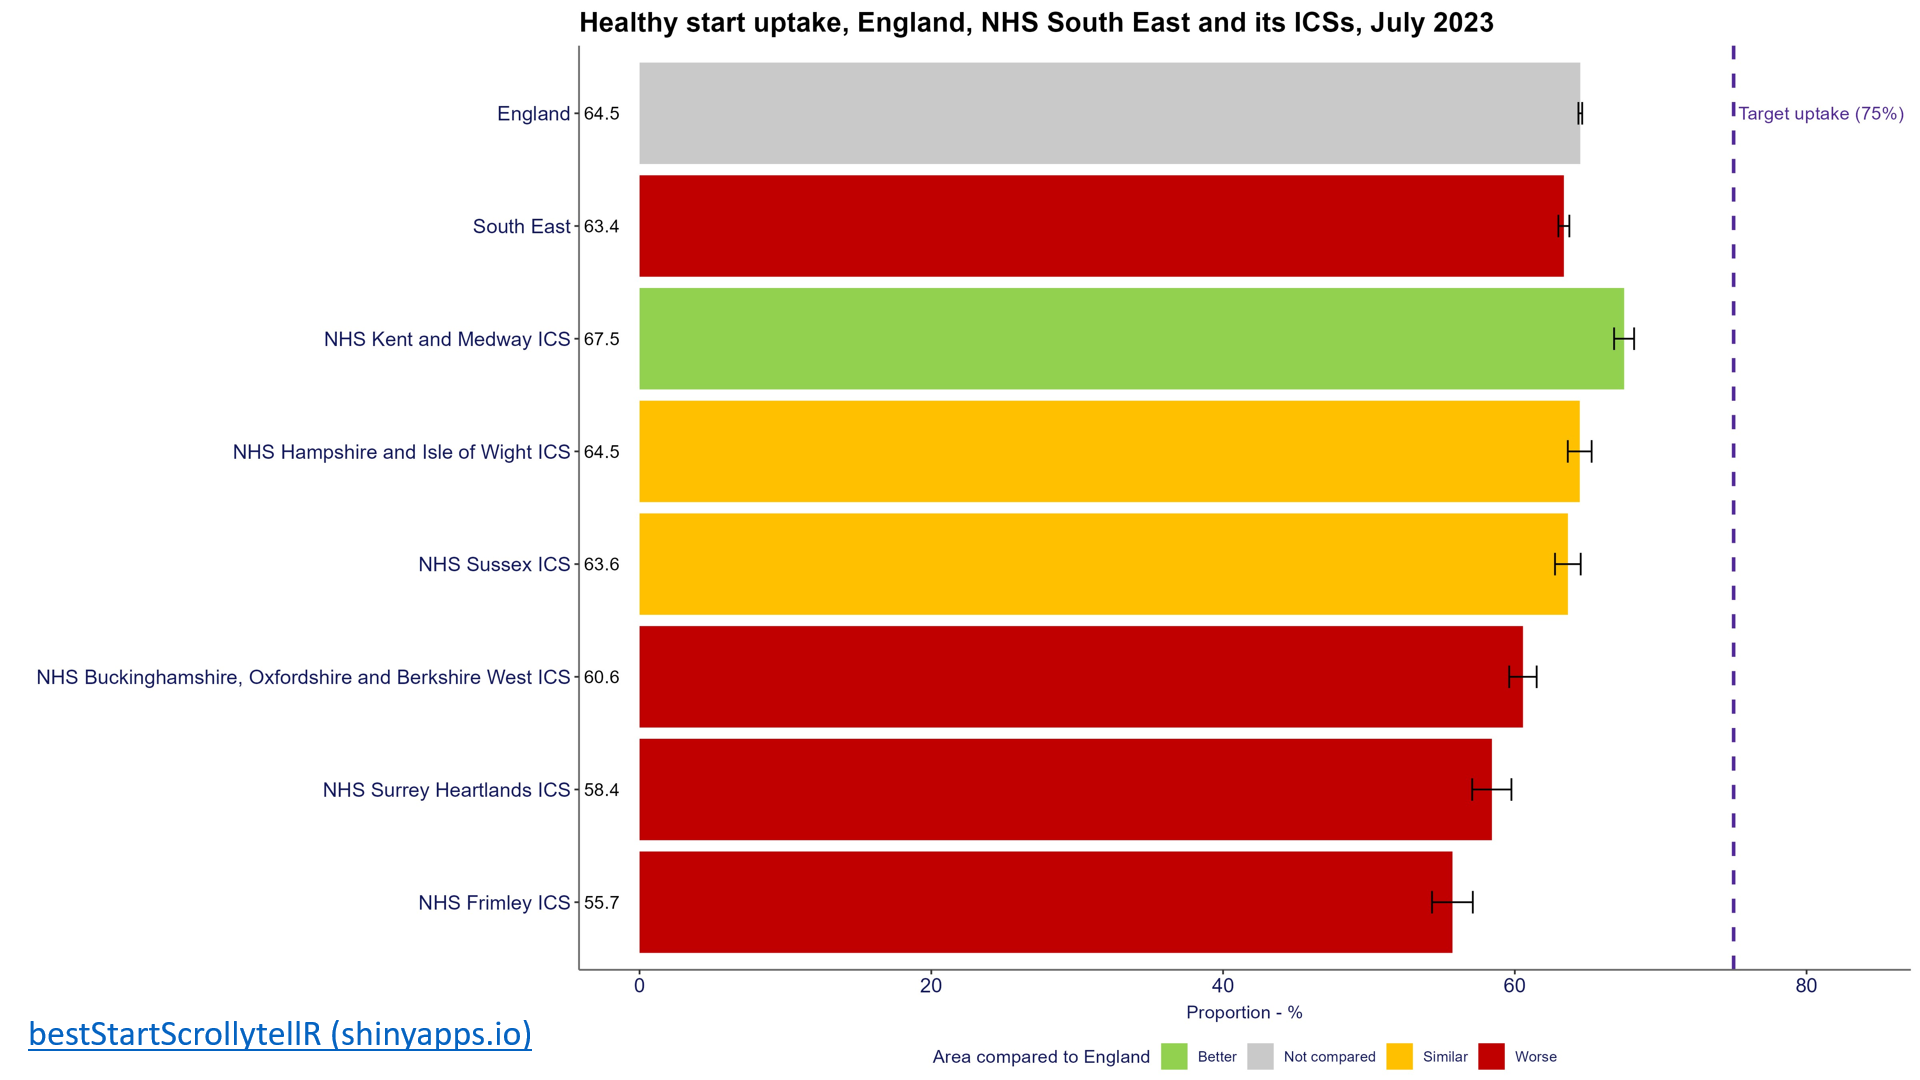
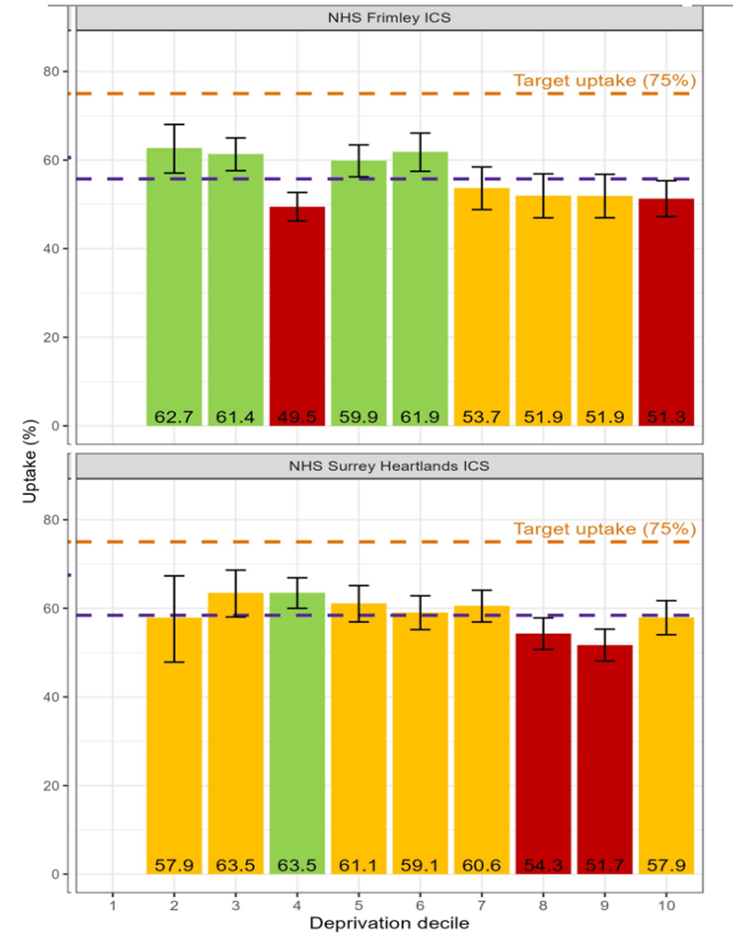
The uptake is lower in the most deprived areas of the County (Figure 7). In Surrey, Woking (52%), Waverley (52%) and Epsom and Ewell (54%) have the lowest uptake by total eligible beneficiaries, followed by Mole Valley (57%). However, uptake in all Surrey’s districts and boroughs is below England’s average (64.5%) (Figure 7).
Figure 7. Uptake of Health Start in Surrey (July 2023)
Uptake of Healthy Start by NHS ICS in Surrey (July 2023)
(1=most deprived, 10= least deprived)
Uptake of Healthy Start by eligible population across Surrey Districts and Boroughs (July 2023)
| Local Authority | Ranking (where 1 is the highest) | Total Entitled Beneficiaries | Total Eligible Beneficiaries | Uptake (%) |
| Elmbridge | 2 | 326 | 545 | 60 |
| Epsom and Ewell | 5 | 176 | 323 | 54 |
| Guildford | 3 | 388 | 656 | 59 |
| Mole Valley | 5 | 188 | 330 | 57 |
| Reigate and Banstead | 1 | 472 | 743 | 64 |
| Runnymede | 3 | 310 | 527 | 59 |
| Spelthorne | 4 | 465 | 807 | 58 |
| Surrey Heath | 4 | 233 | 403 | 58 |
| Tandridge | 4 | 321 | 552 | 58 |
| Waverley | 6 | 246 | 469 | 52 |
| Woking | 6 | 285 | 545 | 52 |
To address this, and in line with the principles of proportionate universalism, efforts should also focus on increasing local participation both locally and nationally.
5.3.2. School Meals – Surrey County Council
All children are entitled to receive a free school meal. Free school meals are available to pupils in receipt of, or whose parents are in receipt of, one or more of the following benefits [12]:
- Universal Credit (provided you have an annual net earned income of no more than £7,400, as assessed by earnings from up to three of your most recent assessment periods)
- Income Support
- Income-based Jobseeker’s Allowance
- Income-related Employment and Support Allowance
- Support under Part VI of the Immigration and Asylum Act 1999
- The guarantee element of Pension Credit
- Child Tax Credit (provided you’re not also entitled to Working Tax Credit and have an annual gross income of no more than £16,190)
- Working Tax Credit run-on – paid for four weeks after you stop qualifying for
- Working Tax Credit
A pupil is only eligible to receive a free school meal when a claim for the meal has been made on their behalf and their eligibility, or protected status, has been verified by the school where they are enrolled or by the local authority
Recent data show that although Surrey has a lower number of children eligible for free school meals (FSMs) compared with other SE local authorities and England, the proportion has been increasing since 2017/18 from 7.2% to 13.9% in 2022/23 (Figure 8).
Figure 8. Percentage of students eligible for FSMs in Surrey
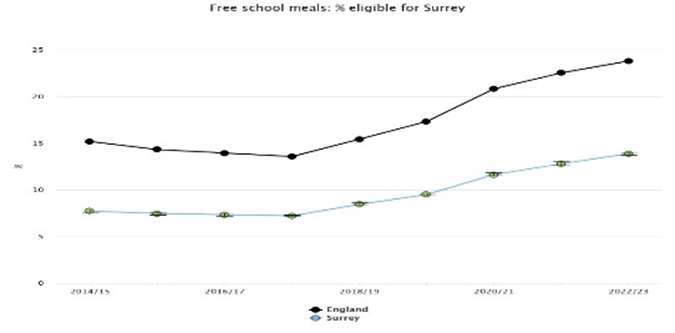
Source: Child and Maternal Health – OHID (phe.org.uk)
Figure 9 shows the percentage of pupils known to be eligible for free school meals who attend state-funded nursery, primary, secondary, alternative provision (AP) schools and special schools, and non-maintained special schools.
Figure 9. Percentage of students eligible for FSMs in Surrey compared with neighbouring average (2022 to 2023)

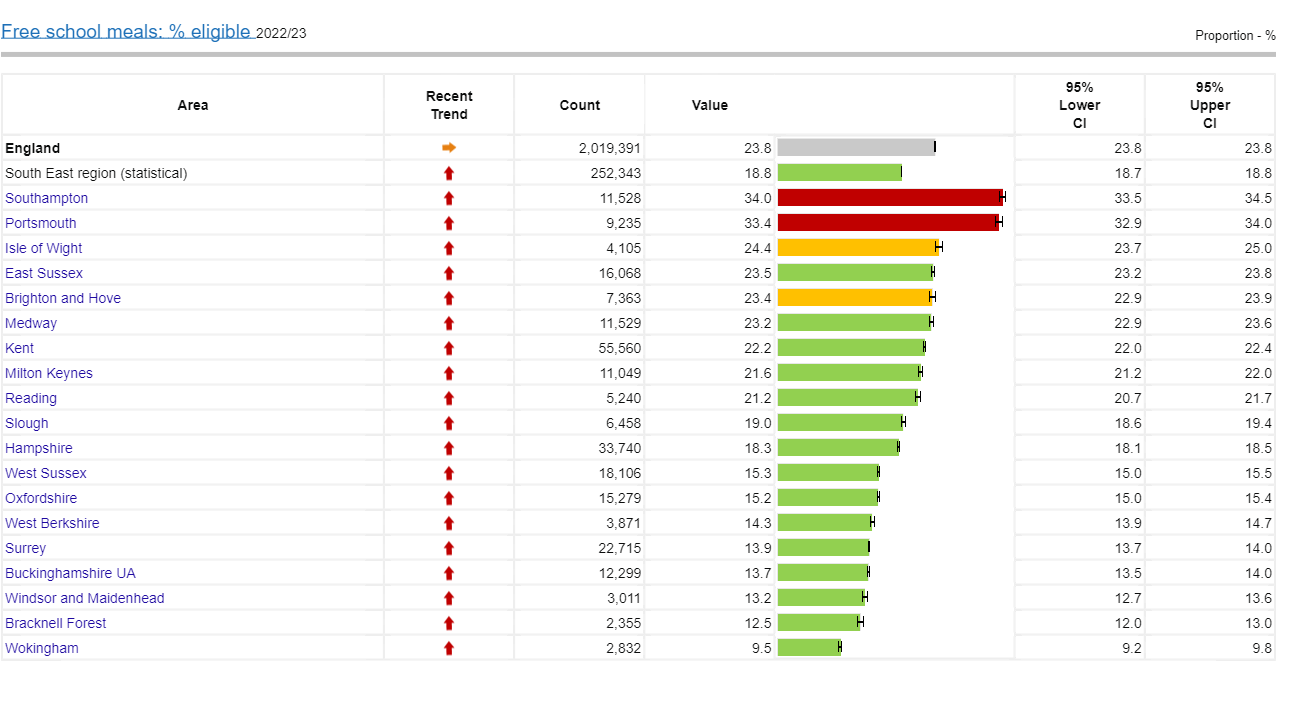
Source: Child and Maternal Health | Fingertips | Department of Health and Social Care (2023)
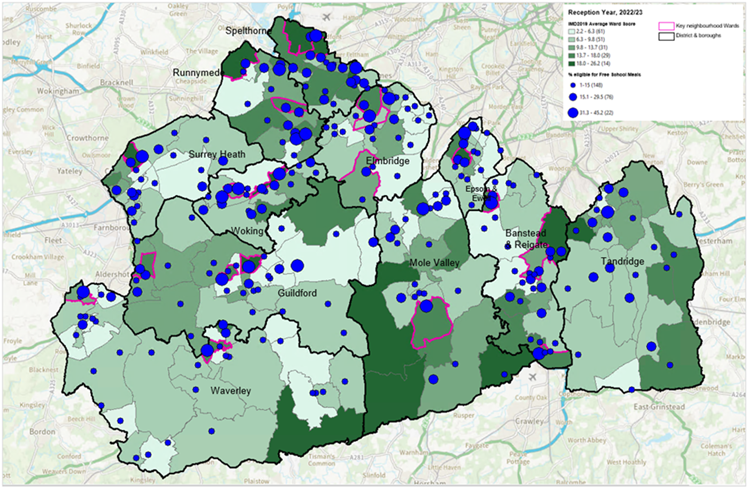
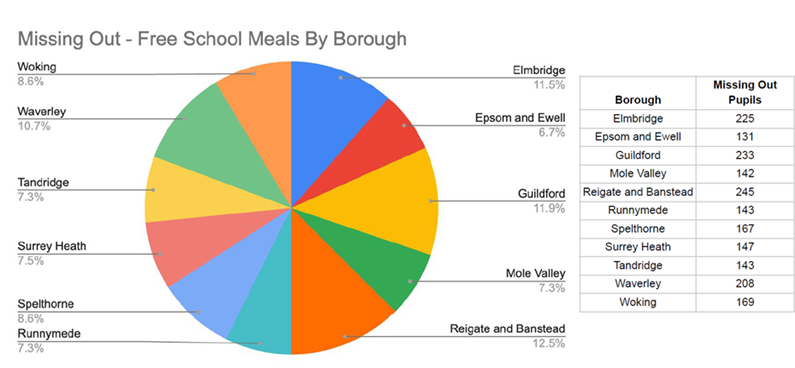
Figure 10 show the percentage of Reception and Year 6 who are eligible for free school meals mapped against areas of deprivation and key neighbourhood areas. Although the scheme is available across the county for all eligible children, there are a large number of children who are missing out on this offer. Reigate and Banstead (245), Guilford (233) and Elmbridge (225) have the largest number of eligible children missing out on this offer. In total 1,953 eligible children missed out on receiving free school meals in Surrey. This equates to £6,772,603 unclaimed benefits in Surrey [13].
Figure 10. Percentage of school age children eligible for FSMs mapped against areas of deprivation in Surrey (2022/2023)
Reception year children eligible for free school meals
Year 6 children eligible for free school meals
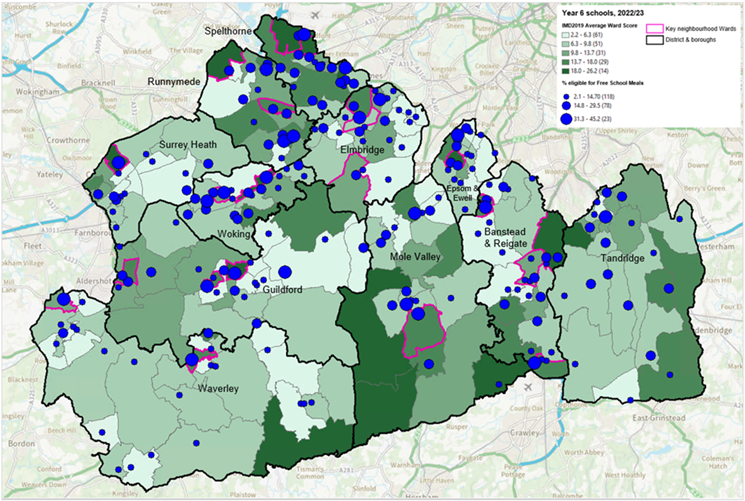
Source NCMP 2022/23, Edubase
Number of pupils eligible for free school meals missing out on the offer by Surrey districts and boroughs (2024)
Source: Policy in Practice | Benefits calculator, Data analytics for local gov
Attainment is measured via the Average Attainment 8 measure which is calculated by adding together a student’s highest scores across eight government approved qualifications (including GCSEs and the English Baccalaureate or EBacc). Pupils are at the end of Key Stage 4 (KS4) aged 15-16 and attending state-funded schools in England. It is often used as a measure of health inequalities which useful when considered together with other indicators such as FSM. Although one caveat is that FSM does not relate to pupils who actually received FSMs, but those who are eligible to receive them.
Combined analysis of attainment and FSM in Surrey (April 2023) show that the majority of areas have a similar average attainment score to England (39.1), except for Surrey Heath (29.7) and Mole Valley (29.3), which are below the England average, while Elmbridge (42.1%) and Epsom and Ewell (40.3%) have scores just above the England average (Figure 11).
Figure 11. Average attainment score among children eligible for FSM (April 2023)

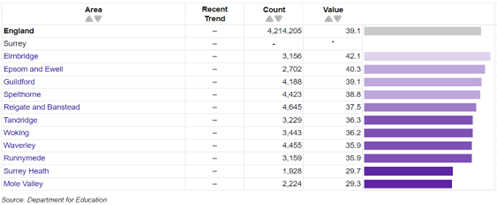
Source: Department for Education (from Fingertips | Department of Health and Social Care)
*missing value
In Surrey, 46.9% of children with FSM status achieve a good level of development at the end of Reception. Although this is still better than England, recent trends (2019-2022) have shown it is decreasing and worsening.
6. Food and its impact on health
6.1 Obesity
The aetiology of obesity is primarily calorific intake exceeding energy expenditure. However, there are many intersectional factors that contribute to this outcome, such as genetic, behavioural, environmental, physiological, social and cultural factors. The extent to which obesity is not just defined by a poor diet and can be influenced by varying complex factors is demonstrated in the obesity system map (simplified in Figure 12). These include universal factors (corporations, policies); local factors (health and education systems, socioeconomic status, access); community factors (built environment, culture, belief); individual factors (stress, cooking literacy, physical activity, mental health, life experiences); and intrinsic factors (genes, hormones, psychology).
Figure 12. Obesity System Map
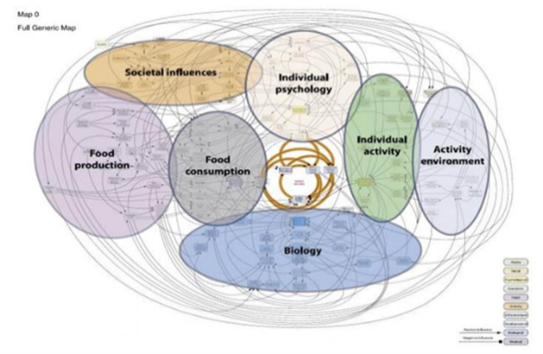
Source: 15.6 Obesity-05.pdf (local.gov.uk)
6.1.1 Measurement of Obesity
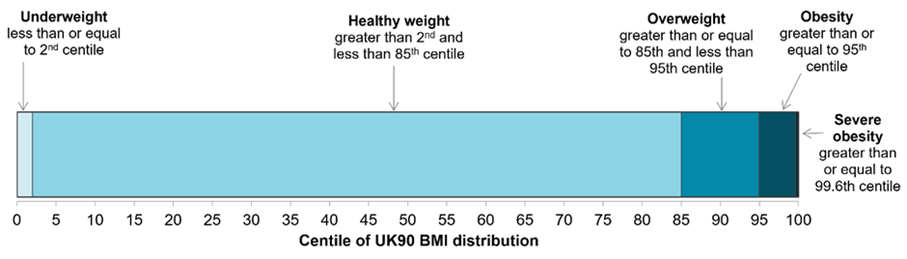
A healthy weight for both adults and children is determined by the body mass index (BMI). BMI is calculated by dividing a person’s weight by the square of their height, with the result expressed in kg/m². For adults, a BMI ranging from 18.5 to 24.9 is considered within the healthy range. According to the NHS, an adult with a BMI of 25 kg/m² or higher is classified as overweight, obese, or severely obese. For children, BMI calculations also consider age and gender, and the results are compared against national BMI datasets to determine if the child is at a healthy weight. A BMI between the 2nd and 91st percentiles is considered healthy for children.
Obesity is a global issue, with rates of adult obesity rising in every country over the past four decades [14].
6.1.2. Pregnancy and obesity
Data for England in 2020 shows that 46% of women at the start of their pregnancy were at a healthy weight, while 28% were classified as overweight and 22% as obese.
6.1.3. Childhood obesity: child body mass index classification
For population monitoring purposes, a child’s body mass index (BMI) is classed as overweight or obese where it is on or above the 85th centile or 95th centile respectively, based on the British 1990 (UK90) growth reference data (Figure 13). The population monitoring cut offs for overweight and obesity are lower than the clinical cut offs [15] (91st and 98th centiles for overweight and obesity) used to assess individual children; this is to capture children in the population in the clinical overweight or obesity BMI categories and those who are at high risk of moving into the clinical overweight or clinical obesity categories. This helps ensure that adequate services are planned and delivered for the whole population.
Figure 13. Child body mass index classification
6.1.4. National Child Measurement Programme
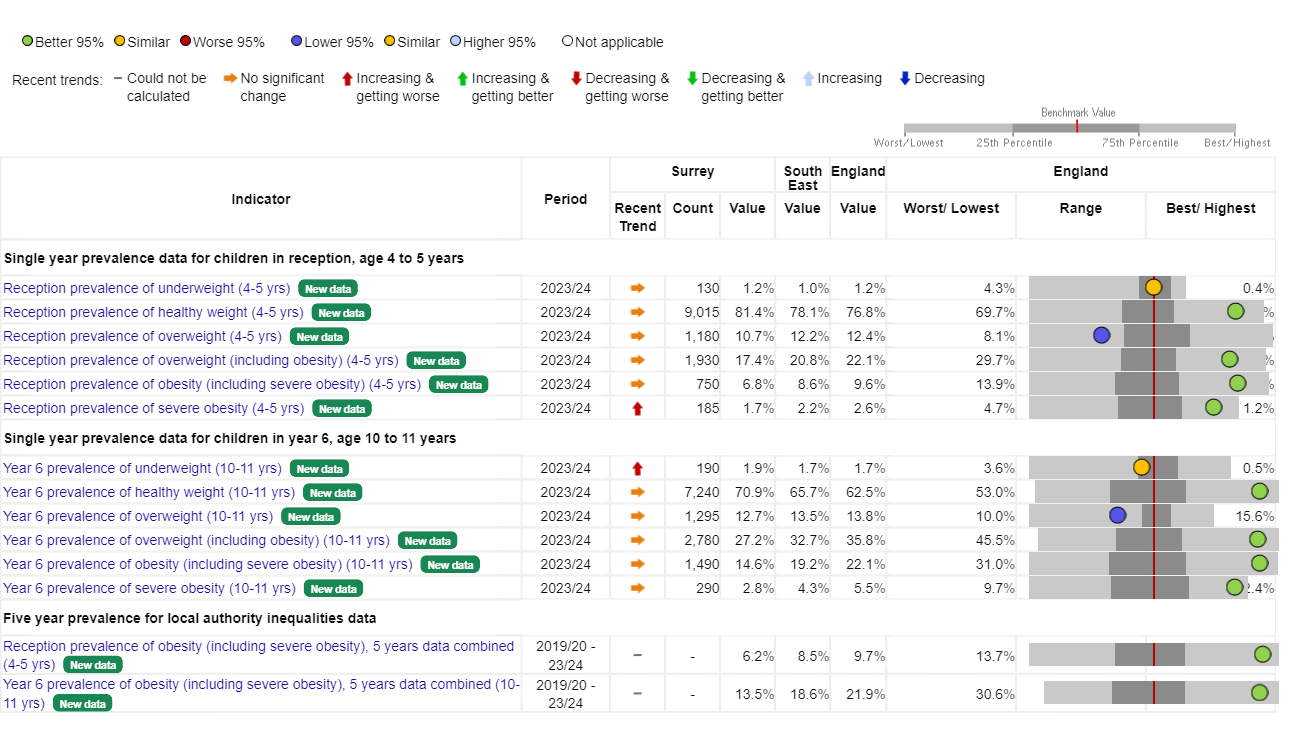
The National Child Measurement Programme (NCMP), established in 2006, collects annual measurements of the height and weight of over one million children in Reception (aged 4 to 5 years) and Year 6 (aged 10 to 11 years) in primary schools across England. Data from the 2022 to 2023 academic year show the patterns and trends in the prevalence of overweight and obesity among Reception and Year 6 children in Surrey.
The number of children measured in Surrey in 2022 to 2023 was 11,685 in Reception, and 9,355 in Year 6. The participation rate in Surrey in 2022 to 2023 was 93.8% in Reception children and 71.8% for children in year 6.
6.1.5. BMI status of children by age in Surrey
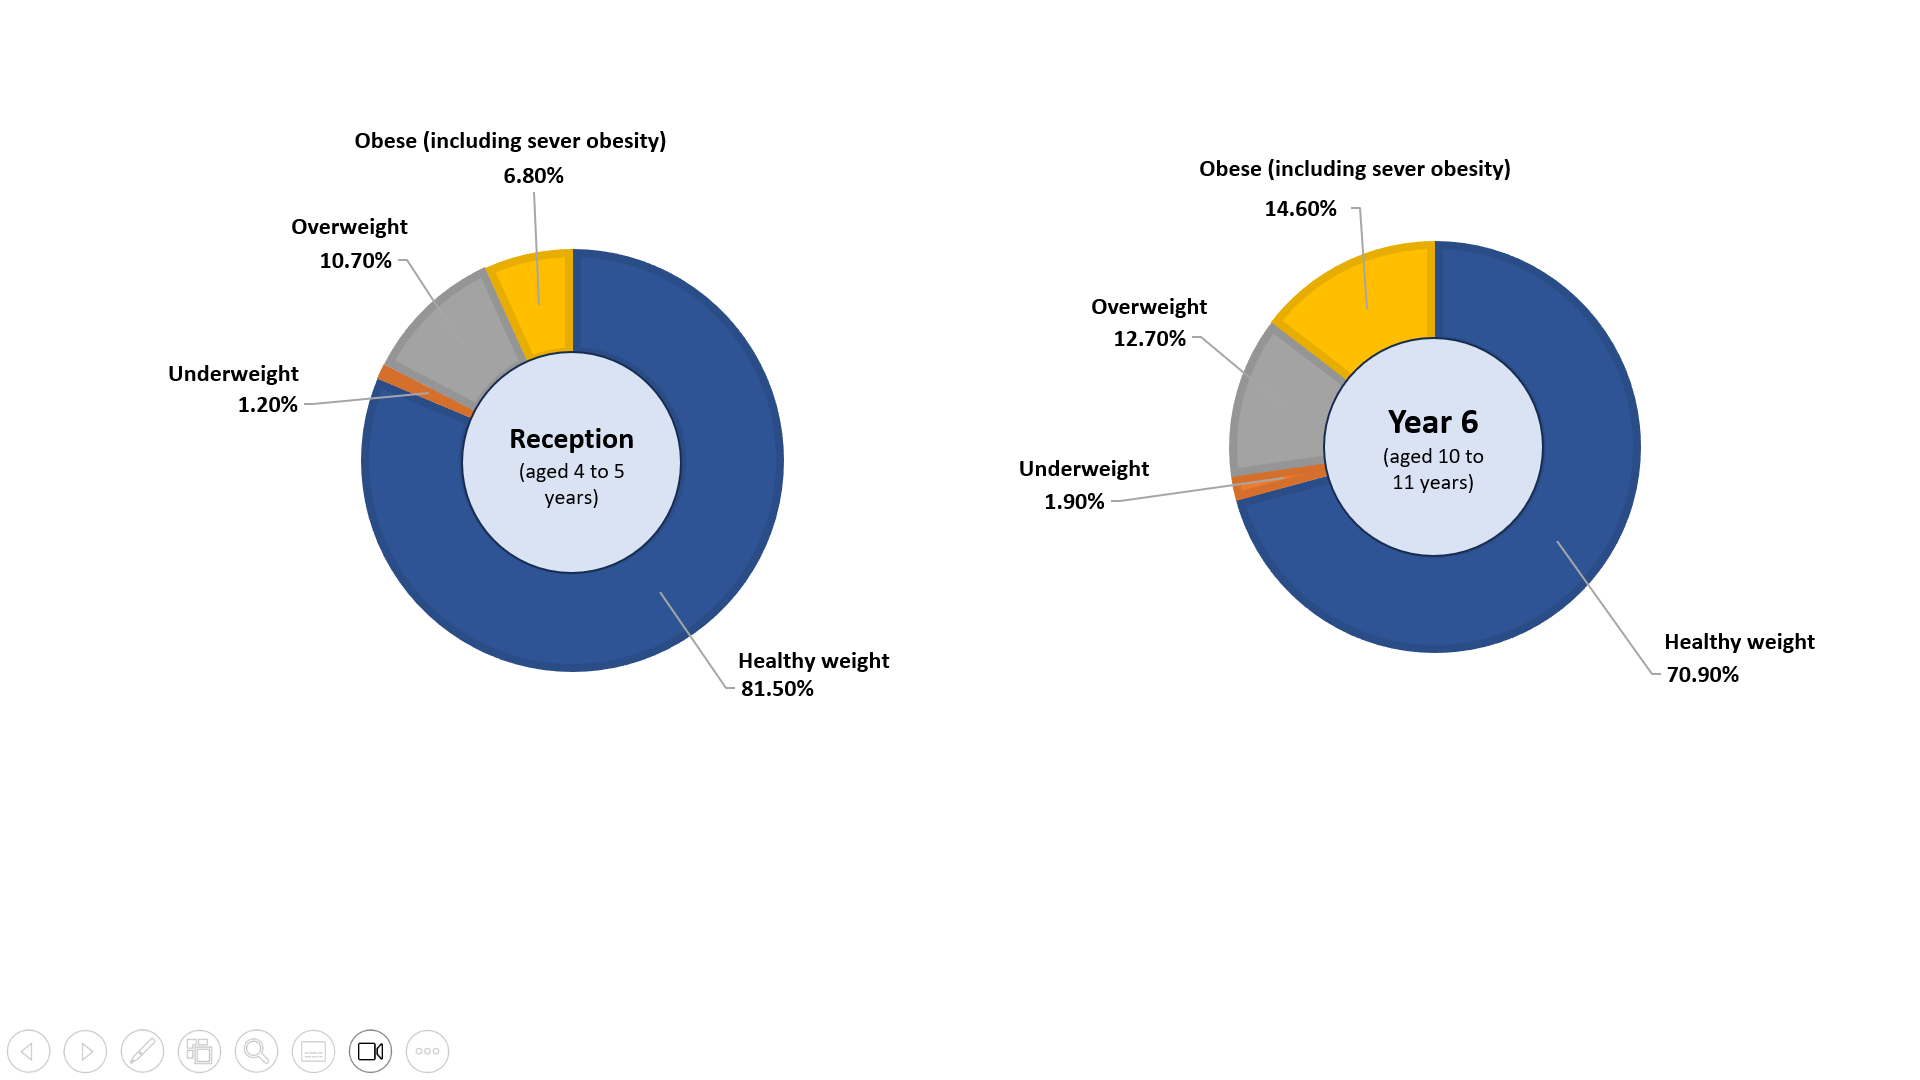
Based on the NCMP (2023 to 2024) 10.7% of Reception age children (aged 4 to 5) are overweight and 6.8% are classified as obese (including severe obesity) in Surrey. These figures are higher in Year 6 children (aged 10 to 11) with 12.7% classified as overweight and 14.6% being classified as obese (including severe obesity) (Figure 14). Prevalence of both Reception and Year 6 children who are overweight or obese (including severe obesity) are lower than South East and England (Figure 15).
Figure 14. BMI status of children by age in Surrey
National Child Measurement Programme 2023 to 2024
Source: Obesity Profile – Data | Fingertips | Department of Health and Social Care
Figure 15. Surrey BMI status in Surrey by age based on National Child Measurement Programme 2023 to 2024 compared regionally and nationally
Source: Obesity Profile – Data | Fingertips | Department of Health and Social Care
6.2 Obesity prevalence
6.2.1. Childhood obesity
National and regional picture
The latest data from the NCMP for school year 2023/24 were released on 5 November 2024. As per the latest data:
- Reception age (aged 4 to 5 years): Regionally and nationally, there has been an increase in the prevalence of obesity among Reception children in 2023/24 compared to 2022/23 (Figures 16A and 16C).
- Year 6 children (aged 10 to 11 yeas): Obesity prevalence has decreased in England in Year 6 children and has remained similar to last year in the South East (Figures 16B and 16D).
Figures 16 A to D. 2023/24 school year South East NCMP prevalence of BMI category trends (by postcode of child’s residency)
A. Reception BMI categories – South East B. Year 6 BMI categories – South East
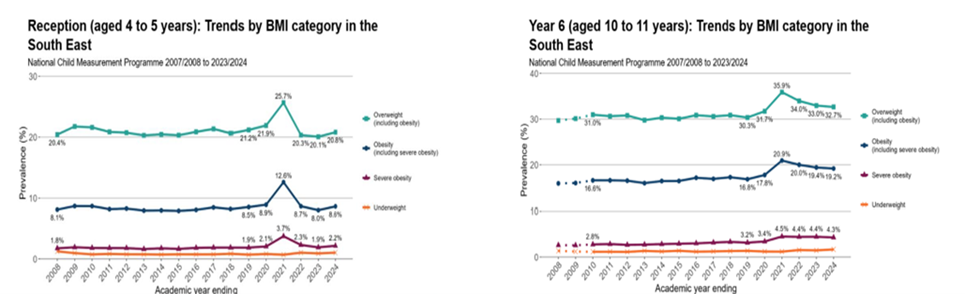
C. Reception BMI Categories – England D. Year 6 BMI categories – England
The top line refers to Overweight; 2nd line refers to Obesity; 3rd line refers to Severe Obesity and bottom line refers to Underweight
Source: Patterns and trends in child obesity in the South East, OHID
The South East prevalence for obesity, and overweight and obesity combined remains below the England prevalence statistics, in Reception and Year 6 (Figures 16 A to D) and has the second lowest prevalence of obesity in Reception and Year 6 children compared to other English regions.
- Reception age (aged 4 to 5 years): 8.6% of Reception children were in the obesity category compared to 9.6% in England. This is an increase from 2022/23 (8.0% in the South East). 20.8% of Reception children were in the overweight and obesity category combined compared to 22.1% in England. This is an increase from 2022/23 (20.1% in the South East).
- Year 6 children (aged 10 to 11 years): 9.2% of Year 6 children were in the obesity category compared to 22.1 % in England. This is similar to 2022/23 (19.4% in the South East) but an increase from 2018/19 (16.8%). 32.7% of Year 6 children were in the overweight and obesity combined category compared to 35.8% in England. This is similar to 2022/23 (33.0%) but an increase from 2018/19 (30.3%).
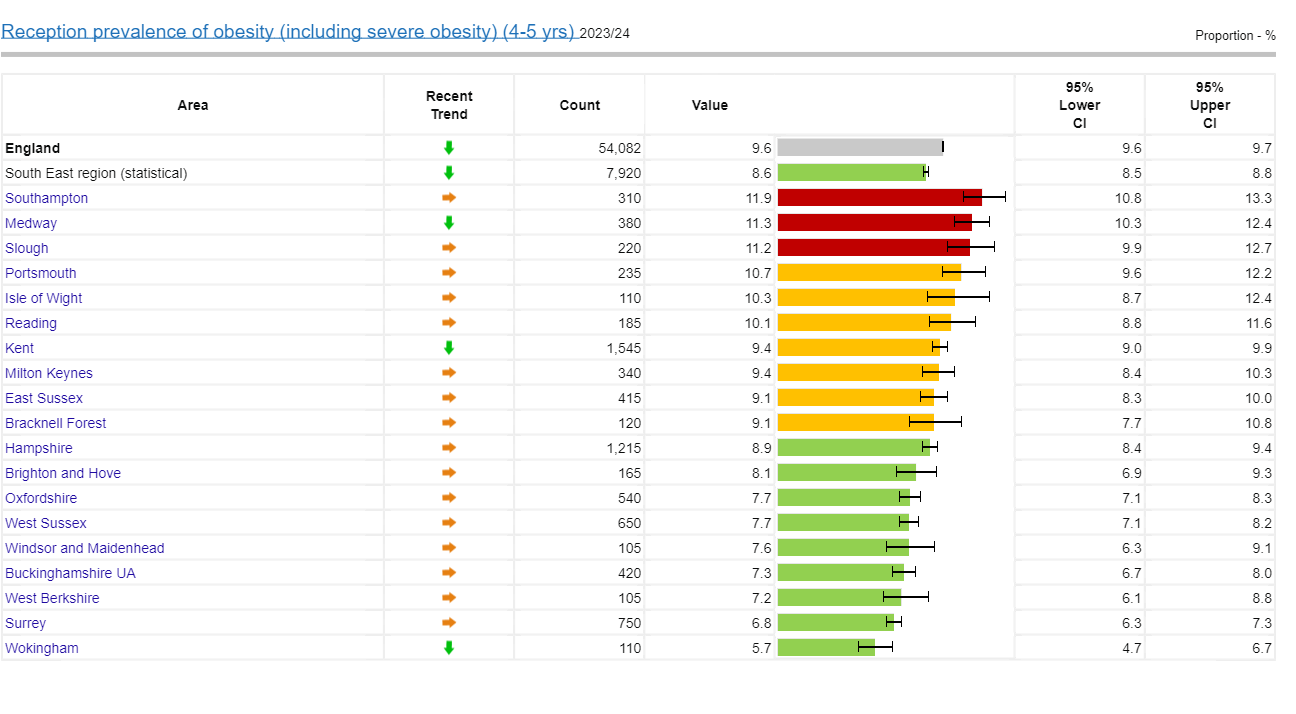
Childhood obesity (including severe obesity) compared to its statistical nearest neighbours
Compared to its statistical nearest neighbours (Figure 17), Surrey has a lower childhood obesity prevalence in both Reception (6.8%) and Year 6 children (14.6%). This is slightly higher than 22/23 data (6.4% in Reception and 12.9% in Year 6).
Figure 17. Prevalence of obesity (including severe obesity) in Reception and Year 6 in South East county and unitary authorities (NCMP 2023/24)
A. Children in Reception (aged 4 to 5 years) England: 9.6%
Source: Obesity Profile – Data | Fingertips | Department of Health and Social Care
B. Children in Year 6 (aged 10 to 11 years) England: 22.1%
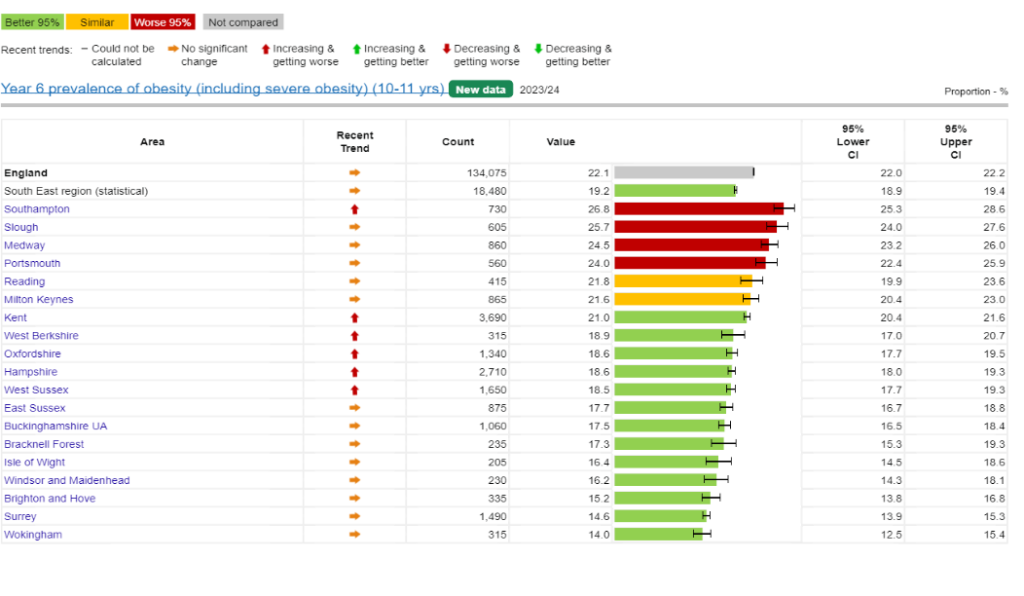
95% confidence intervals are shown
Source: Source: NHS England, National Child Measurement Programme 2023/24. Obesity Profile – Data | Fingertips | Department of Health and Social Care
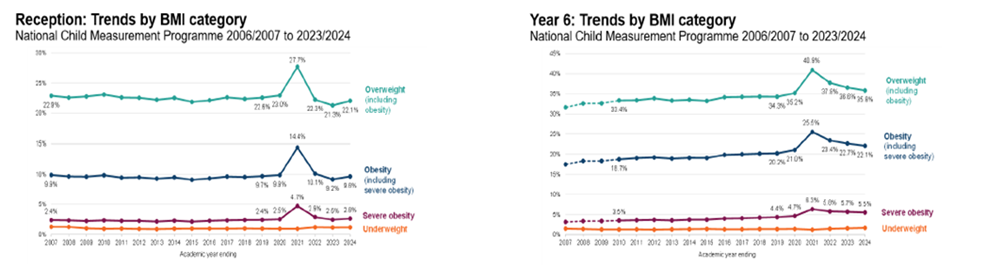
Trend in the prevalence of childhood overweight (including obesity) by age in Surrey
Based on the NCMP data, between 2006 to 2007 and 2022 to 2023, obesity prevalence in children in Reception children (aged 4 to 5 years) in Surrey has followed a similar trend to the national picture (Figure 18). Although prevalence of overweight showed a declining pattern from 2014/15 to 2019/20 in Surrey, more recent figures show an increase particularly from 2021/22 to 2022/23, closing the gap with England’s average (Figure 18).
The prevalence of overweight and obesity in children in Year 6 (aged 10 to 11 years) trend roughly follow the national picture with an increase in 2019/2022 (Figure 18)
Figure 18. Trend in the prevalence of obesity and overweight (including obesity) by age in Surrey based on National Child Measurement Programme between 2006 to 2007 and 2022 to 2023
Children in Reception (aged 4 to 5 years) Children in Year 6 (aged 10 to 11 years)
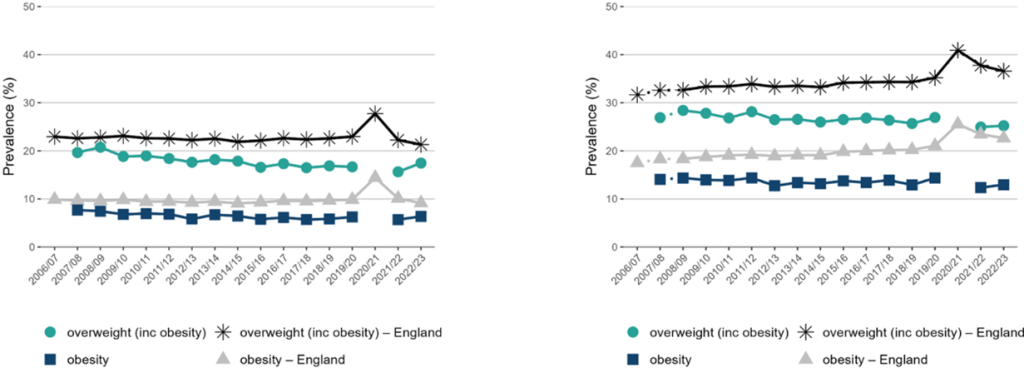
Note: for Year 6, comparisons are not possible with the first years of the NCMP (2006 to 2007 and 2008 to 2009) as low participation levels led to underestimation of obesity prevalence. Missing data point denotes missing data for 2006 to 2007 and 2020 to 2021.
Source: Office for Health Improvement and Disparities. Public Health Profiles. 2023 http://fingertips.phe.org.uk/profile/national-child-measurement-programme
Childhood obesity in Surrey District Authorities
Prevalence of overweight (including obesity)
Across all eleven district and boroughs prevalence of childhood obesity (for both Reception and Year 6) is lower than England (9.2%). The most recent data (2023/24) show that 17.4% of 4 to 5 year olds in Surrey are either overweight or obese. This figure rises to 27.2% (equating to 1,930 children) by the time children reach Year 6 (aged 10 to11 years), equating to 2,780 children aged 10 to 11 years in Surrey who are overweight or obese.
The prevalence of obesity varies locally within Surrey. Runnymede (21.8 %), Mole Valley (20.0%), Tandridge (19.5%), Surrey Heath (19.5%) and Woking (18.9%) have a higher prevalence of overweight (including obesity) in Reception age children than Surrey’s average (Figure 19). Taking into account the confidence intervals (CIs), only Runnymede is significantly higher than Surrey. Mole Valley down to Guildford are all similar to Surrey, with those below all lower than the Surrey average. Spelthorne (35.1%), Runnymede (31.7%) and Woking (30.7%) all have significantly higher prevalence of overweight (including obesity) amongst children in Year 6 than Surrey’s average. Surrey Heath, Guildford, Reigate and Banstead, and Tandridge are all similar to Surrey’s average of 27.2% (Figure 20).
Figure 19. Prevalence of overweight (including obesity) amongst children in Reception (aged 4 to 5 years) in Surrey District Authorities (2023/24)
England: 22.1%
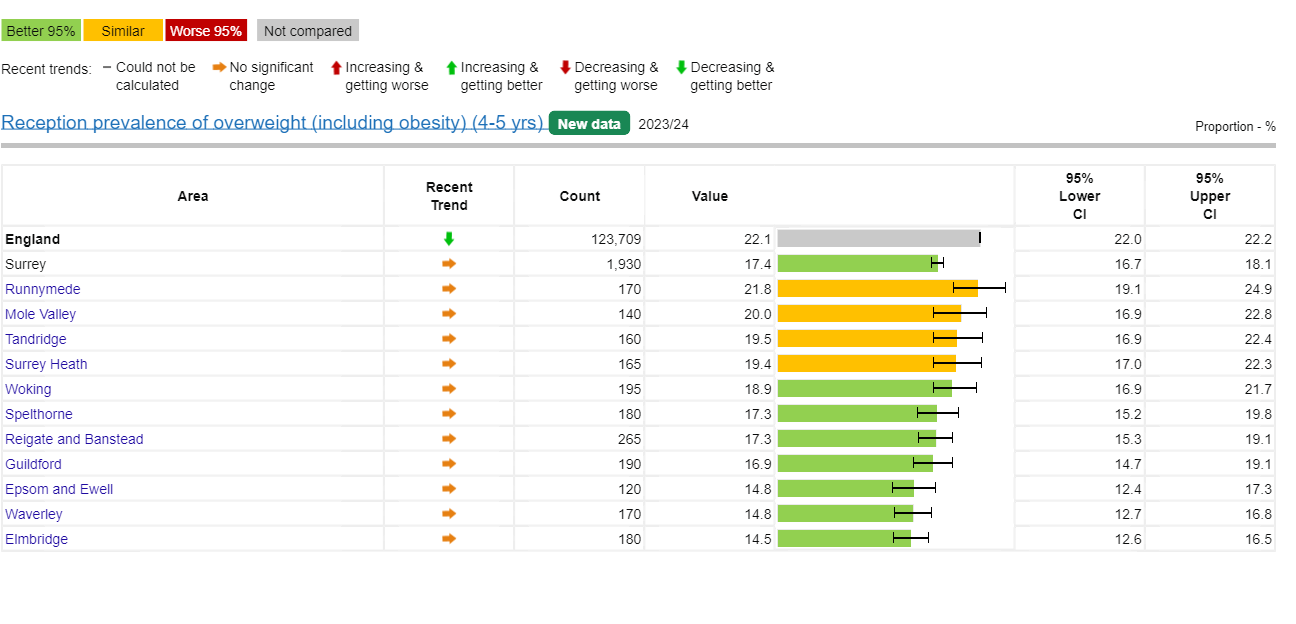
95% confidence intervals are displayed on the chart
Source: Fingertips | Department of Health and Social Care (phe.org.uk) 2023/24
Figure 20. Prevalence of overweight including obesity amongst children in Year 6 (aged 10 to 11 years) in Surrey District Authorities (2023/24)
England: 35.8%
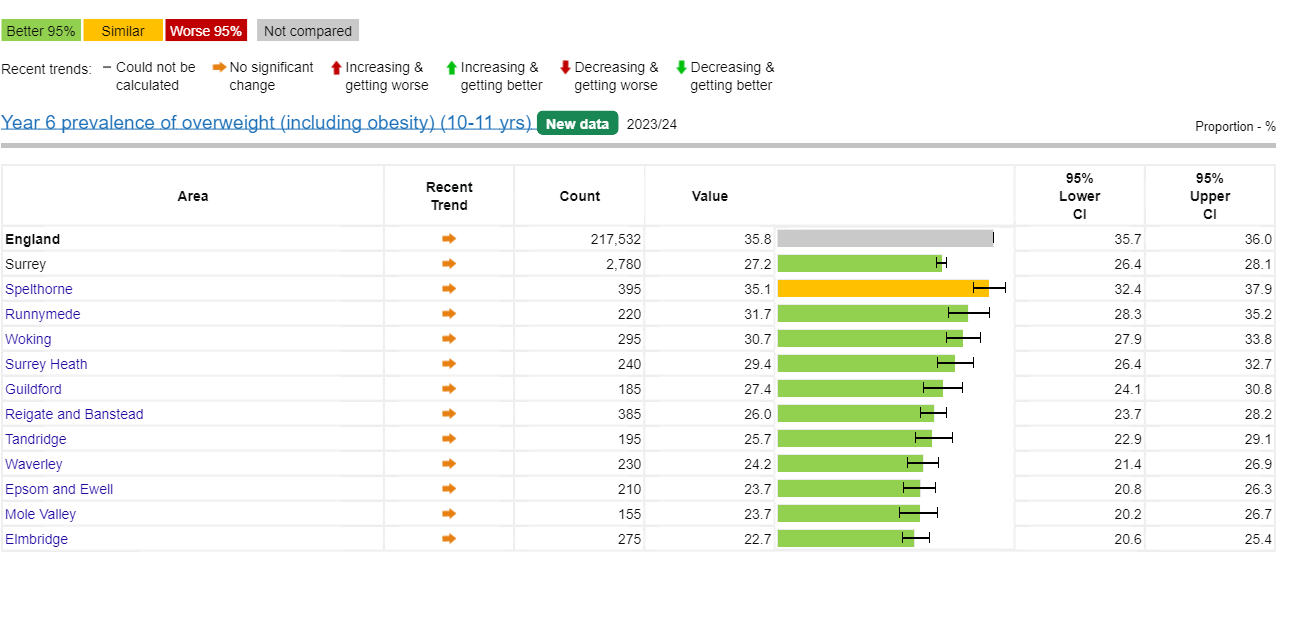
95% confidence intervals are displayed on the chart
Source: Fingertips | Department of Health and Social Care (phe.org.uk) 2023/24
Prevalence of severe obesity
Data on severe obesity for children (2023/24) show 1.7% of children in Surrey aged 4 to 5 years are severely obese (Figure 21). Amongst children aged 10 to 11 years this figure rises to 2.8% (Figure 22). This equates to 185 children aged 4-5 years and 290 children aged 10-11 years in Surrey.
Figure 21. Reception prevalence of severe obesity (4-5 yrs) 2023-24
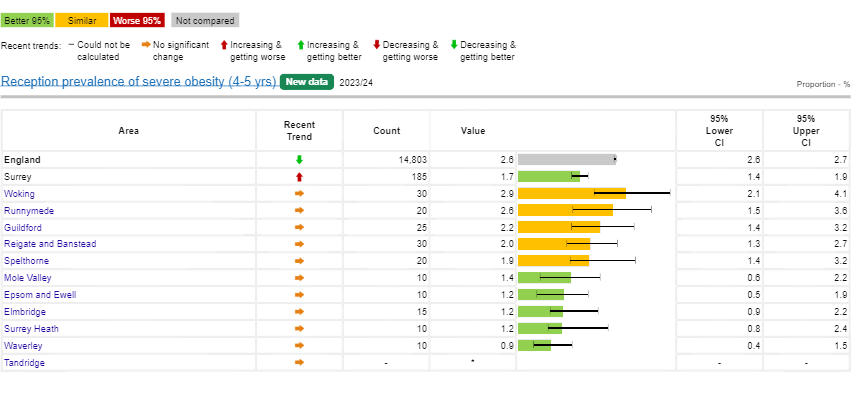
*Value suppressed for disclosure control reasons
Source: Obesity Profile – Data | Fingertips | Department of Health and Social Care
Figure 22. Year 6 prevalence of severe obesity (10-11 yrs) 2023-24
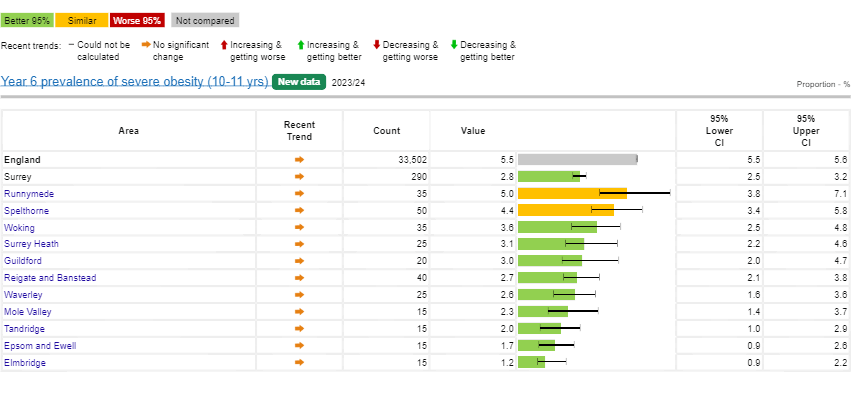
Source: Obesity Profile – Data | Fingertips | Department of Health and Social Care
6.2.2. Obesity in adults
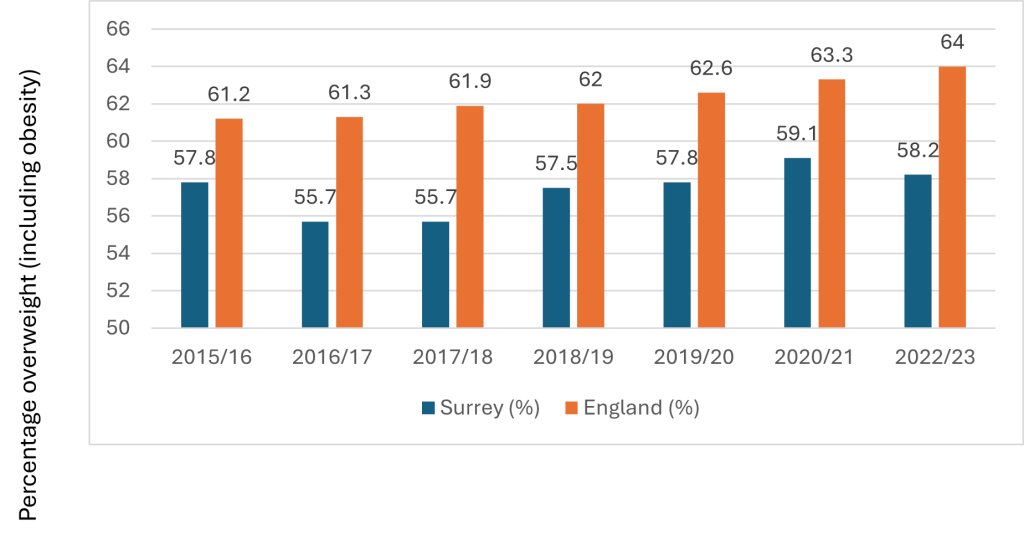
The Public Health Outcomes Framework indicator (C16 – Overweight (including obesity) prevalence in adults (18+ years) 2022/23) for obesity, measures prevalence of excess weight (overweight and obesity) taken from the Active People Survey. This is a self-reported measure that is standardised against evidence that people often under-report their weight. Trend data indicates a gradual increase in the prevalence of obese adults in Surrey from 2016/17 (55.7%) to 59.1% in 2020/21, in a similar trend to the national picture. Obesity prevalence has shown a slight decline from 59.1% in 2020/21 to 58.2% 2022/23 (Figure 23).
Figure 23. Prevalence of overweight (including obesity) in adults in Surrey over time
Source: Office for Health Improvement and Disparities. Public Health Profiles
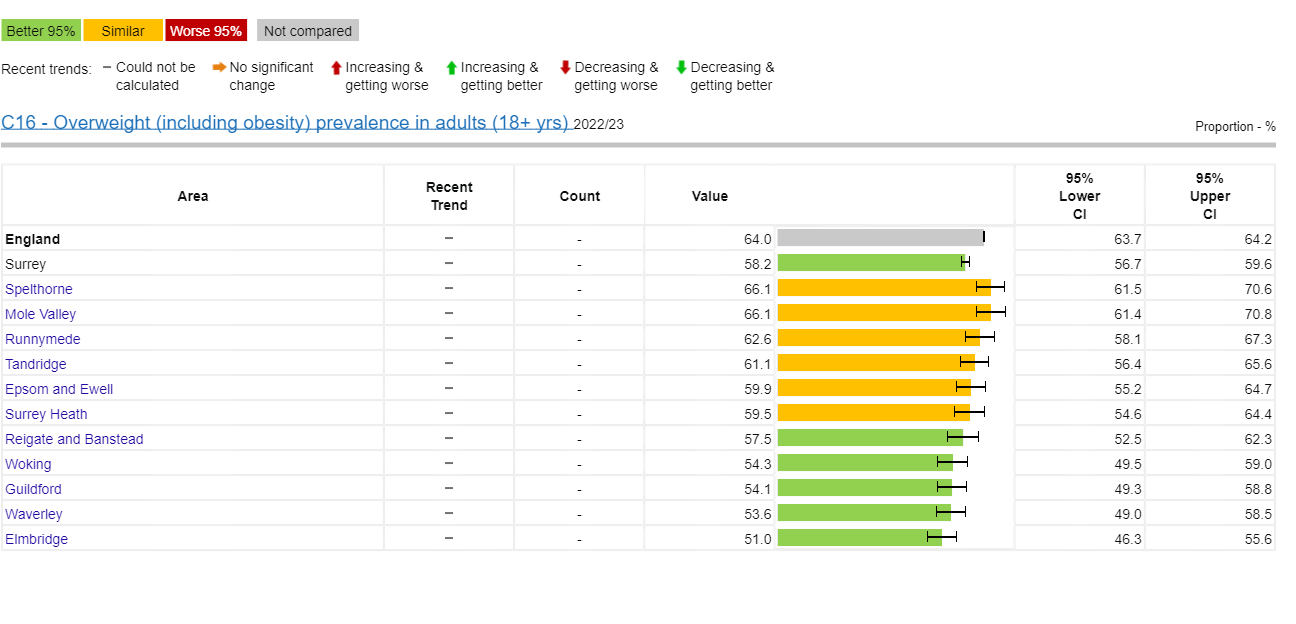
In 2022/23, an estimated 58.2% of adult residents in Surrey were classified as overweight or obese (collectively referred to as having excess weight). This was lower than the England average of 64% (Figure 23). Spelthorne, Mole Valley, Runnymede, Tandridge, Epsom and Ewell and Surrey Heath all have a higher prevalence than the Surrey average (Figure 24).
Figure 24. Prevalence of overweight (including obesity) in adults by District and Boroughs in Surrey (2022/23)
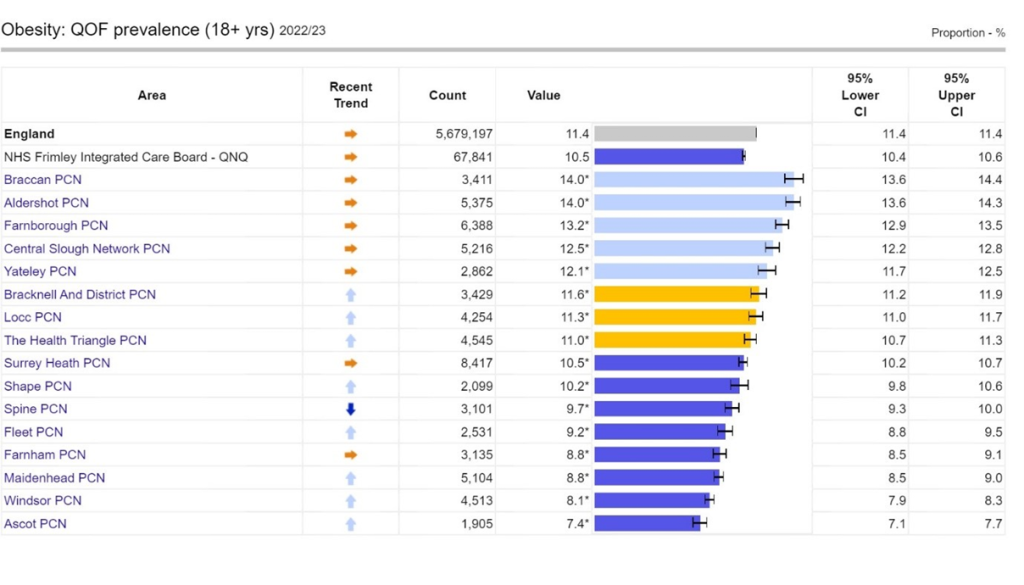
The Quality and Outcomes Framework (QOF) data 2022/23 (Figure 25) show there are 77,517 people in NHS Surrey Heartlands ICB and 67,841 people in NHS Frimley ICB registered as obese. QOF reports obesity prevalence as the proportion of adults aged 18 years or over with a BMI greater than or equal to 30 in the previous 12 months, as recorded on practice disease registers.
Figure 25a. Prevalence of obesity in Surrey Heartlands ICS adult population (aged 18 years or over) by PCNs 2022/23
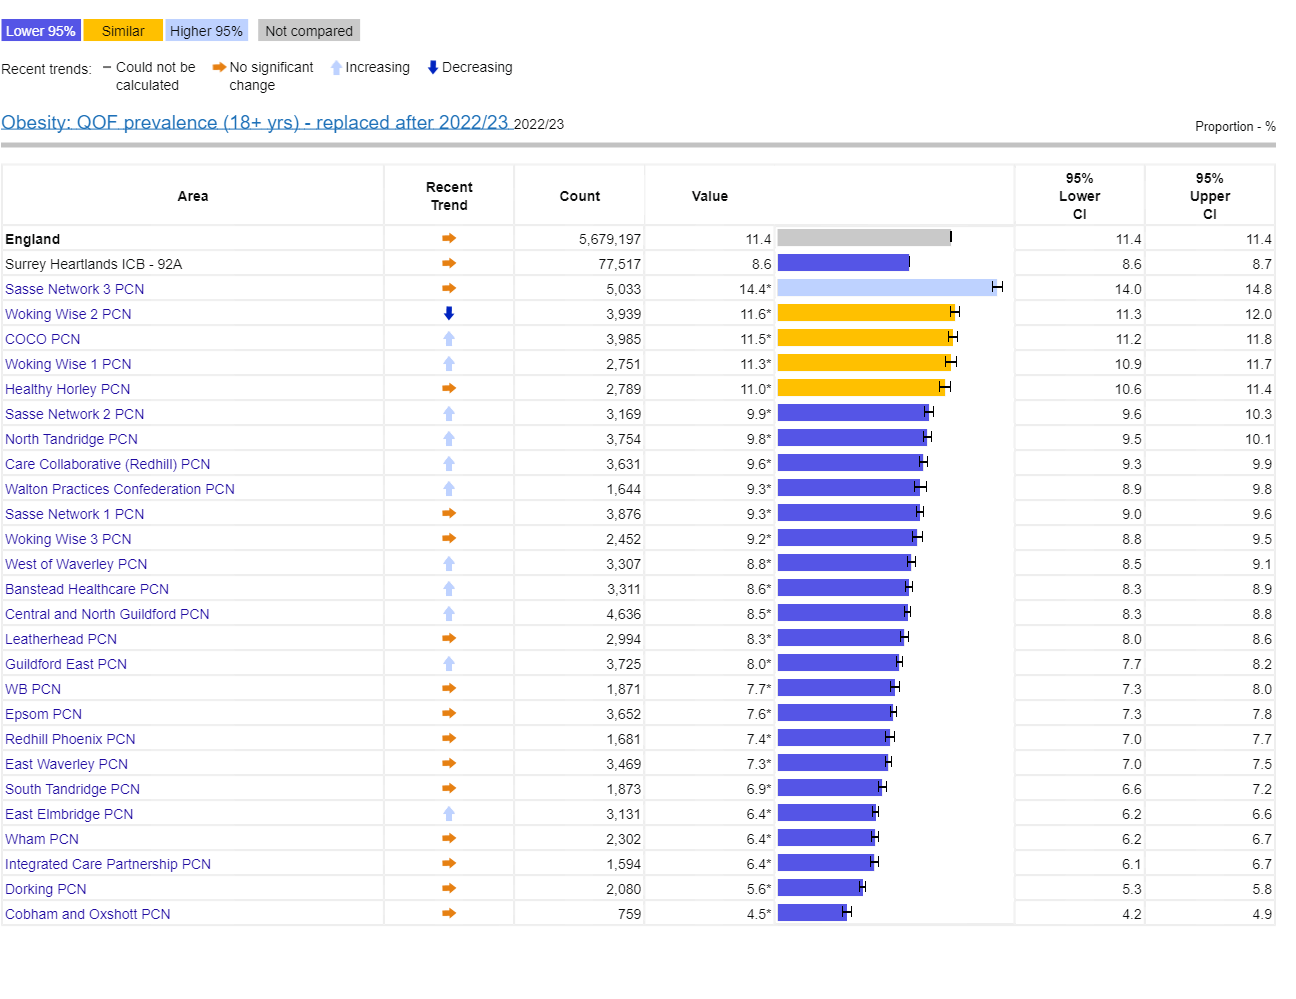
Source: Fingertips | Department of Health and Social Care (phe.org.uk)
Figure 25b. Prevalence of obesity in Frimley Health and Care ICS adult population (aged 18 years or over) by PCNs 2022/23
Source: Fingertips | Department of Health and Social Care (phe.org.uk)
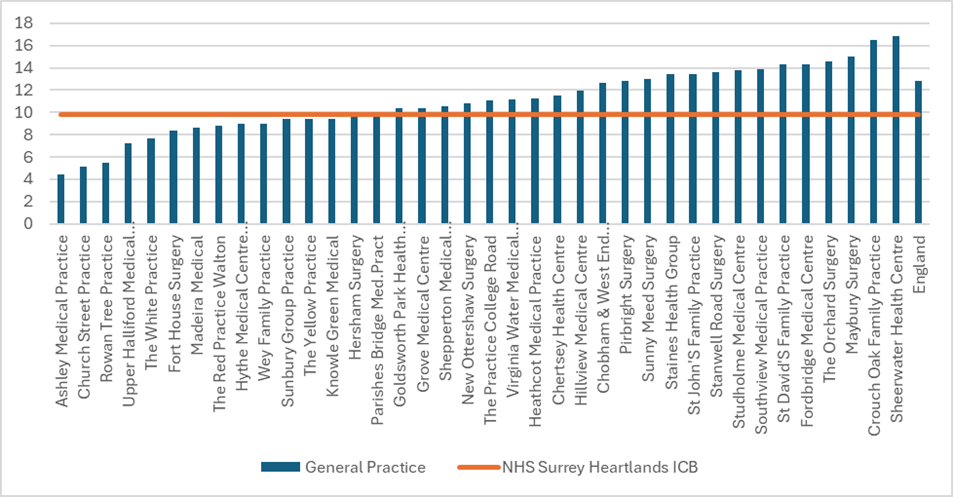
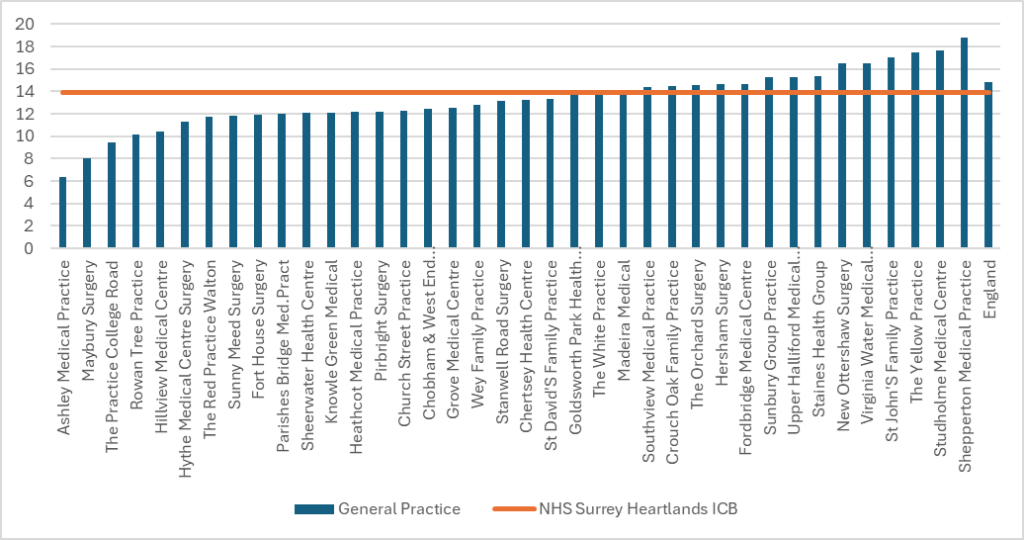
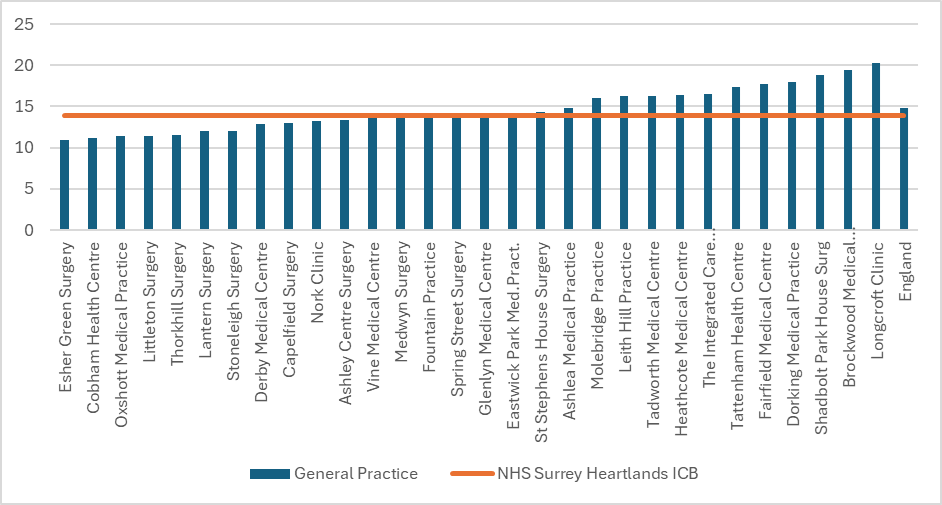
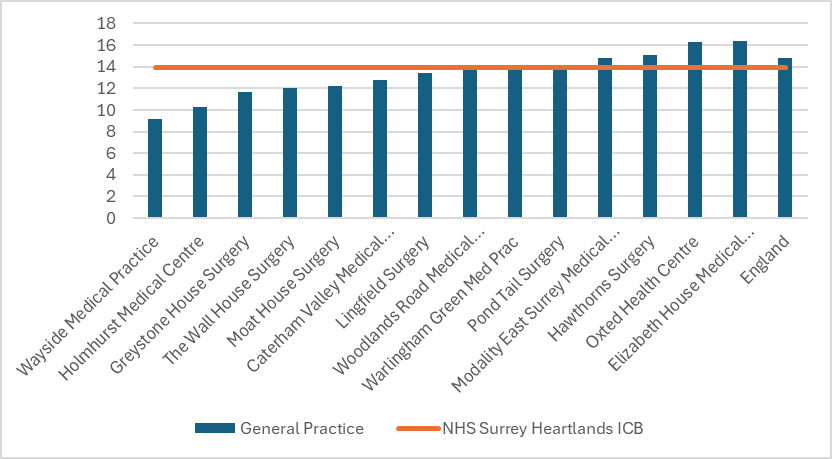
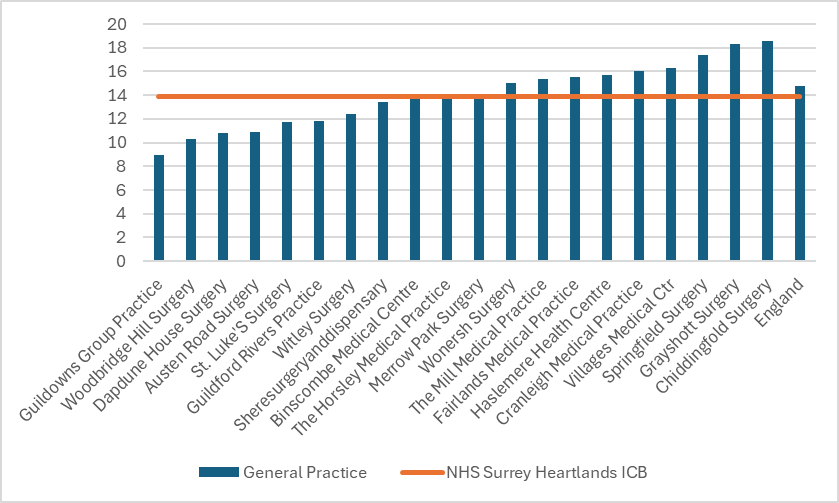
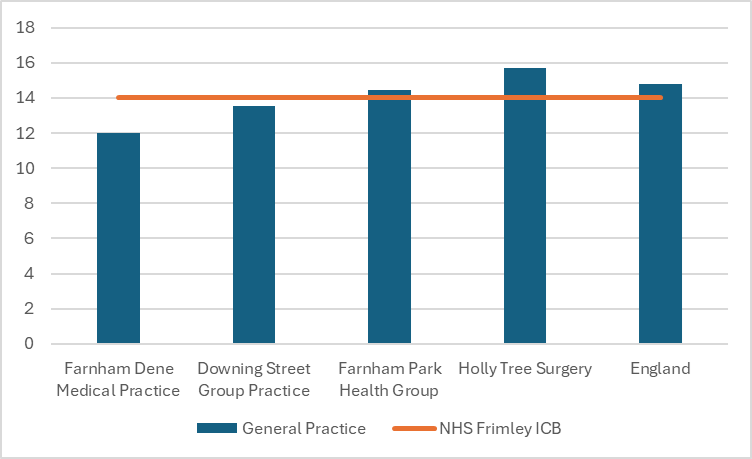
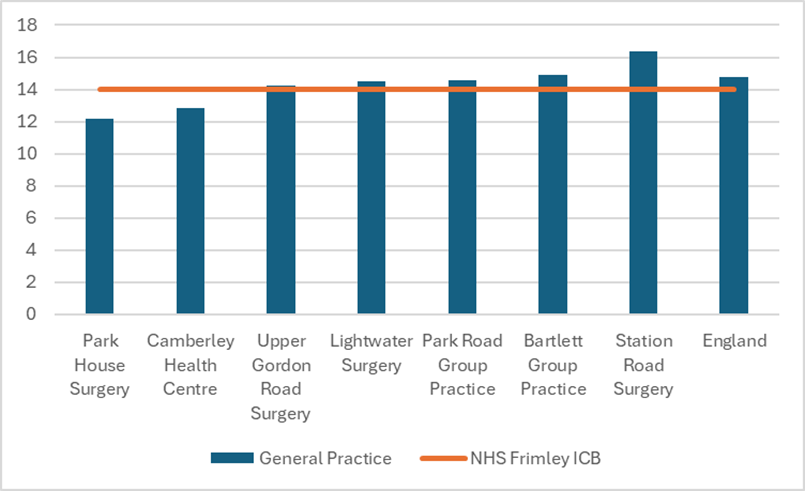
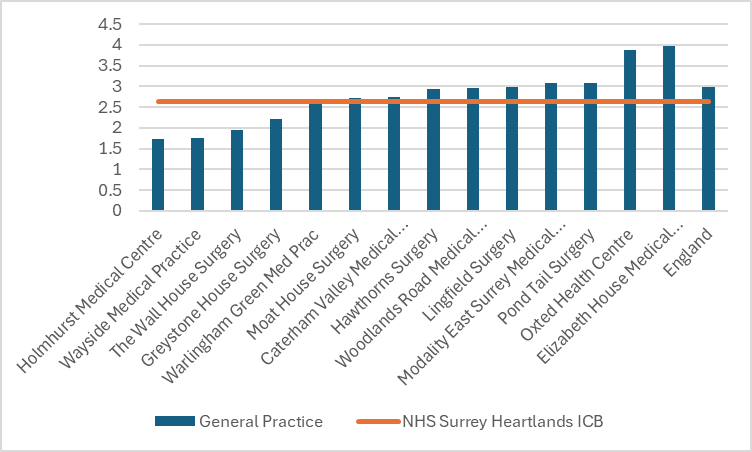
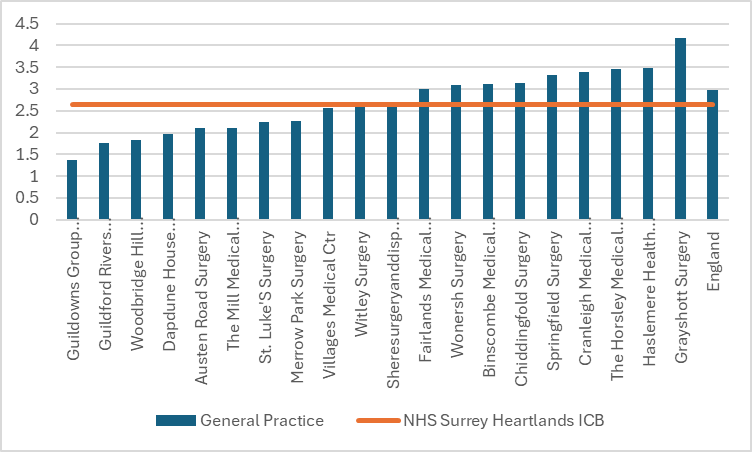
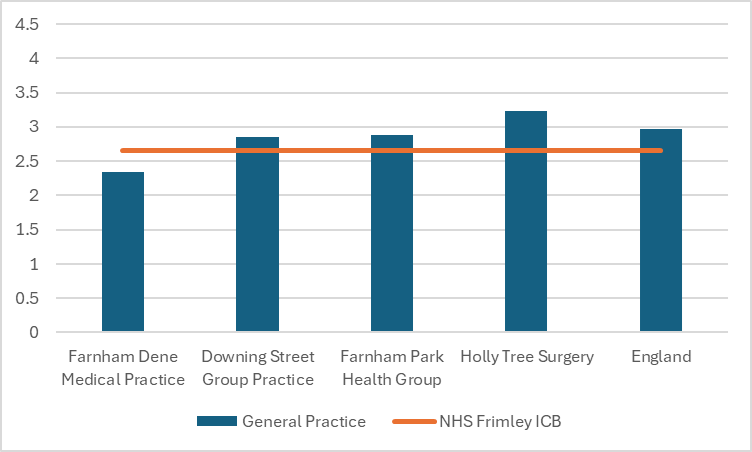
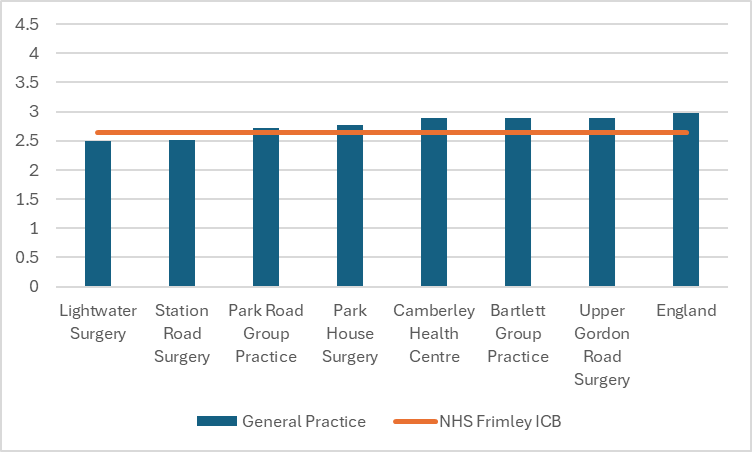
The above data shows PCN level QOF obesity prevalence from 2022/23 however QOF data is available at practice level for 2023/24. The obesity prevalence data broken down by GP practices show a large degree of variation with some exceeding both Surrey and the national average (Figure 27). We are unable to accurately compare QOF obesity data with previous years as the definition was updated this year to account for patients with a South Asian, Chinese, other Asian, Middle Eastern, Black African or African-Caribbean family background. This new definition will associate obesity with these patients at a BMI of 27.5 kg/m2 or greater.
Figure 27. Obesity prevalence (%) by GP practices in Surrey (QOF data 2023/24)
Surrey Heartlands ICB: North West Surrey
Surrey Heartlands ICB: Surrey Downs
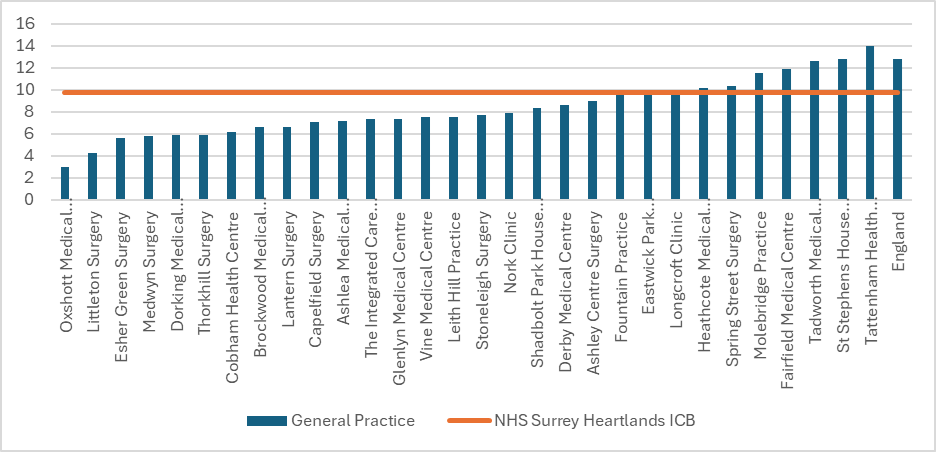
Surrey Heartlands ICB: East Surrey
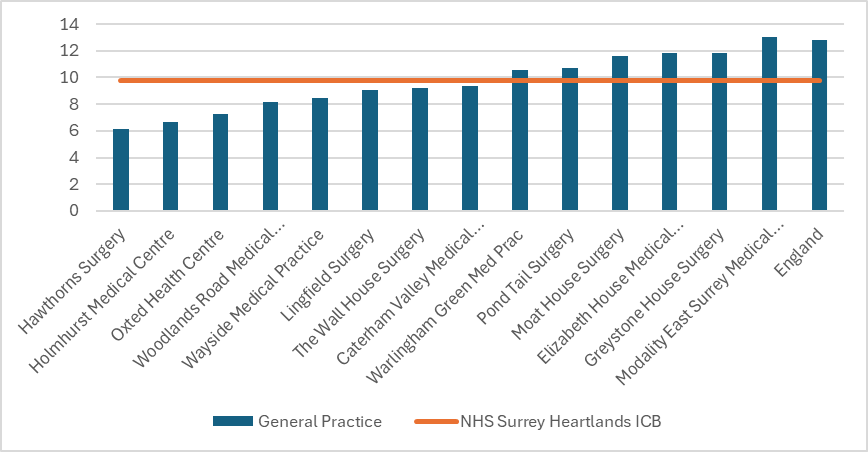
Surrey Heartlands ICB: Guildford and Waverley
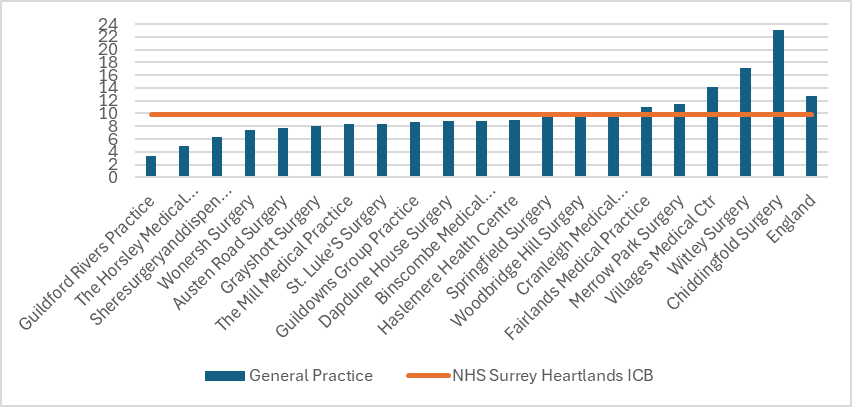
Frimley ICB: North East Hants and Farnham
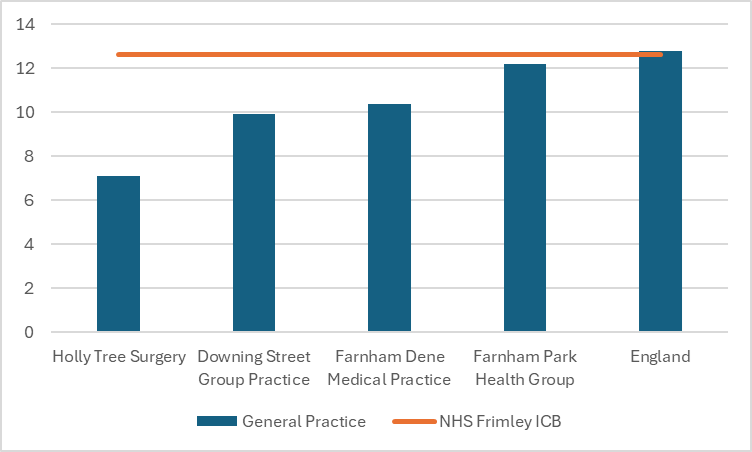
Frimley ICB: Surrey Heath
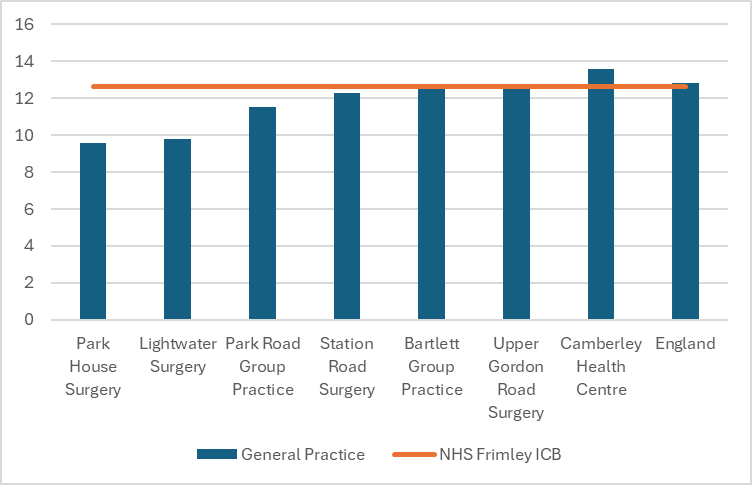
Source: Quality and Outcomes Framework, 2023-24 – NHS England Digital
6.3. Obesity and inequalities
Health inequalities are the systematic, unfair, and avoidable differences in health between different groups or people.
Obesity is one of the leading contributors to the risk of premature death (a marker of health inequalities) in England. Obesity does not affect all groups equally. Obesity is more common amongst populations living in poverty (driven by various socio-economic factors that limit access to physical activity, food security, and a balanced diet), older age groups, some black and minority ethnic groups and people with disability.
There is no single intervention that can effectively address obesity, either at the population or individual level. The causes of obesity are complex and multi-faceted, encompassing biological, physiological, psychological, social, behavioural, and environmental factors. As a result, tackling obesity requires a comprehensive approach that considers these diverse influences and integrates multiple strategies to promote healthier lifestyles and environments.
6.3.1. Childhood obesity and inequalities
Deprivation
There is a higher prevalence of childhood obesity in Reception age children living in the most deprived areas (10.9%) compared to the least deprived areas in Surrey (Figure 28). A similar trend is also seen in the prevalence of obesity in children in Year 6 living in the most deprived areas (24.6%) compared with the least deprived areas (10.4%) in Surrey (Figure 28).
Figure 28. Obesity prevalence by deprivation and age in Surrey based on National Child Measurement Programme (5-year combined data 2017-2023)
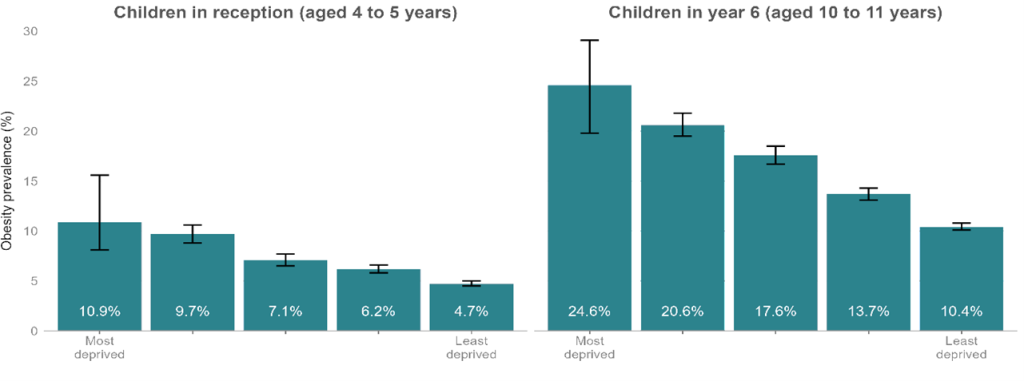
Data combined 5-years, (2017 to 2018, 2018 to 2019, 2019 to 2020, 2021 to 2022, and 2022 to 2023).
95% confidence intervals are displayed on the chart
Source: Office for Health Improvement and Disparities. Public Health Profiles. 2023
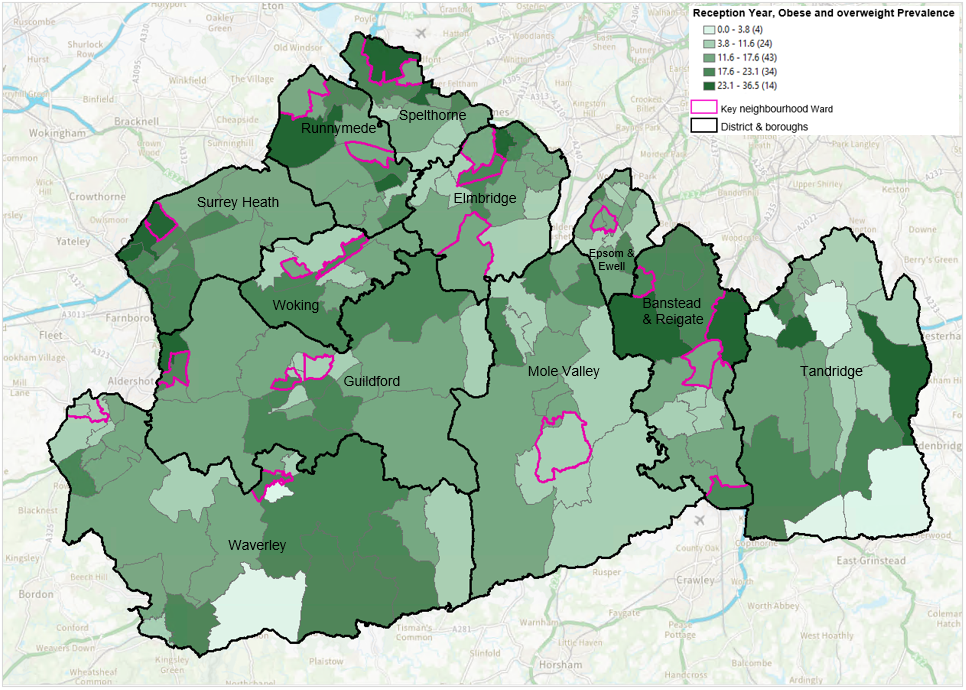
As the data show, some of the most deprived areas also include the key neighbourhood areas in Surrey across both age groups (Figure 29). There is a pattern of high prevalence of childhood obesity in key neighbourhoods, which are wards in Surrey with high levels of deprivation, based on IMD 2019 score (Figure 29).
Figure 29. Obesity prevalence by Surrey key neighbourhoods (Ward level) based on the NCMP (2022/23)
Children in Reception (aged 4 to 5 years)
Children in Year 6 (aged 10 to 11 years)
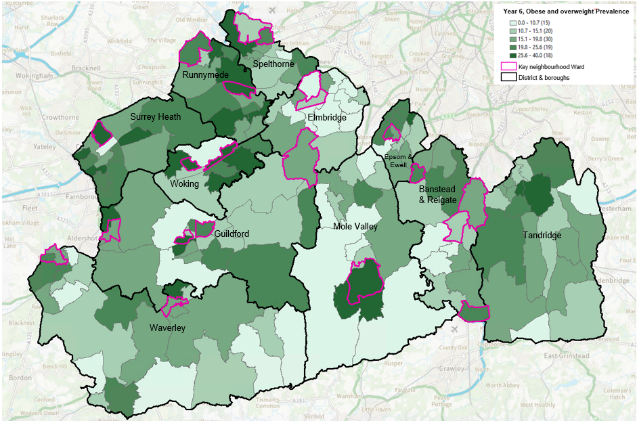
Source: National Child Measurement Programme (2022/23)
Ethnicity
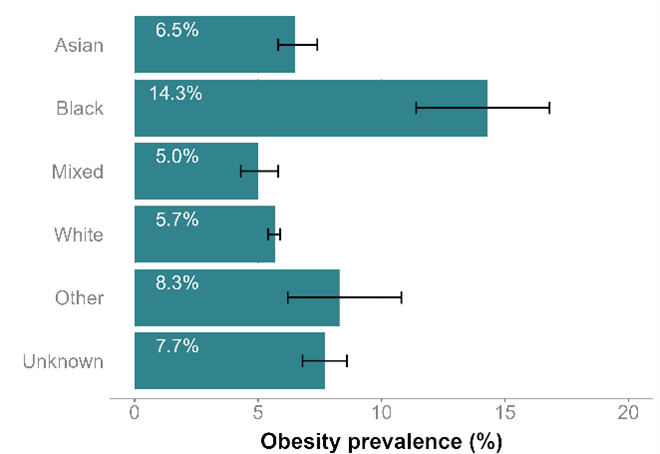
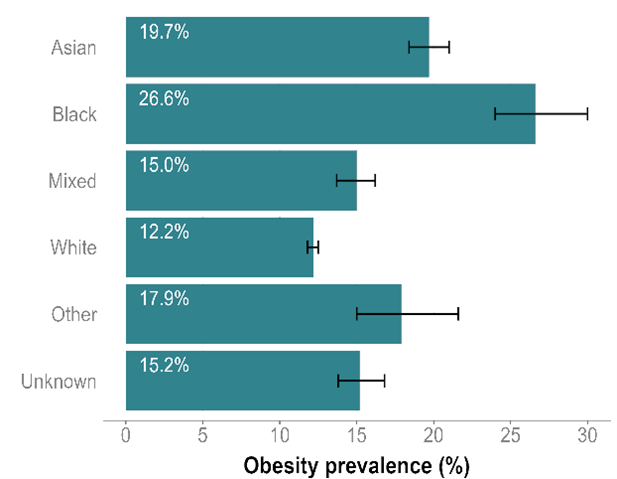
The latest NCMP data for Surrey show that children in Reception (aged 4 to 5 years) and children in Year 6 (aged 10 to 11 years) from Black ethnic backgrounds have the highest prevalence of obesity (14.3% in Reception; 26.6% in Year 6). Children in Reception (aged 4 to 5 years) with ‘Other’ ethnicity have the second highest obesity prevalence (8.3%), followed by those of Unknown (7.7%) and Asian (6.5%) ethnicities. For children in Year 6, the groups of children experiencing the second, third and fourth highest levels of obesity prevalence are those of Asian (19.7%), ‘Other’ (17.9%) and Unknown (15.2%) ethnicities. (Figure 30).
The prevalence of obesity is lowest in children with a White ethnicity in both age groups (5.7% in Reception children and 12.2% in children in Year 6 (Figure 30).
Figure 30. Obesity prevalence by ethnic group in Surrey based on National Child Measurement Programme (5-year combined data 2017 – 2023)
Children in Reception (aged 4 to 5 years)
Children in Year 6 (aged 10 to 11 years)
Data combined 5-years, (2017 to 2018, 2018 to 2019, 2019 to 2020, 2021 to 2022, and 2022 to 2023)
95% confidence intervals are displayed on the chart
Source: Office for Health Improvement and Disparities. Public Health Profiles. 2023
6.3.2 Adult obesity and link with inequalities
Based on published data nationally:
Age: People aged 45 to 74 years are more likely to be overweight or obese than other age groups [16].
Gender: Men are more likely to be overweight than women, while women are more likely to be obese than men [17]
Ethnicity: In adults, Black ethnic groups have the highest rates of excess weight, with White British individuals following closely behind.
Disability: Prevalence of obesity is 12% prevalence percentage points higher for people with disabilities compared to those without a learning disability. Additionally, individuals with learning disabilities are more likely to be severely obese compared to those without learning disabilities.
Mental health: There is growing evidence of bi-directional associations between mental health and obesity. Research indicates that obese individuals face a 55% increased risk of developing depression over time, while those with depression have a 58% increased risk of becoming obese [18]. Additionally, school-aged children with obesity have a 63% higher likelihood of being teased and bullied, which can lead to feelings of shame and contribute to anxiety, depression, low self-esteem, poor body image, and even suicidal thoughts at a young age. These issues can negatively impact children’s life chances and opportunities, exacerbating social and health inequalities [19]. Therefore, incorporating mental health components into a comprehensive approach to addressing obesity is crucial.
Deprivation: National evidence for England shows that obesity rates are highest in areas of greatest disadvantage. In addition, the gap between the most and least deprived groups has widened over the past decade. The mapping of obesity prevalence and deprivation show some of the Surrey’s key neighbourhood areas have the highest prevalence of obesity particularly in the East of the County (Figure 31).
Figure 31. Obesity prevalence by deprivation in Surrey’s key neighbourhood areas
IMD 2019 average ward score
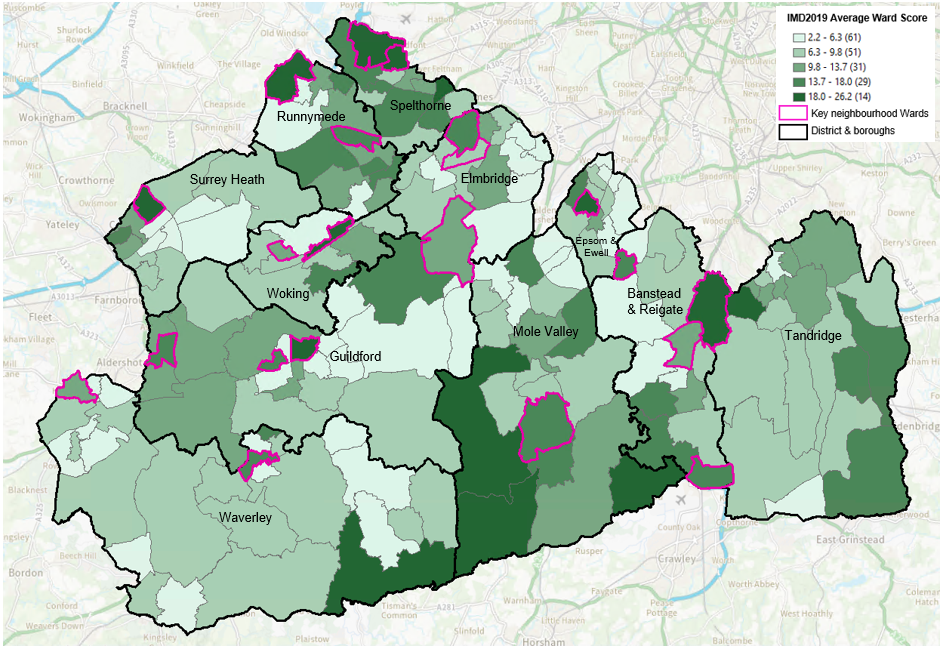
Adult obesity prevalence (2022/23)
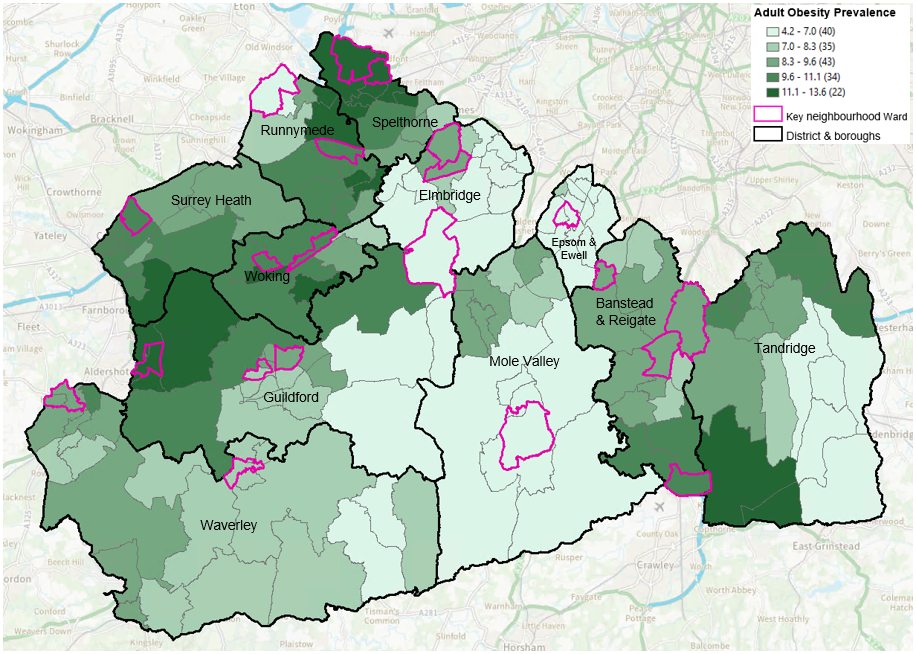
Source: Produced by Surrey County Council Public Health team
Abbreviations: IMD, Index of Multiple Deprivation
6.4. Obesity and its impact on health across life course
6.4.1. Impact of obesity on children’s health and wellbeing
In 2019, poor diet was the third highest risk factor for hypertension, following tobacco use. Diets high in sodium and low in nutritious foods like fruits, vegetables, and whole grains increase the risk of cardiovascular disease. Obesity is also a risk factor in pregnancy, increasing risks to both mother and baby, with the highest rates in the pregnant women living in deprivation. Nutritional exposure in the womb can impact the long-term health outcomes for babies.
Children with obesity are more likely to face a range of health issues during childhood, which can result in extended periods of illness and a reduced life expectancy compared to children of healthy weight. Moreover, children with obesity are increasingly developing physical conditions that were previously more common among adults [20].
Based on the national evidence:
Breastfeeding: Breastfeeding is associated with a 13% reduction in the prevalence of child overweight or obesity. However, the UK has one of the lowest rates of breastfeeding across the world. Only 36% of babies in England are receiving some breast milk at 6 months compared to 71% of Norwegian babies [21].
Oral health: Tooth decay, primarily due to excess sugar in food and drink, is now the leading cause of hospital admissions for children. Dental decay is the most common reason for 6 to 10 year olds to be admitted to hospital in England [22]. Almost a quarter (24%) of 5-year-olds have dental decay, with 5 times as many children in the most deprived fifth affected compared with the least deprived fifth. Children in the most deprived fifth of the population are over twice as likely to be living with obesity as those in the least deprived fifth by their first year of school [23].
Type 2 diabetes: Recent analysis by Diabetes UK has shown more than a 50% increase in the number of children receiving treatment for type 2 diabetes in Paediatric Diabetes Units across England and Wales. National Paediatric Diabetes Audit (NPDA) data indicates that the impact of type 2 diabetes is disproportionately affecting children from the most deprived areas. Specifically, 4 in 10 children and young people with type 2 diabetes come from these areas, compared to just 1 in 19 from the least deprived areas [24]. According to the latest NPDA data (2022/23), there are currently 21 children diagnosed with type 2 diabetes in NHS Surrey Heartlands ICB.
Asthma: Although there is likely a bi-directional relationship between asthma and obesity, it is increasingly recognised that obesity plays a causal role in the development and exacerbation of asthma [25]. With 1.1 million children living with asthma in the UK, it is estimated that several thousand, up to as many as 120,000, of these cases could be attributed to overweight or obesity, assuming a causal relationship [26].
Fatty liver disease: This condition describes a range of conditions caused by a build-up of fat within liver cells. and in many cases, it is linked to being obese or overweight. Children who are overweight or obese have been reported to have fatty liver disease. In England, it is estimated that as many as 650,000 children have fatty liver disease. [27] While the condition may be asymptomatic in children and can be reversed without lasting damage through weight loss, many will require regular medical monitoring to ensure it does not worsen. Without weight loss, the disease can progress to fibrosis and, eventually, cirrhosis later in life.
Heart disease: Children who are obese or overweight are now starting to show early signs of heart disease, including high blood pressure, elevated fasting blood glucose and blood cholesterol levels [28].
6.4.2. Impact of obesity on adults’ health
Being overweight or living with obesity can lead to serious health challenges for adults throughout their lives and into old age. It significantly impacts both physical and mental health, increasing the risk of chronic conditions such as heart disease, diabetes, and joint problems. Additionally, obesity can contribute to mental health issues, including anxiety, depression, and low self-esteem, further affecting overall wellbeing. These health implications underscore the importance of addressing obesity to improve quality of life and long-term health outcomes:
Life expectancy: Obesity can reduce life expectancy by an average of three years or by 8 to 10 years with severe obesity [29].
Cardiovascular disease (CVD) is largely a preventable disease and closely related to lifestyle and weight. This includes any disease involving the heart or blood vessels. The research has shown that risk of CVD is significantly higher among those who carry excess weight compared to their normal weight counterparts. There is emerging evidence that underweight populations are also at greater risk of CVD. Key conditions associated with unhealthy food and diet (high in salt and fat) include hypertension (also known as high blood pressure) and coronary heart disease (CHD).
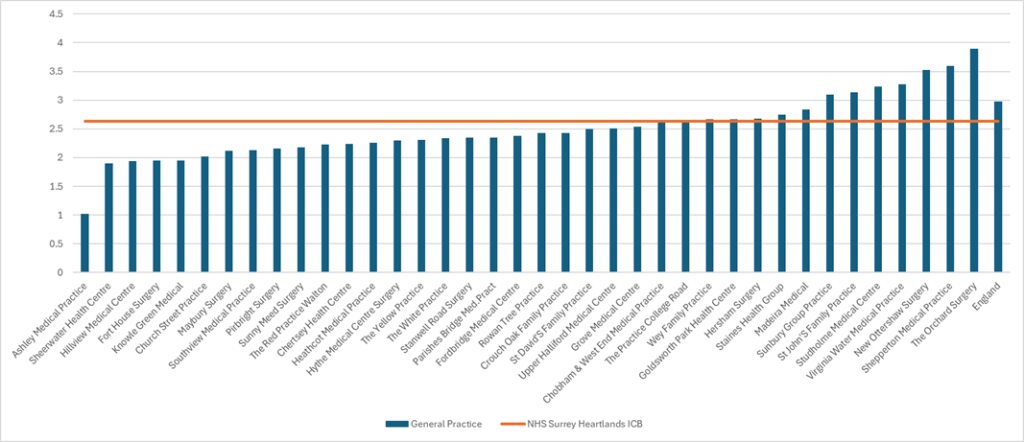
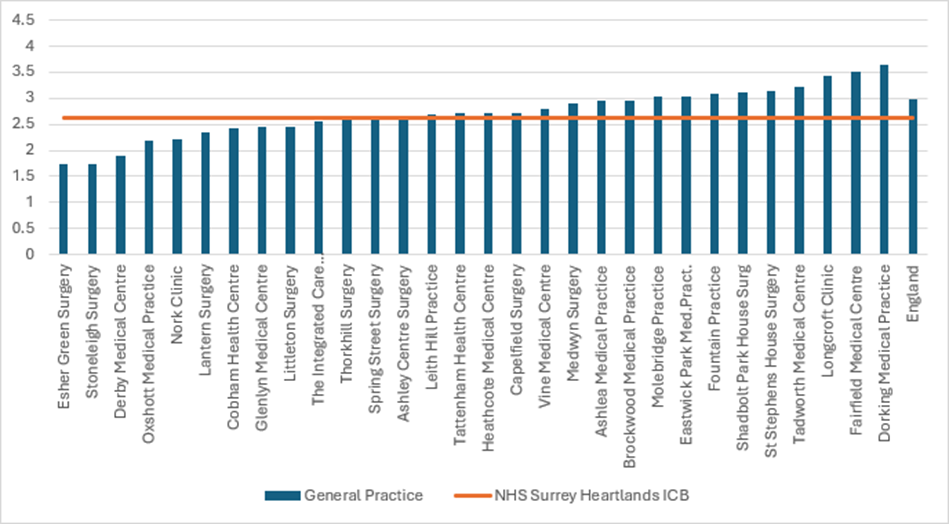
Hypertension: This condition occurs when the pressure in your blood vessels is too high (140/90 mmHg or higher). The hypertension QOF prevalence (2023/2024) for all ages in NHS Surrey Heartlands ICB is 13.92% and 14.04% in NHS Frimley ICB compared to the England prevalence of 14.79%. There is variation in hypertension QOF prevalence by GP practice across Surrey with some exceeding the national and local levels, including some within the key neighbourhood areas highlighted in light blue bars (Figure 32).
Figure 32. Hypertension prevalence (%) in Surrey GP practices based on QOF 2023/24
Surrey Heartlands ICB: North West Surrey
Surrey Heartlands : Surrey Downs
Surrey Heartlands: East Surrey
Surrey Heartlands: Guildford and Waverley
Frimley ICB: NE Hants and Farnham
Frimley ICB : Surrey Heath
Source: Quality and Outcomes Framework, 2023-24 – NHS England Digital
Coronary heart disease (CHD): CHD is a major cause of death in the UK and worldwide. CHD is sometimes called ischaemic heart disease or coronary artery disease. Coronary heart disease is the term that describes what happens when the heart’s blood supply is blocked or interrupted by a build-up of fatty substances in the coronary arteries. Over time, the walls of the arteries can become furred up with fatty deposits. This process is known as atherosclerosis and the fatty deposits are called atheroma.
Over 80% of individuals with CHD are overweight or obese. Obesity acts as an independent risk factor for CHD development. The below data displays QOF CHD prevalence for 2023/24 across NHS Surrey Heartlands ICB and NHS Frimley ICB general practices (Figure 33).
Figure 33. Prevalence of Coronary Heart Disease (%) based on QOF 2023/24
Surrey Heartlands ICB: North West
Surrey Heartlands ICB: Surrey Downs
Surrey Heartlands ICB: East Surrey
Surrey Heartlands ICB: Guildford and Waverley
Frimley ICB: NE Hants and Farnham
Frimley ICB: Surrey Heath
Type 2 diabetes: Being overweight or obese is the main modifiable risk factor for type 2 diabetes, with the likelihood of developing the disease and the risk of complications being closely linked to BMI. There is a 7 times greater risk of diabetes in obese people compared to those of a healthy weight, and a threefold increase in risk for overweight people [30]. Type 2 diabetes prevalence in those below the age of 40 is an increasing trend year on year [31]. The correlation between weight and diabetes is seen heavily in early onset diabetes with greater prevalence of obesity being present in younger demographics (19 to 25 year olds), compared to older demographics who are diagnosed. [32]
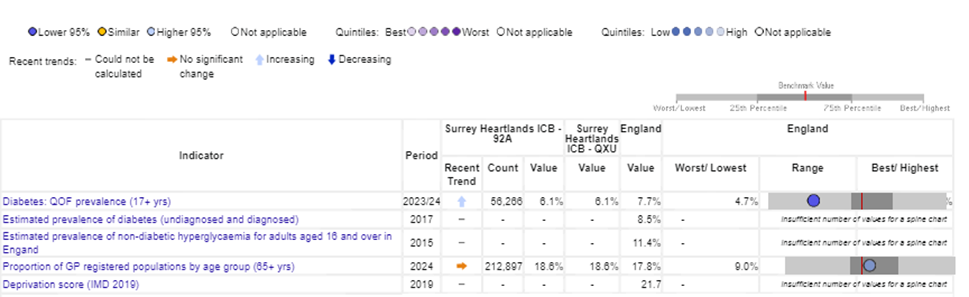
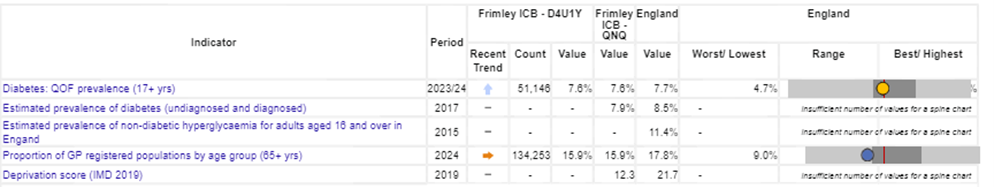
QOF 2023/24 indicated a diabetes prevalence of 6.1% in Surrey Heartlands (56,266) and 7.6% (51, 146) in Frimley ICB (Figure 34).
As per QOF 2023-24 data, there were 49,310 registered Type 2 diabetic patients in NHS Surrey Heartlands ICB. Prevalence was greatest in those aged 40 – 64 (40.2%) compared to other age groups. Males (57.3%) have higher prevalence compared to females (42.7%), and the majority of patients are from the least deprived IMD quintiles (44.9%).[32] In addition, 76.7% of patients are from White backgrounds, with Asian and Asian British backgrounds representing 14.1% of Type 2 diabetes registrations [33]. In Frimley ICB there were 45,95 people registered with type 2 diabetes. Similar to Surrey Heartlands, Frimley had a higher prevalence of type 2 diabetes in men (56.4%) compared with women (43.6%). The prevalence was higher amongst those from most deprived areas (1st to 3rd most deprived) and from White backgrounds (59.7%). [34]
Figure 34. Type 2 Diabetes Prevalence by aged based on QOF in Surrey ICBs
NHS Surrey Heartlands ICB
NHS Frimley ICB
Source: Department of Health and Social Care. Fingertips: Public Health Profiles.Diabetes – Data | Fingertips | Department of Health and Social Care
Cancer: Obesity is the second biggest preventable cause of cancer in the UK after smoking [35].
Dementia: Individuals who are obese are a third more likely to develop vascular dementia compared to those with a healthy weight [36].
Mental health: People with overweight and obesity are more likely to experience stigma and discrimination. Being overweight or obese is associated with poor psychological and emotional health.[19]
6.5. Healthy weight and physical activity
Much of the burden of physical inactivity is not related to obesity. Insufficient physical activity raises the risk of conditions such as cancer, depression, heart disease, stroke, and possibly dementia, even in people of healthy weight. Therefore, increasing physical activity across the population would deliver greater health benefits than just tackling obesity alone. Studies have shown that the overall costs of physical inactivity and poor diet far exceed the costs directly linked to obesity. As a result, focusing solely on obesity understates the potential benefits of addressing it through increased physical activity and better diets.
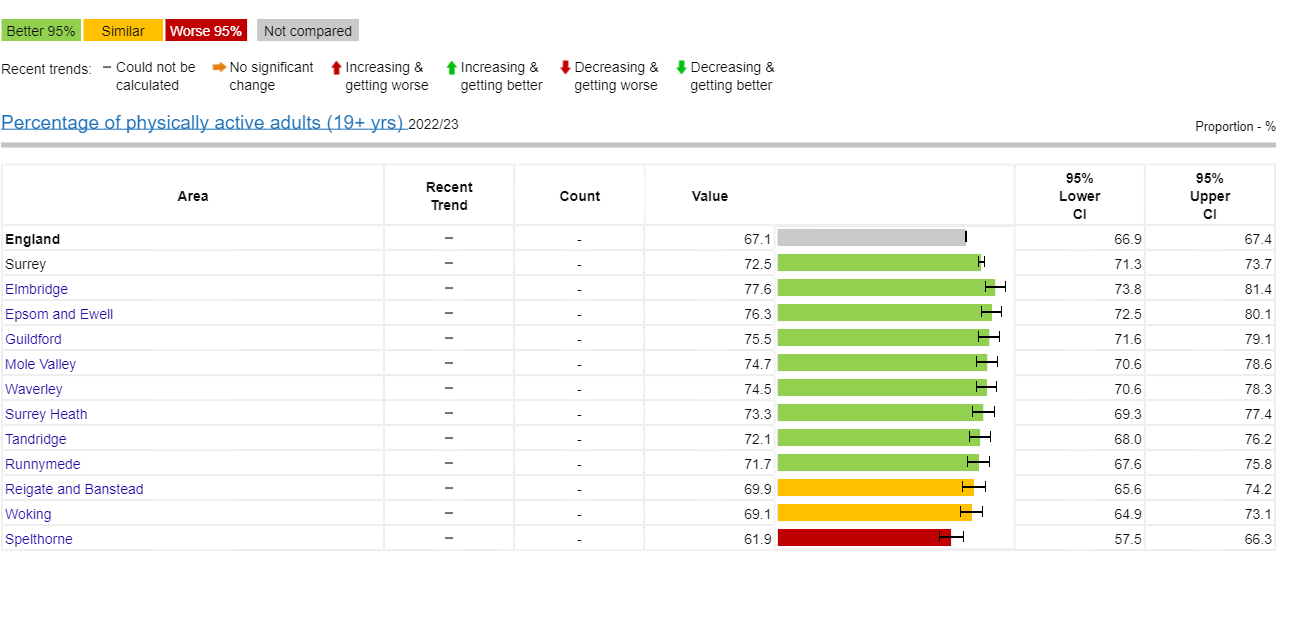
Considering the confidence intervals, Spelthorne (61.9%) has a significantly lower percentage of physically active adults compared to England (67.1%). Reigate and Banstead (69.9%) and Woking (69.1%) have similar prevalence to England and all others have a higher prevalence of adults who are physically active (Figure 35).
Figure 35. Percentage of physically active adults (19+) in Surrey 2022/23
Source: Obesity Profile – Data | Fingertips | Department of Health and Social Care (phe.org.uk)
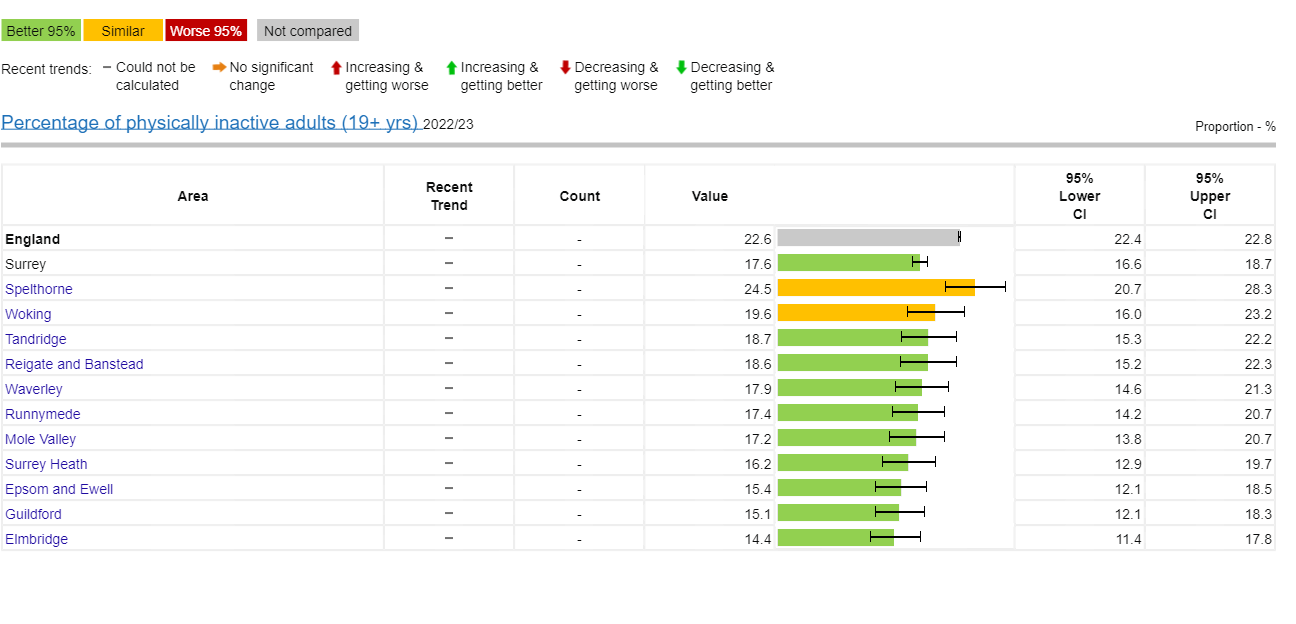
Both Spelthorne and Woking have a greater proportion of inactive adults compared to Surrey’s average of 17.6%. In fact, the percentage of inactive adults in Spelthorne exceeds England’s average of 22.6% (Figure 36).
Figure 36. Percentage of physically inactive adults (19+) in Surrey 2022/23
Source: Obesity Profile – Data | Fingertips | Department of Health and Social Care (phe.org.uk)
6.6. Impact of obesity on society
The cost of obesity in the UK is substantial, impacting both the healthcare system and the broader economy. Key figures include:
- NHS costs: The NHS spends around £6 billion annually on treating obesity-related conditions. This includes costs associated with diseases such as diabetes, heart disease, certain cancers, and dementia, which are often linked to obesity.
- Wider economic impact: Obesity also leads to indirect costs such as lost productivity, absenteeism, and premature death.
- Social care costs: Many obesity-related conditions, including dementia and heart disease, contribute significantly to social care expenses, further increasing the financial burden. Individuals who are severely obese are three times more likely to require adult social care compared to those with a healthy weight. The social care needs of people with severe obesity are often more expensive, involving costs such as housing adaptations and the provision of additional carers [30].
The Institute of Fiscal Studies [37] issued a report on the cost of obesity in the UK, updated in November 2023, (Table 2) outlining the costs of obesity to the NHS.
Table 2. Estimates of cost of obesity in UK in £ billion (2023)
| Costs | Costs from obesity (% of total) | Costs from overweight (% total) | Costs from overweight and obesity (% total) |
| Individual costs, lower life expectancy and a reduction in the quality of life, informal social care | 54 (72%) | 9 (40%) | 63 (64%) |
| NHS costs (National) | 11 (15%) | 8 (20%) | 19 (20%) |
| Wider society costs – costs of inactivity in work, formal social care | 9 (13%) | 6 (26%) | 16 (16%) |
| Total in £bn | 74 | 24 | 98 |
Extrapolating this data to NHS Surrey Heartlands obesity alone accounts for £180-£220 million per year in NHS costs.
7. Role of food in healthy living and ageing
7.1. Ultra-processed foods
Ultra-processed foods (‘UPFs’) are typically made from five or more ingredients, including numerous additives and components that are not commonly used in home cooking. These foods often contain higher levels of total fat, saturated fat, added sugar, salt (also known as High Fat, Sugar, Salt: HFSS), and energy density, while being lower in fibre and vitamins. The World Health Organization (WHO) has classified processed meat as a Group 1 carcinogen due to compelling evidence linking it to colorectal cancer. This highlights the connection between diet and poor health outcomes.
The NOVA classification system (a framework for grouping edible substances based on the extent and purpose of food processing applied to them) categorises foods and drinks into four groups based on processing levels [38]:
- Group 1: Unprocessed and Minimally Processed Foods
These include natural foods in their basic form (e.g., fruits, vegetables, animal products, fungi, and water) or those slightly altered by processes like freezing or drying (e.g. frozen vegetables). - Group 2: Processed Culinary Ingredients
Derived from Group 1 foods through methods like extraction or refining, these ingredients (e.g., honey and vegetable oils) are used in cooking. - Group 3: Processed Foods
Made by combining unprocessed foods with added ingredients (e.g., oil, salt, sugar) for preservation, like canned vegetables, salted nuts, and smoked meats. - Group 4: Ultra-Processed Foods (UPFs)
Created through complex industrial processes, UPFs consist largely of food derivatives (e.g., sugars, oils, proteins) from high-yield plants or intensively farmed animals. Examples include baby formula, sweetened cereals, soft drinks, mass-produced breads, margarine, and some meat and dairy substitutes. These foods undergo multiple processing stages, turning raw components into highly processed products.
Table 3 categorises foods into three groups: UPFs, foods that are both UPFs and HFSS, and foods that are neither. The table highlights which food types are key contributors to each category, but it does not imply that all items in a food group fall under one category. Notably, some UPFs are not HFSS and thus not regulated under current guidelines, including various types of manufactured bread, processed potato products, yoghurt and dairy desserts, pre-packed cooked vegetables, and low-calorie soft drinks.
Table 3. Food groups contributing to the categories ultra-processed food (UPF) only; high in fat, salt and sugar (HFSS) only; both; and neither
| UPF only | HFSS and UPF | HFSS only | Neither HFSS nor UPF |
| Manufactured white, brown, granary, wheatgerm and wholemeal bread | Manufactured biscuits | Sugars, preserves and sweet spreads | Semi-skimmed milk |
| Manufactured chips, fried and roast potatoes, and potato products | Soft drinks, not low calorie | Butter and cheeses | Unprocessed fruit |
| Yoghurt, fromage frais and dairy desserts | Crisps and savoury snacks | Whole milk | Pasta, rice and other cereals |
| Pre-packed cooked vegetables | Chocolate, confectionery | Bacon and ham | Other potatoes, potato salads and dishes |
| Soft drinks, low calorie | Manufactured buns, cakes, pastries and fruit pies | Nuts and seeds | Pure fruit juices |
Estimates from dietary survey data indicate high intake of UPFs in the UK. According to the National Diet and Nutrition Survey (NDNS), UPFs make up 51% of energy intake for adults over 19 years and 68% for teens aged 12 to 18 [39]. For young children (aged 2 to 5 years), it has been reported that 61% of their total calorie intake is from UPFs. In addition, on average, 57% of calories in the UK diet are from UPFs [40], with some people consuming as much as 80% [41]. Imperial College London research also revealed that 61% of primary school children’s lunch calories come from UPFs, increasing to 70% for secondary school students [42].
Consuming large amounts of energy, especially from foods high in fat and sugar, without burning off that energy through physical activity results in the excess being stored as body fat. Over 90% of people understand they should limit their intake of HFSS and 99% recognise the importance of eating fruits and vegetables for maintaining good health.
7.2. Fruit and vegetables
Nationally, only 18% of children in England eat the recommended five portions of fruit and vegetables a-day [43]. Statistically (taking into account 95% confidence intervals), both Woking (29.2%) and Surrey Heath (29.5%) have lower proportion of adults meeting their 5-a day recommended fruit and vegetables target than Surrey average (34%) but are similar to England average (31%). Except for Mole Valley (34%) and Waverley (41.2%) which have a statistically higher proportion of adults meeting the 5 a day fruit and vegetables consumption recommendations, other districts and boroughs have a similar proportion to Surrey (31%)’s average (Figure 37).
Figure 37. Proportion of adults meeting the ‘5-a-day’ fruit and vegetable consumption recommendations
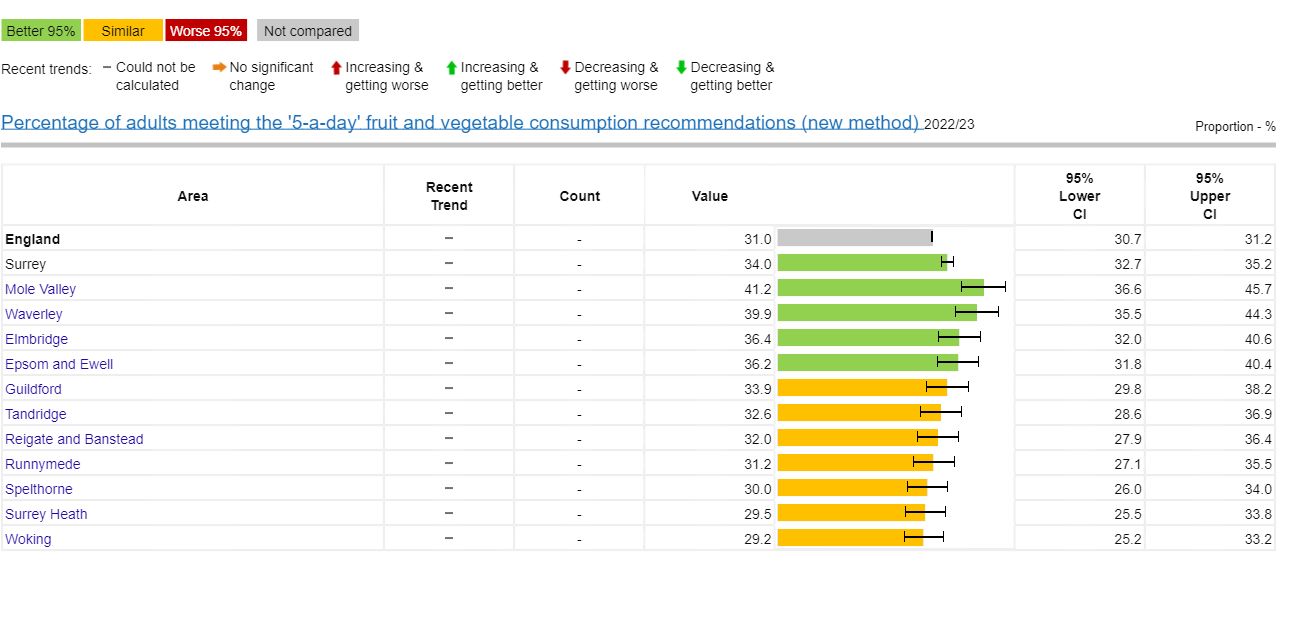
Source: Obesity Profile – Data | Fingertips | Department of Health and Social Care (phe.org.uk)
8. Malnutrition
8.1. Definition of malnutrition
Malnutrition (or under nutrition) is a common clinical and public health problem, affecting all ages and all care settings. One form of malnutrition is disease-related malnutrition, whereby a disease creates specific nutritional needs that result in an insufficient intake of energy and nutrients. Examples of disease-related malnutrition include some types of cancer or cardiovascular disease. Another form is micronutrient-related malnutrition, which can be either a deficiency or an excess of important vitamins and minerals. This can sometimes be observed in people living with obesity, particularly if they are living in poverty, where the food they eat is high in calories but lacking nutritional quality. Those experiencing food insecurity are more likely to eat a diet of poor nutritional quality and are therefore more likely to be undernourished (Figure 38).
Figure 38. Pathways from inadequate food access to multiple forms of malnutrition
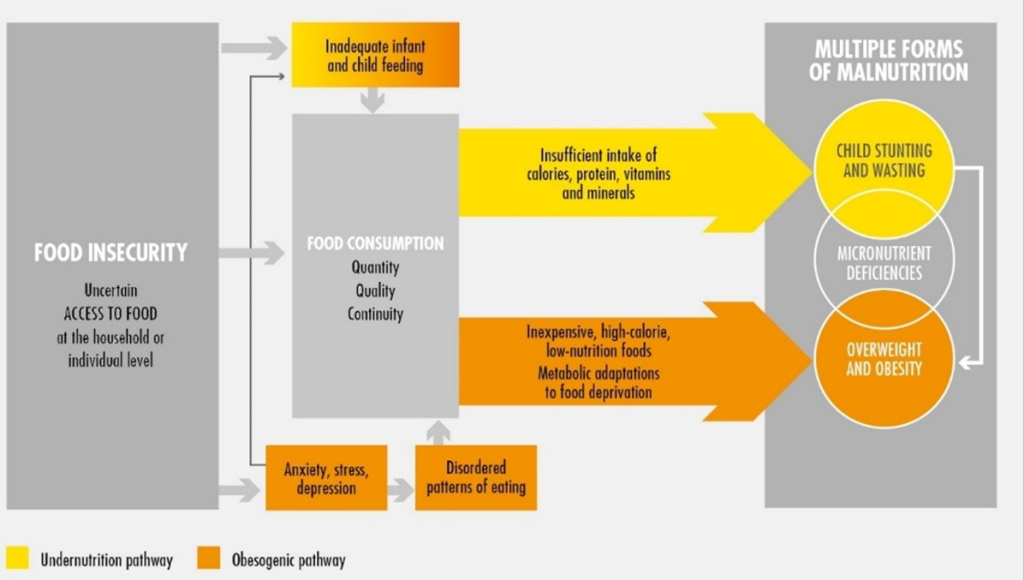
Source: Food and Agricultural Organisations of the United Nations
Being malnourished can lead to poor growth and/or development in children; weaker immune systems and increased risk of infection, and reinfection; muscle and bone weakness, or becoming more frail and likely to fall; poor wound healing; and slower recovery times. It is because of those common effects that, compared with the average well-nourished person, those who are malnourished are twice as likely to visit their GP, have three times the number of hospital admissions and, on average, stay in hospital for three days longer [44]
The National Institute for Health and Care Excellence (NICE) defines a person being malnourished if they have:
- A BMI of less than 18.5kg/m2
- Unintentional weight loss greater than 10% within the last 3 to 6 months
- A BMI of less than 20 kg/m2 and unintentional weight loss greater than 5% within the last 3 to 6 months [45]
Malnutrition affects more than one in 20 people in the UK. However, the rate increases to one in 10 people over the age of 65. It is also more prevalent in those with existing illnesses. Outside those two groups, malnutrition is disproportionately concentrated in lower-income regions and households, and under-nutrition is more common in children from less well-off backgrounds [46]
The Malnutrition Universal Screen Tool (MUST) is the most widely used nutritional screening tool in the UK. It uses five steps to identify adults who are malnourished, at risk of malnutrition, or obese. It also includes management guidelines which can be used to develop a care plan. It is for use in hospitals, community and other care settings and can be used by all care workers [47]
British Association of Parental and Enteral Nutrition’s (BAPEN’s) Malnutrition and Nutritional Survey for Adults 2022 [36] analysed data from 1563 MUST screenings taken in October 2022 (including 118 from Surrey). Ages ranged from 18 to 108 years (mean age 70 years); 52% were women. The survey revealed that nearly half (55% low, 12% medium and 33% high) of all adults screened across health and care settings in the UK were found to be at risk of disease-related malnutrition – the highest figure since this screening begun in 2019 (2021:39%; 2020: 40%; 2019: 42%). Prevalence was highest in individuals with cancer (62%), gastrointestinal conditions (50%), respiratory conditions (48%), frailty (45%) and neurological diseases (43%). Malnutrition was common in community settings, including those in their own homes (56% at medium or high risk) and residents in care homes (55% at medium or high risk). In hospitals, 44% of patients were at risk of malnutrition. Compared to the previous year (2021), nutritional care plans were in place for a higher number of patients (62% versus 50%) [48]
BAPEN’s Economic Short Report (2015) [49] estimated the cost of malnutrition in England to be £19.6 billion per year, or more than 15% of the total public expenditure on health and social care. About half of this expenditure is due to older people (>65 years), and the other half to younger adults and children.
8.2. Impact of malnutrition on health
Data reported by NHS Digital shows low numbers of hospital episodes, as the primary or secondary cause for admission. This is likely to be significantly under reported as malnutrition is often a contributing risk factor but not the primary reason for the hospital episode (Table 4)
Table 4. Hospital Admissions for Malnutrition (8-year data from 2015/16 to 2022/23)
Counts of finished admission episodes (FAEs) where any of the following primary or secondary diagnoses were recorded: Kwashiorkor, Nutritional marasmus, Marasmic kwashiorkor, Unspecified severe protein-energy, malnutrition, Protein-energy malnutrition of moderate and mild degree, Retarded development following protein-energy malnutrition, Unspecified protein-energy malnutrition, Malnutrition in pregnancy (by NHS Trust, for the years 2009-10 to 2022-23)
| Trust | 2015/16 | 2016/17 | 2017/18 | 2018/19 | 2019/20 | 2020/21 | 2021/22 | 2022/23 |
| Royal Surrey Hospital Trust | 25 | 20 | 25 | 20 | 50 | 45 | 40 | 50 |
| Surrey and Sussex Health Care | 30 | 35 | 25 | 40 | 40 | 40 | 35 | 30 |
| Ashford and St Peters Trust | 15 | 20 | 20 | 30 | 15 | 25 | 40 | 50 |
| Epsom and St Helier Trust | 40 | 20 | 25 | 40 | 25 | 30 | 45 | 40 |
| Frimley Park | No data | No data | No data | No data | No data | No data | No data | No data |
Children and Young People
Malnutrition has both short and long-term negative effects on a child’s health and development. As outlined in Save the Children’s Food for Thought Report [50], children who are malnourished early in life are severely disadvantaged in their ability to learn. The report states they are 19% less likely to be able to read a simple sentence at aged 8, and 12% less likely to be able to write a simple sentence than healthy children of the same age. Furthermore, it is estimated that childhood malnutrition has the potential to cut future earnings by at least 20%. This highlights that the effects of malnutrition can last well into adulthood and affect a pupil’s long-term quality of life. Not only is the impact of malnutrition a potential risk to the development of children in the long-term, but it can also be an indicator of wider safeguarding concerns such as abuse or neglect. Identifying these signs early is crucial in providing a complete and proactive approach to safeguarding children in schools. The NCMP measures the BMI of children in Reception (aged 4 to 5 years) and Year 6 (aged 10 to 11 years). From this we can monitor the weight of Surrey children including overweight, obesity and underweight.
Interpretation of children’s BMI is based on percentiles, by comparing a child’s measurement against others of the same age and gender. Underweight is below the 5th percentile for age gender and height, 5th – 84th percentile is a healthy weight range, 85th – 94th percentile is overweight and obese is 95th percentile and above.
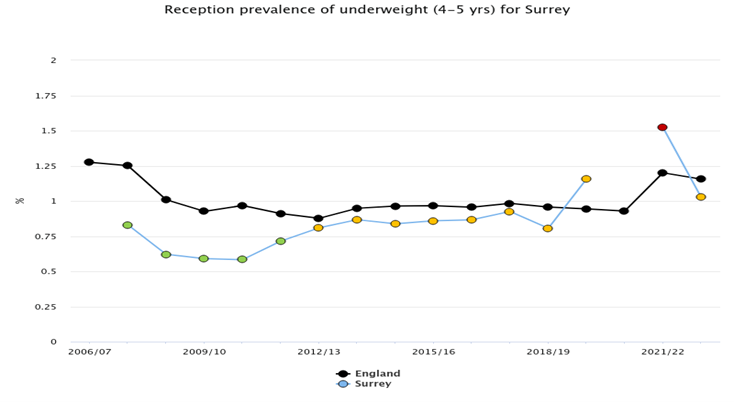
The prevalence of underweight in children in Surrey have mostly been lower than or similar to national prevalence between 2006 to 2022 (Figure 39).
Figure 39. NCMP trends for underweight children (2006 to 2022) in Surrey and England
A. Trend for underweight for Reception age (4 to 5 year olds) 2006 – 2022
B. Trend for underweight for Year 6 (10 to 11 year olds) 2006 – 2022
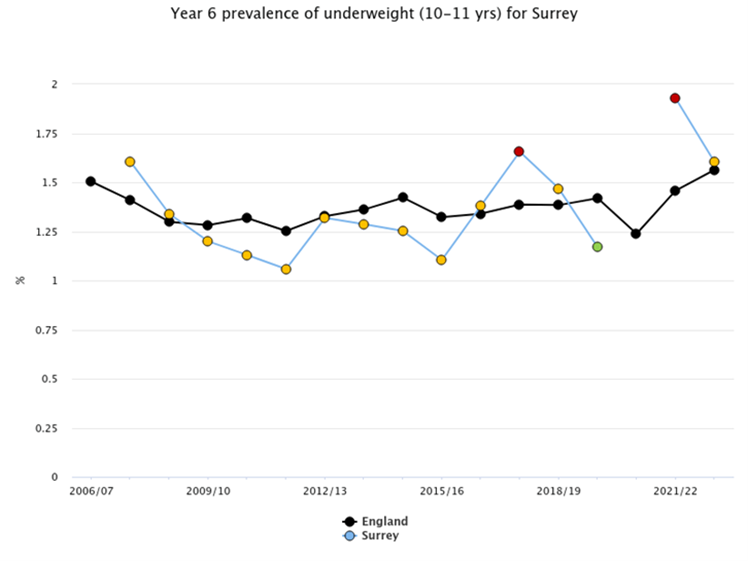
Source: Public Heath Fingertips.
Looking at underweight prevalence by Surrey districts and boroughs, prevalence is greater than 2% for 10 to 11 year olds in Epsom and Ewell, Mole Valley and Reigate and Banstead. Reigate and Banstead having the highest absolute numbers with a total of 45 children underweight (combining those aged 4 to 5 years [n=20], and those aged 10 to 11 years [n=25]). This equates to more than a classroom full of children (Table 5).
Table 5. Prevalence of underweight in children by Surrey District and Borough (NCMP, 2022/23)
| Area | Percentage of children underweight aged 4 to 5 years | Number of Children underweight aged 4 to 5 years | Percentage of children underweight aged 10 to 11 years | Number of Children underweight aged 4 to 5 years |
| England | 1.2 | * | 1.6 | * |
| Elmbridge | 0.7 | 10 | 1.1 | 10 |
| Epsom and Ewell | 1.7 | 15 | 2.7 | 20 |
| Guildford | * | * | 1.4 | 15 |
| Mole Valley | * | * | 2.5 | 15 |
| Reigate and Banstead | 1.2 | 20 | 2.1 | 25 |
| Runneymede | * | * | 1.5 | 10 |
| Spelthorne | 1 | 10 | 1.3 | 10 |
| Surrey Heath | 1.8 | 15 | 1.2 | 10 |
| Tandridge | 1.2 | 10 | 1.6 | 10 |
| Waverley | 0.8 | 10 | 1.9 | 20 |
| Woking | 1.4 | 15 | 1.1 | 10 |
* Data not reported
A shift in the population’s diet is seeing people switch to foods high in calories but low in nutritional value, leading to negative impacts on health.
Traditionally, health has focused on two distinct issues in nutrition, with seemingly little overlap: overnutrition, which includes being overweight or obese; or under-nutrition, which includes being underweight or having nutrient deficiencies. However, both conditions are increasingly being seen in the same population, household and even in individuals, with researchers coining the term ‘double burden of malnutrition’ (DBM). This is where children can be shorter than average for their age (stunted), typically seen in malnutrition but they, and other members of their family, can be overweight or obese. This is sometimes called “over fed but under nourished”. The issue is set to become more problematic with a greater consumption of unhealthy UPFs displacing healthier food. A study by the Imperial College of Public Health found that this was seen more often in poorer households in the countries with higher wealth [51]
Services
The District and Borough Councils in Surrey each offer a hot meal service, seven days a week, for the most vulnerable adults (Table 6). They provide up to three hot meals a day, catering for different diets e.g. vegetarian, gluten free, individuals with diabetes etc. The service must be applied for and is provided at a charge. For meals provided at the weekend there is often a small additional charge. The cost of the meal service is approximately £10 per day, which for some, may be a large percentage of their income. Given the cost of living crisis and the government having reduced the winter fuel allowance to only people on Pensions Credit it may be that some people have to choose between eating or heating, further exacerbating their poor nutritional status and health. The cost of using energy to cook / heat food, particularly for those on pre-payment meters, has also become an increasing burden for those in financial hardship. (Pay (for it) as you go: Prepaid energy meters and the heat-or-eat dilemma – ScienceDirect)
Table 6. Example menu: Elmbridge and Mole Valley Meal Service.
| Service | Provides | Cost |
| Hot lunchtime service | Either a 2 course (main meal and pudding) or 1 course meal. Meals include classics such as roast beef and Yorkshire pudding or fish in parsley sauce. Puddings include apple crumble and chocolate cake. |
£6 for 2 courses or £5.65 for 1 course |
| Supper Service | Delivered with the lunchtime meal, consisting of a sandwich and cake, fruit or other cold dessert. | £3.80 |
| Breakfast Service | Delivered at lunchtime for the following morning, consisting of either cereal, yoghurt or rolls (with butter, jam or marmalade) and a carton of fruit juice. | £1.70 |
For some children the free school meal will be the only hot meal they receive, with no meals provided at weekends or school holidays. The Holiday, Activity and Food Clubs, funded for three years (2022 to 2025) by the Department of Education, aimed to bridge the gap by providing school aged children up to Year 11 where the family are in receipt of free school meal benefits. Called Club4 in Surrey, the scheme provided free activities and breakfast and/or lunch during the school holiday. Funding for this service ends March 2025 with the Christmas holiday 2024 being the final session. It is unclear if the Labour government intend to continue with this programme.
During 2023, Club4 provided 58,317 places with 43,542 attending. A total of 64% of participants were from wards where free school meal take up was high, 84% were primary aged children and 16% secondary aged children. At least 21% of attendees lived in a deprived ward in Index of Multiple Deprivation (IMD) 1to 4, with 29% living in Income Deprivation Affecting Children Index (IDACI) 1 to 4. Over the entire year, 62,000 healthy meals were provided during camp provision with a further 11,278 meals provided as a take home offer [52].
In Summer 2024, 30,117 children attended the camps, with over 43,000 meals provided. 29% of participants disclosed an additional need or disability. 22% of participants live in IMD wards 1 to 4 and 28% in IDACI 1 to 4.
For Easter 2024, almost 10,000 children attended the camps, with 26% of participants disclosing an additional need or disability, and 23% of participants living in IMD wards 1 to 4 and 30% in IDACI 1 to 4.
At the Labour Conference, September 2024 the Government announced a new breakfast club initiative for all primary schools. They will be inviting 750 schools to pilot the service from April 2025. This has potential to provide children with the nutrition they need at the start of the day, however breakfast cereals and yogurts are one of the main providers of sugar in children’s diets, therefore it is important to ensure that options available are healthy. Increasing consumption of sugar increases the risk of dental caries, obesity, and poor behaviour without improving nutritional status.
9. Factors that influence how we choose what we eat
Both the built and natural environments can influence our health and wellbeing. Local authorities have powers to help shape these environments, including tackling the growth of new fast-food outlets, but also introducing more cycling paths, and making the best use of open green spaces.
9.1. Food availability
In a recent food survey completed by 910 people across Surrey, just over 50% reported they have easy access to healthy food and meal options in supermarkets or local shopping areas, and 57% said that it takes them between 5 and 15 minutes to get to their preferred food supply destination. In the same survey, over 60% said it is either fairly or very important to have access to local produce and food. Only 32% of the responders said they grow their own food. Most responders (75%) said they shop weekly in the local supermarkets, 30% said they buy their food on monthly basis from an independent greengrocer/butcher/baker. Only 29% said they would shop from a local food market or a farm shop.
The e-food desert index (EFDI) [53] is a comprehensive, multi-dimensional index developed for Great Britain that evaluates the extent to which neighbourhoods exhibit traits linked to food deserts. It focuses on four key factors affecting access to groceries:
- Proximity and density of grocery retail facilities
- Transport and accessibility
- Socio-economic and demographic characteristics of neighbourhoods
- E-commerce availability and adoption
The EFDI introduces novel indicators related to online grocery services, including home delivery availability and the likelihood of residents engaging with online grocery shopping, derived from the 2018 Internet User Classification by the CDRC. Beyond urban deprivation, the EFDI identifies a new form of inequality in grocery access, referred to as “e-food deserts.” These are remote and rural areas that face a dual disadvantage: limited access to physical grocery stores and inadequate provision of online grocery services.
Across Surrey Districts and Boroughs, Epsom and Ewell, Surrey Heath, Elmbridge and Spelthorne have the lowest EFDI score, which indicates poorer access to both physical retail and limited provision of online grocery services. (Figure 40)
Figure 40. Location of food deserts in Surrey (EFDI, 2022/23)
Location of food deserts in Surrey, with key neighbourhoods by wards, 2022-2023 using EFDI score
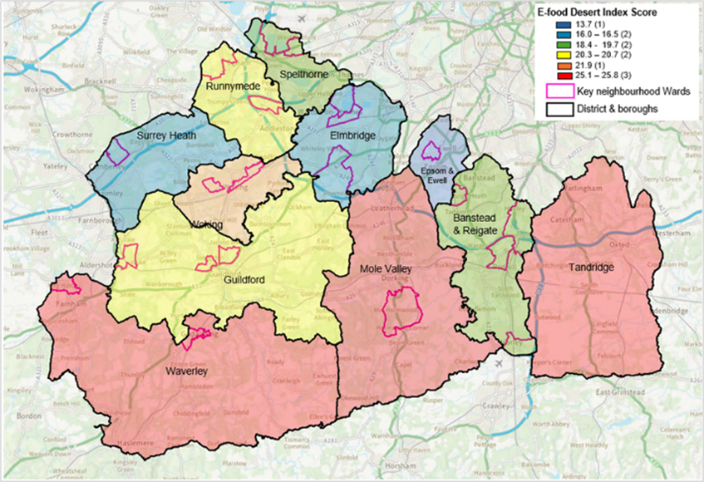
| Area | E-food Desert Index (EFDI) score |
| England | 21.1 |
| Mole Valley | 25.8 |
| Waverley | 25.6 |
| Tandridge | 25.1 |
| Woking | 21.9 |
| Guildford | 20.7 |
| Runnymede | 20.3 |
| Reigate and Banstead | 19.7 |
| Spelthorne | 18.4 |
| Elmbridge | 16.5 |
| Surrey Heath | 16.0 |
| Epsom and Ewell | 13.7 |
9.2. Location of fast-food outlets in Surrey and role of planning
While not all fast food is unhealthy, it is typically low in fibre and high in saturated fat, salt and calories. A previous analysis had shown the density of fast-food outlets varies per local authority across England, ranging from 26 to 232 outlets per 100,000 population, with the national average being 96.5 (2017) [54]. In Surrey, Woking has the highest rate of fast-food outlets (86.8 per 100,000 population) followed by Surrey Heath (78.9), Epsom and Ewell (73.4) and Runnymede (70.6) (Figure 41).
Figure 41. Density of fast-food outlets by local authorities in Surrey
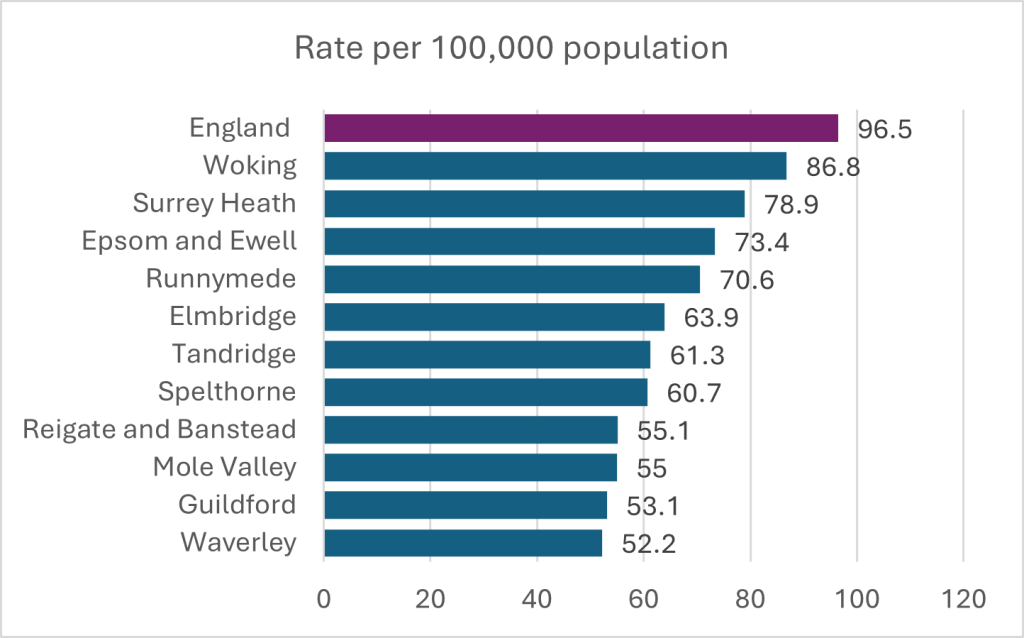
Source: Feat
The data used to create the density of fast food outlets map was the Food Standards Agency (FSA) Food Hygiene Rating Scheme (FHRS) data (31/12/2017 Snapshot and 02/07/2018 snapshot for Bury data)
PHE Publications gateway number: 2018064
Figure 42 overlays the location of fast-food outlets and deprivation in Surrey. This highlights key areas of focus such as Spelthorne, Surrey Heath, Epsom and Ewell and Runnymede, which include some of the key neighbourhood areas (ward level) in Surrey.
Figure 42. Location of fast-food outlets and deprivation
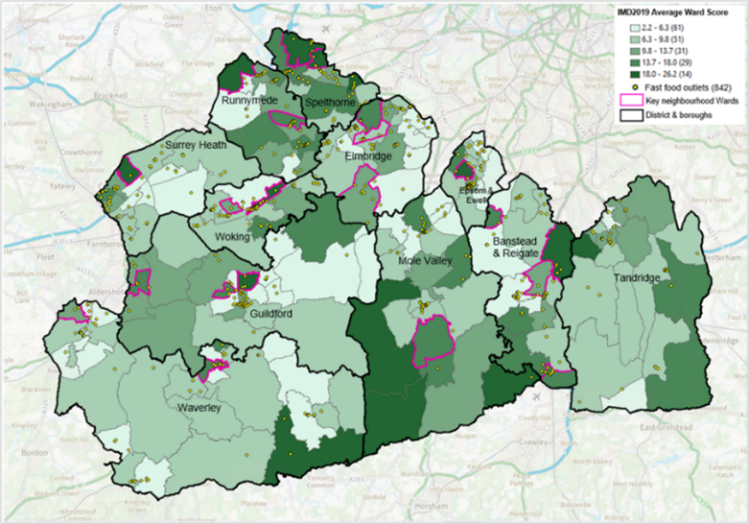
Source: English indices of deprivation, 2019, Food Standards Agency
Produced by Surrey County Council Public Health
Proximity of fast-food outlets make it more convenient for families and children to access unhealthy food. A mapping of local fast food outlet proximity to schools shows a higher density across the North and North East, and North West of the County (Woking, Spelthorne, Surrey Heath; Figure 43 ). Spelthorne, Surrey Heath and Woking also have a higher prevalence of children in Year 6 who are overweight or obese. Surrey Heath and Woking also have the lowest proportion of adults who meet their 5-a-day fruit and vegetable recommended intake across Surrey’s Districts and Boroughs (as shown above in Figure 37).
Figure 43. Proximity of fast-food outlets to Surrey schools
Fast food outlets
Location of schools*
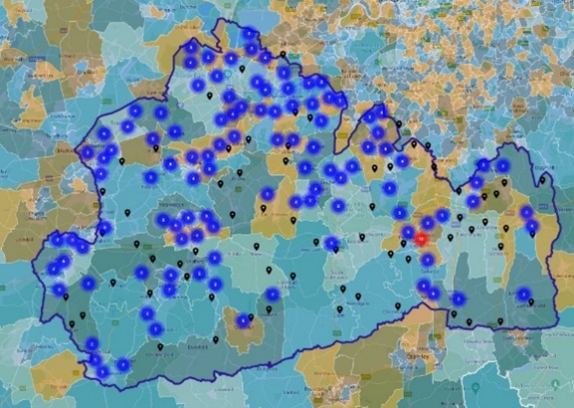

*Including independent schools, local authority-maintained schools, special schools, academies, free schools
Source: Produced by Surrey County Council Public Health
The density of fast-food outlets has also been shown to be linked to levels of anti-social behaviours. In Surrey this is most evident in Surrey Heath, Woking, Guilford, Mole Valley, Spelthorne and Elmbridge (Figure 44).
Figure 44. Location of fast-food outlets and anti-social behaviours
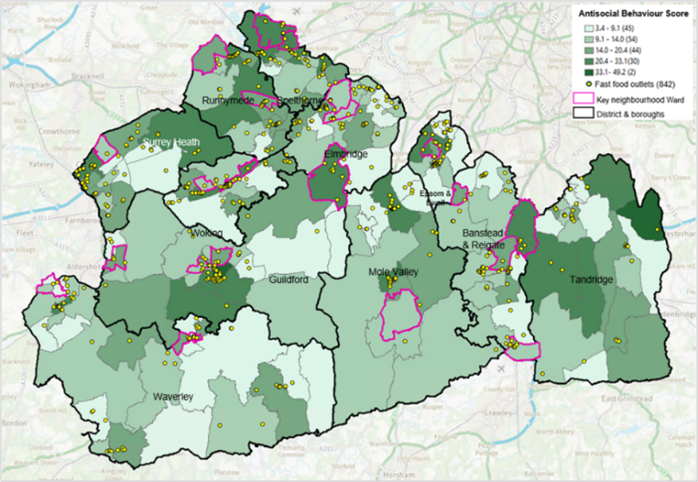
Source: Produced by Surrey County Council Public Health
Local authorities in the UK are working to limit the growth of unhealthy takeaway businesses, especially around schools and in areas with existing clusters of fast-food outlets. In at least 35 areas, takeaway management zones near schools have reduced the approval of new takeaways by 54% over six years. However, some public health experts note that planning regulations alone are insufficient, as they can limit the number of takeaways but cannot control the specific types of food sold [55].
Although the National Planning Policy Framework (NPPF) guides local planning decisions, food and health concerns are mentioned only briefly, and councils have limited authority to take health considerations into account when approving licenses. To address this, the Local Government Association has suggested updating the Licensing Act to include a public health objective, while Labour’s manifesto promises to empower councils to block fast-food developments near schools. The Government has recently consulted on potential changes to support local authorities in fostering healthier food environments and tackling childhood obesity, and a toolkit has been developed to help councils implement takeaway management zones effectively [56].
9.3. Food affordability
Households with low incomes allocate a larger portion of their budget to food compared to the average household (Figure 45). Evidence also suggests that people in poverty struggle to afford a healthy diet, with estimates indicating that following recommended dietary guidelines could spend half the disposable income of the poorest 20% of the population [57]. Healthier foods are over twice as expensive per calorie as less healthy foods. Between October 2021 and October 2022, the price of fruit rose by 10.3% and vegetables by 15.1% [58].
Figure 45. Percentage of disposable income required to afford the Eatwell Guide per income quintile (2020/21 and 2021/22)
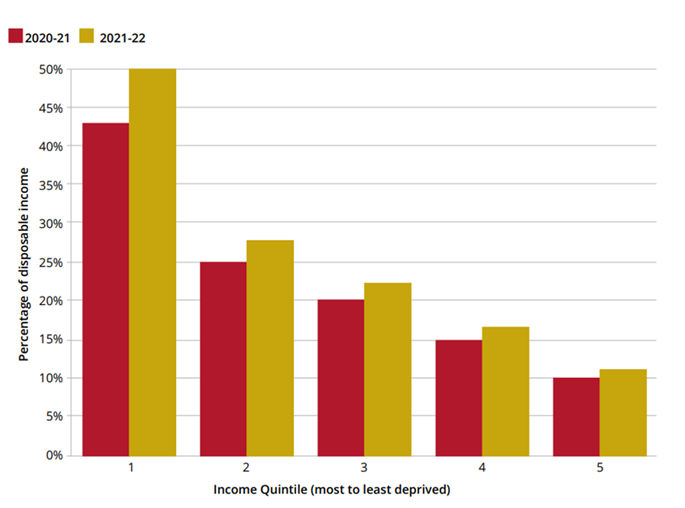
Source: Food foundation report TFF_The Broken Plate 2023_Digital_FINAL..pdf produced by University of Oxford; London School of Hygiene & Tropical Medicine secondary analysis of the Family Resources Survey 2021-22
9.4. Role of advertising
Regularly consuming foods and drinks high in calories, sugar, and fat is a major contributor to weight gain and, over time, obesity. People make numerous food choices daily, often influenced by a constant stream of opportunities and encouragement to select less healthy options. Research indicates that advertising significantly impacts children’s food choices. Evidence shows that exposure to advertising for HFSS (high in fat, sugar, and salt) products can influence children’s eating habits both in the short term, prompting them to eat more immediately after seeing a HFSS advertisement [59][60] and over the long term by shaping their food preferences early in life [61].
Although the evidence is less definitive for adults, [62] [63] [64] some studies suggest that reducing exposure to HFSS advertising could also affect adult purchasing and consumption behaviours. Implementing stricter restrictions on HFSS advertising has the potential to curb overconsumption and deliver considerable health benefits.
People on low incomes face a higher exposure to unhealthy food advertising, particularly through outdoor ads, which are more prevalent in less affluent areas. Research from Adfree Cities found that 82% of outdoor ads are placed in areas with the lowest disposable income, with much of this advertising focused on HFSS foods. For example, a study in Newcastle showed that HFSS food advertising was three times more common in poorer parts of the city than in wealthier areas. Additionally, complaints to the Advertising Standards Authority (ASA) about misleading ads can take 60 to 115 days to process, meaning potential harm may already occur before action is taken [65].
Unhealthy food brands also frequently use sponsorships to advertise. Some experts have highlighted the prevalence of Coca-Cola ads in events like the Olympics, the World Cup, and even local sports games. Some directors of public health have raised that some local authorities facing resource limitations often struggle to reject sponsorships, even when they promote unhealthy food. While high-profile athletes like Cristiano Ronaldo have occasionally taken a stand against endorsing such products, campaigners are calling for regulations to restrict sports sponsorships to healthier food and drink products [66].
9.5. Food marketing: Commercial determinants of health
Addressing commercial determinants of health involves recognising and mitigating the impact of these factors to promote healthier environments and improve public health outcomes. Commercial determinants of health refer to the ways in which business practices and commercial interests influence health outcomes. These determinants encompass a range of factors, including:
- Marketing and advertising: The promotion of unhealthy products, such as sugary beverages, processed foods, and tobacco, can drive consumption patterns that negatively impact health.
- Product formulation: The design and composition of products, including high levels of sugar, fat, and salt, contribute to health issues like obesity, diabetes, and cardiovascular diseases.
- Access and availability: The distribution and accessibility of unhealthy products, often influenced by commercial interests, can affect dietary choices and health outcomes.
- Pricing strategies: Pricing policies, such as discounts on unhealthy foods or premiums on healthier options, can impact consumer choices and health.
- Corporate influence: The power of corporations to influence public health policies, research funding, and regulations can affect health standards and practices.
- Workplace environment: Corporate practices that affect workplace health, such as sedentary work environments or limited access to healthy food options, can influence employees’ overall health.
9.6 Psychosocial influences
A recent mixed-methods research study conducted locally by the University of Surrey with young people aged 13 to 17 years old aimed to identify how Surrey can best support young people to live healthy lives, and specifically to make healthy food choices, be physically active and achieve a healthy weight. The findings of this report highlighted a key role for positive role models (parents, media, school), food environment and choices available (Figure 46). The report flagged a need for a holistic approach, which considers the connections between these determinants, so that the impact of any specific actions can be maximised (Report in publication).
Figure 46. Factors influencing healthy eating amongst young people aged 13 to 17 years in Surrey
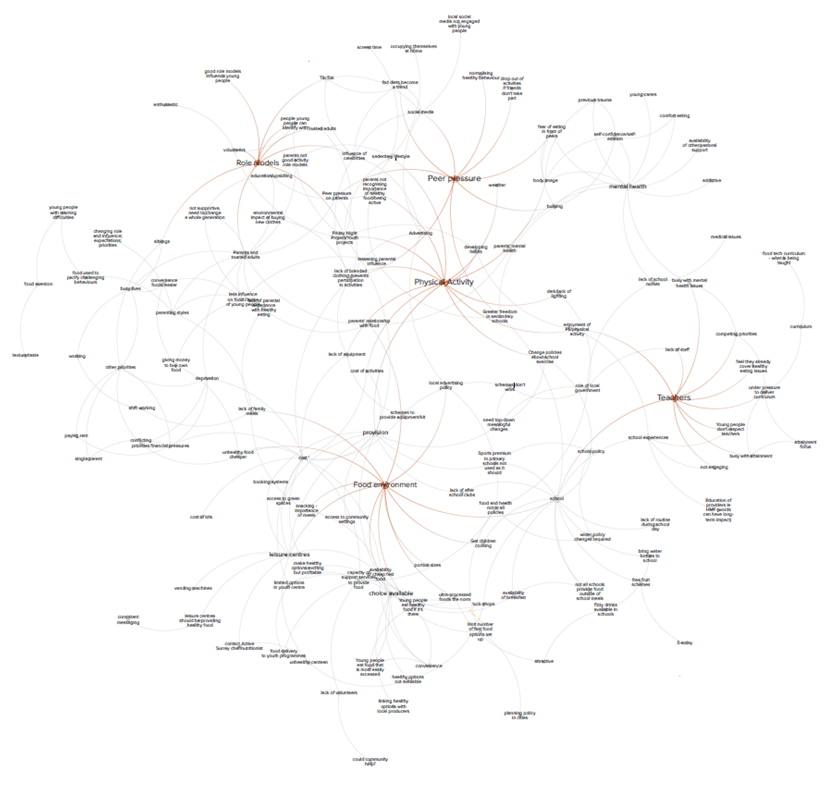
Source: A Whole Systems Approach to Healthy Weight in 13-17 year olds in Surrey 2024 (produced by University of Surrey and commissioned by Surrey County Council Public Health-in publication)
10. Food and its impact on climate change
Overweight and obesity also have significant environmental impacts. Food production, a major contributor to climate change, has adverse effects on the environment such as biodiversity loss and high freshwater use [67]. It is estimated that individuals in the UK consume 16% more calories than the average person did in 1970 which results in an additional 20 – 60 mega tonnes of carbon dioxide equivalents in greenhouse gas emissions annually [68].
There is a disconnect between current food production and what is optimal for health. Over half of the world’s calories come from just three crops: wheat, rice, and maize. When including soybean oil, palm oil, sugar, barley, and potatoes, this figure rises to over three-quarters [69]. Some of these crops and their products, such as sugar, white rice, and high fructose corn syrup, are directly linked to obesity and other health issues. Agricultural policies from the latter half of the 20th century, aimed at boosting production to address hunger and malnutrition, favoured these crops.
Additionally, food production and sales heavily rely on disposable plastics, with major UK supermarkets using around 810,000 tonnes of single-use plastic annually [70]. Single-use plastics are also prevalent in the out-of-home food sector.
11. Community engagement
11.1. Community food events
To coincide with the launch of Surrey’s whole system food strategy, Surrey County Council has funded the delivery of 17 community food events between March and November 2024, attracting over 600 local residents. All the events took place in key neighbourhoods across Surrey, focussing on easy to make, healthy and low-cost meals. The events included cookery demonstrations as well the opportunity to try all the dishes and take the recipes home. The feedback from attendees was extremely positive and many went away saying they had learned to make new meals which they would be incorporating into their family routines.
11.2. Raising the profile of healthy eating amongst Early Years settings
The Eat Well Start Well (EWSW) award was developed by Surrey County Council to support Early Years settings in ensuring that the food they offer provides appropriate amounts of energy and nutrients for the children in their care, as well as encouraging children to develop healthy eating habits. Ensuring children are well nourished from an early age has health, educational and behavioural benefits. We also know, as demonstrated in the data earlier in this chapter, that almost one in five children aged four to five years are starting primary school with excess weight. It is therefore important that young children are able to adopt healthy eating patterns before they start school.
The award is open to any setting providing childcare for children up to the age of five years and where at least one hot meal a day is served.
To date, 27 Early Years settings have achieved the award in Surrey with 19 currently undergoing assessment. Surrey County Council Early Years department will be recommending that all new settings consider adopting this award.
The map below shows the uptake of the award across Surrey and the areas of high childhood obesity/deprivation, thus demonstrating where there are gaps in adoption of the award (Figure 47).
Figure 47. Adoption of EWSW award mapped against areas of childhood obesity (including severe obesity) in Reception children (4-5 yrs) – 3 years data combined
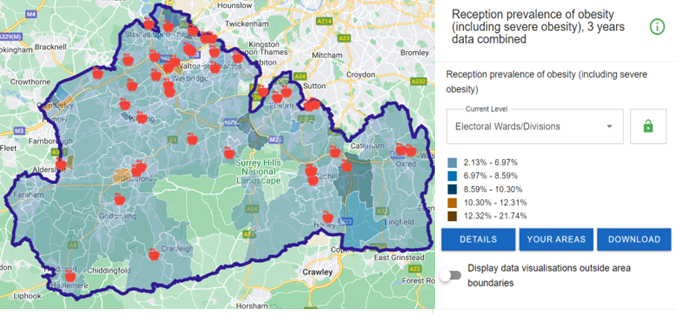
Source: Fingertips | Department of Health and Social Care
12. Weight management services
In Surrey, weight management support is offered through a tiered weight management programme, designed based on NICE guidelines, which are widely adopted nationally:
Tier 1: Universal prevention services
This would include signposting people to further information on websites such as Better Health or Healthier Families or to activities in the community. This may also include a brief conversation with a health professional to talk about the benefits of a healthy diet and suggestions as to how this can be achieved.
Tier 2: Lifestyle multicomponent weight management services A tier 2 lifestyle weight management service is usually offered in the community. There are 3 main components to a tier 2 service, namely:
- Advice and support around healthy eating
- Support to be physically active
- Support around behaviour change
The programme normally comprises 12 weekly sessions where participants either meet face to face or online. Baseline data (including weight status, knowledge of healthy eating, level of physical activity and mental wellbeing status) are collected on Week 1.
Tier 3: Specialist multi-disciplinary weight management services
A tier 3 weight management service is a specialist service offered through the NHS and involves a multi- disciplinary team approach. In Surrey the service (for both adults and children) is offered through Ashford & St Peter’s Hospital.
Tier 4: Bariatric surgery
- Bariatric surgery may be offered to those with a BMI of 40 or more, or BMI of >35 together with a condition that could be improved by weight loss surgery (e.g. hypertension, type 2 diabetes, arthritis, breathing problems, asthma).
- This surgery is rarely offered to children.
Tier 2 services in Surrey are commissioned by Surrey County Council, whereas Tiers 3 and 4 are commissioned by NHS Surrey Heartlands.
The local obesity pathway is currently under review (as of November 2024) to ensure a seamless support offer to patients that is appropriate and fit for need. The pathways have had to be adapted to allow for access to novel medical therapies and understand their place in therapy. It is recognised that capacity in our services is at a limit with demand far-outweighing capacity.
12.1. Weight management services for children under 18 and families
Better Health is the national initiative and universal offer for adults and children providing helpful tips and advice to the general population to maintain a healthy weight.
12.1.1. Tier 2 services for children and young people
Tier 2 level weight management services for children and young people are commissioned by Surrey County Council. The healthy weight programme, Be Your Best, invites children aged 5 to 17 years who are on or above the 91st BMI centile and their families to participate in a healthy weight programme over a period of 12 weeks, focusing on healthy eating, physical activity and behaviour change. At least 70% of the children/young people must be from the following priority groups:
- Families living in the 21 key neighbourhoods
- Children with a special educational need or disability
- Children with a long-term condition
- Children of families on low income [71]
- Children receiving Early Help, Targeted Help or Specialist Support in Surrey [72]
Delivery of the programme began in January 2020, which coincided with the outbreak of COVID-19 in England. The programme delivery model was based mainly on face-to-face interventions which became impossible due to COVID-19 restrictions. Most of the sessions were therefore held online and this initially impacted negatively on uptake of the programme (e.g. families sharing one computer, families not familiar with online technology). The pandemic also caused or exacerbated other issues for many families from the priority groups, such as financial difficulties and mental health problems, which further impacted on their ability to participate in the programme.
Between April 2023 and March 2024, 70 families from the priority groups were referred to the Be Your Best programme and 27 families, who did not meet the priority group criteria, were referred to the universal offer (access to online resources and activities). 61.4% of those receiving the targeted Be Your Best intervention completed the programme.
Families undertaking the BYB programme were from the following priority groups:
- Ethnically diverse communities: 19 (27.1%)
- Deprived postcode: 10 (14.3%)
- Long-term health condition: 2 (2.8%)
- Low-income: 17 (24.3%)
- Special Education Needs and Disabilities (SEND): 10 (14.3%)
[NB: These were the priority groups that formed part of the contract ending March 2024]
The data below show the outcomes at 12 weeks, i.e. at the end of the programme, as well as follow-up data. This covers the period April 2023 to March 2024.
- 73% of children had stabilised BMI at 12 weeks
- 57% of children had reduced BMI at 6-month follow-up
- 66% of children had reduced BMI at 12-month follow-up
- 75% of children who were eating less than 5 portions of fruit or vegetables per day increased their intake
- 59% of parents/carers who were eating less than 5 portions of fruit or vegetables per day increased their intake
- 84.5% of children were active for at least 60 mins per day
- 61% of parents/carers were active for at least 150 mins per week
- 62% of children reduced time spent being sedentary
- 58% of children had improved self-esteem*
- 100% of children had increased knowledge of physical activity (based on CMO guidelines)
- 92% had increased knowledge of healthy eating (i.e. what constitutes a balanced meal)
*NB. median score at baseline was already high
12.1.2. Tier 3 and 4 services for children and young people
There are currently no fully funded Tier 3 and 4 specialist weight management services for children and young people in Surrey. This is recognised as a gap in service provision.
Hubs for severely obese children and young people (complications from excess weight [CEW] clinics) have been set up across the country. In the South East, hubs will be based in Southampton, Portsmouth and Brighton.
Limited funding has been made available from NHS England for 2024/2025 for a 2-year pilot of a small-scale CEW clinic in Surrey Heartlands, which will not fully meet the need for Tier 3 and 4 specialist weight management support, nor it will be sustainable beyond the funding period. There is also a need for a more seamless child weight management services to enable a smoother transition to and from different tiers, based on clinical need and criteria.
The CEW clinic in Surrey is delivered at Ashford & St Peter’s Hospital. Participants must meet all three of the following criteria:
- Obesity
- Significant obesity-related medical comorbidity that would benefit from weight loss, such as:
- Hypertension
- Metabolic liver disease
- Idiopathic intracranial hypertension
- Obstructive sleep apnoea requiring intervention
- Polycystic ovarian disease
- Impaired fasting glucose
- Family wants help to change
Appointments with members of the multi-disciplinary team take place both in the hospital and in the community. The team is comprised of:
- Consultant paediatrician
- Nurse
- Dietitian
- Psychologist
- Family intervention worker
There are currently 185 children aged 4 to 5 years in Surrey who are severely obese, and 290 children aged 10 to 11 years who are severely obese. These figures are based on the number of children who have been measured. Considering the current prevalence rate for both age groups, the number is likely to be higher. The CEW clinic in Surrey has 10 places for children and young people who meet the criteria. There are no outcome data yet as the programme has recently commenced. However, the following data will be collected:
- Physical activity levels
- Sedentary behaviour e.g. screen time
- Age of children
- Parental weight
- Co-morbidities presented in children
- Other risk factors, e.g. children with a learning disability or autism
- Diet information e.g. consumption of fruit and vegetables
- Emotional wellbeing assessment
12.2. Weight management services for adults
12.2.1 Tier 2 weight management services in Surrey commissioned by Public Health
One You Surrey is the free adult (18 years and older) lifestyle service commissioned by Surrey County Council Public Health. The service offers a range of programmes such as Slimming World, Gloji Groups and Man v Fat that are delivered online or in the community to support adults with a BMI greater than 30, or greater than 27.5 if they are from a Black, Asian and Minority community.
Thrive Tribe received 7,567 referrals during 2023/24, of which 67% came from primary care and 32% were digital self-referrals via the website across three key providers sub-contracted by One You Surrey (Gloji, Man v Fat, and Slimming World).
12.2.2 Tier 2 weight management services in Surrey commissioned by the NHS
NHS Digital weight management programme: The NHS Digital Weight Management Programme is provided by NHS England. It supports adults living with obesity who also have a diagnosis of diabetes, hypertension or both, to manage their weight and improve their health. The programme is available for anyone who has a BMI greater than 30, and 27.5 for people from Black, Asian, and minority ethnic backgrounds. To access this, the individual must have a smartphone, tablet, or computer with internet access. The programme involves a 12-week online behavioural and lifestyle programme that people can access via a smartphone or computer with internet access. A new peer reviewed paper, published in The Obesity Journal, shows that 63,937 people were referred to the scheme in its first year with 50% taking up the offer and enrolling onto the service. A total of 14,268 of those then went on to complete the programme (April 2021 to March 2022), with people who completed it losing 3.9kg or 8.59lbs over 12 weeks. More than a third of the referrals were from Black, Asian and minority ethnic backgrounds with the data clearly showing it is helping those from deprived backgrounds, as well as those affected by health inequalities and at a higher risk of adverse outcomes associated with obesity.
In 2023/24, Surrey recorded 2,939 total number of GP referrals to the NHS Digital Weight Management Programme, of which 2,565 were eligible. This equates to 87.27% of referrals being eligible and a 123% success of eligible referrals to the yearly target. Surrey have been allocated the same goal for the 2024/25 financial year. 92% of 104 general practices utilised the programme.
NHS Diabetes Prevention Programme (DPP): Unlike type 1 diabetes, type 2 diabetes is largely preventable through lifestyle changes. The Healthier You NHS Diabetes Prevention Programme, also known as the Healthier You programme, identifies people at risk of developing type 2 diabetes and refers them onto a nine-month, evidence-based lifestyle change programme. The Healthier You programme is available both as a face-to-face group service and as a digital service. When referred into the programme, people are free to choose between the two. This service is free and available across Surrey and nationwide, based on a set of eligibility criteria.
In 2023/24, 49.1% of Surrey individuals with non-diabetic hyperglycaemia were offered a referral to the NHS DPP. 11.7% of referrals were declined.
NHS Type 2 Diabetes Path to Remission Programme (T2DR): The T2DR programme is accessed via GP referral and provides a low calorie, total diet replacement treatment for people who are living with type 2 diabetes and overweight/obesity.
Eligibility:
- Aged 18 – 65 years (and not be pregnant),
- Have a diagnosis of type 2 diabetes within the last 6 years, and
- Have a BMI over 27 kg/m2 (where individuals are from White ethnic groups) or over 25 kg/m2 (where individuals are from Black, Asian and other ethnic groups).
People can discuss their individual circumstances with their GP at their next appointment to find out whether it is suitable for them. The programme is available in person and digitally. General information is also available on the NHS England site: NHS England » NHS Type 2 Diabetes Path to Remission Programme.
Diabetes structured education: The structured education offer is available via referral. It is an online offer for free structured education to help patients learn more about and live well with type 2 diabetes. The programme includes advice about type 2 diabetes, eating well, becoming more active, looking after your mental and physical health, other NHS services and general day-to-day life with diabetes. Referral can be made via GP practice or diabetes service, with a different structured education provider in each Place.
12.3. Specialist weight management services for adults (Tiers 3 and 4)
12.3.1. Tier 3 (replaced by medical pathway in Surrey)
In Surrey, Ashford and St Peter’s Hospitals provide the Specialist Weight Management Service (SWMS). As described above, there is no traditional Tier 3 weight management service in Surrey. Instead, eligible patients (as assessed by a clinician) can access the new obesity treatment medications such as semaglutide (Wegovy) and liraglutide (Saxenda). These drugs have been approved by NICE and there is an evidence base on their effectiveness, however the long-term maintenance of a healthy weight when a patient comes off the medications remains an unknown. Currently, due to supply issues, these drugs are not yet widely available, and Ashford and St Peter’s are working with other NHS partners to supply these medications through a phased approach.
There is also limited capacity within our SWMS to initiate, maintain and provide the multi-disciplinary support for patients wishing to access the medical treatments, resulting in the adoption of the phased in approach for Year 1. Currently there is no specialist weight management service for patients who do not want to be treated by such medications or bariatric surgery and are ineligible for Tier 2. It should be noted that the evidence states that bariatric surgery remains the most effective treatment for patients with a high BMI.
The ambition would be to eventually move the medical management of obesity to the community, ensuring there is adequate capacity, wrap around services to support patients, workforce and assured drug supply. There are currently constraints in each of these elements to allow for this transition of the service. There is ongoing work to review our weight management services and to review the criteria for accessing therapies, aimed at ensuring we have evidence-based step-down pathways and that we are agile as a system to assess novel and emerging therapies.
12.3.2. Tier 4 (surgical pathway)
NHS Surrey Heartlands provide bariatric surgery through Ashford and St. Peter’s Hospital Trust as part of their commissioned weight management service. Bariatric surgery includes procedures that are performed on individuals who are obese. The surgery looks to make changes to the digestive system to help lose weight and is often used for individuals for whom diet and exercise approaches have not been successful, and have serious health problems due to their excess weight. Some of the surgical procedures will limit how much one can eat and some may reduce the body’s ability to absorb certain nutrients.
Thresholds and eligibility
Adults should be considered for a comprehensive assessment by a specialist weight management service to see whether bariatric surgery is suitable for them if they:
- Have a BMI of 35kg/m2 or above, with co-morbidities such as diabetes, high blood pressure, heart disease etc
- Have a BMI of 40 kg/m2 or more with or without any co-morbidities
- Have first attended and completed a specialist weight management course (Tier 3)
- Are able and willing to see our specialists
- Are fit for surgery and anaesthesia
- Understand the need for long term follow up and commitment, both before and for 2 years after surgery.
- Have tried and failed with conventional dieting, exercise, and medication to lose and maintain weight.
Some of the health conditions that improve after bariatric surgery include CVD, hypertension, non-alcohol fatty liver disease, sleep apnoea, and type 2 diabetes.
Surrey has one of the highest rates of bariatric surgery (per 100,000 ICB residence) in England. It ranked seventh nationally in the 2021/22 National Obesity Audit (Figure 48)
Figure 48. Bariatric surgery (per 100,000 ICB residence)
Source: National Obesity Audit dashboard (Microsoft Power BI) 2021/22
12.3.3. Tier 4 and Bariatric surgery procedures
The most common primary surgical procedure is gastric bands across both NHS Surrey Heartlands and NHS Frimley ICB (Figure 49). You will note by the graphs below that there was a notable dip in bariatric surgery in the year 2020-2021 due to the COVID-19 pandemic. A small number of revision procedures are carried out within Surrey, at Ashford and St. Peter’s Hospital Trust, which relate to addressing complications in previous surgeries within patients.
Figure 49. Bariatric surgery by Surrey ICBs (2021/22)
Age distribution of bariatric procedures
Over half of all bariatric surgery procedures across NHS Surrey Heartlands and NHS Frimley ICB, are for individuals aged 45 to 64 years. Whilst bariatric surgery will typically yield less results for older patients, the weight loss older individuals go through and improvement in comorbidities related to their weight is clinically significant. Note that the national average of proportion of bariatric surgeries performed for those aged 55 to 64 years is lower than Surrey and Frimley, which is representative of our older populations (Figure 50).
Figure 50. Age distribution of bariatric surgery by Surrey ICBs (2021/22)
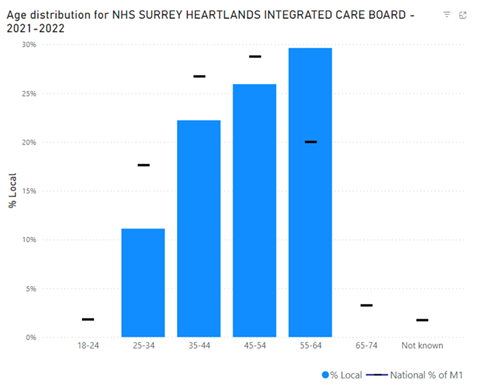
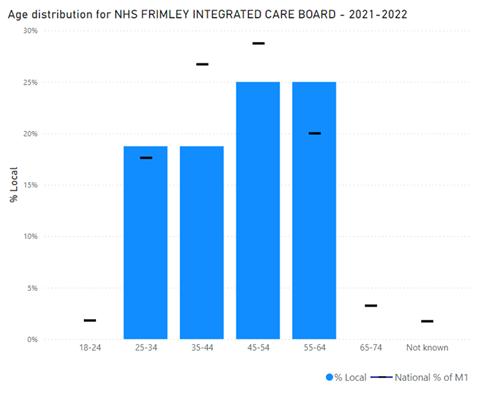
Gender distribution of bariatric procedures
In line with the national data, over 80% of surgeries carried out are in females, despite obesity rates not being representative of this across men and women (Figure 51).
Figure 51. Gender distribution of bariatric surgery by Surrey ICBs (2021/22)
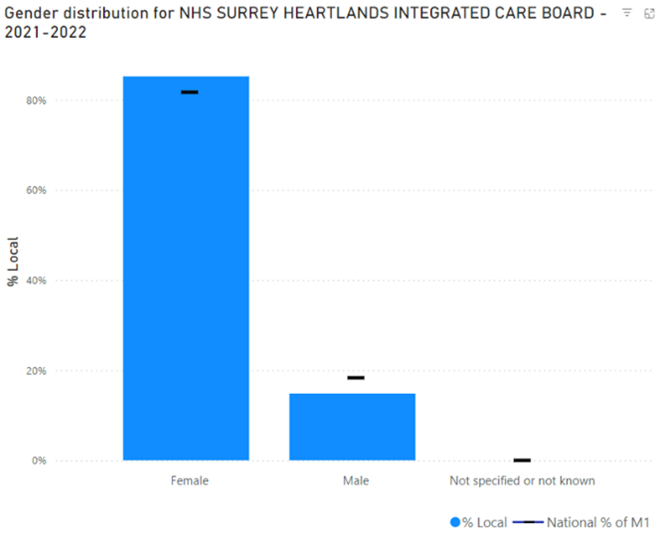
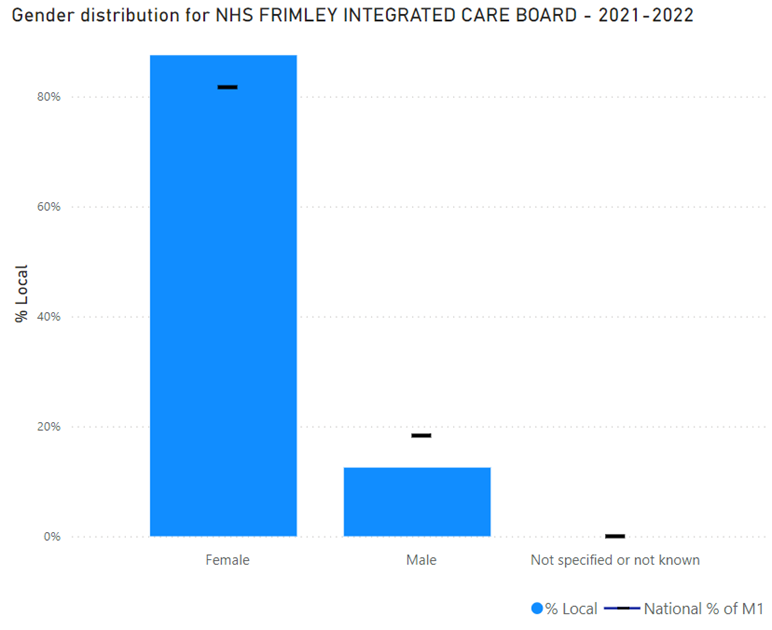
Ethnicity distribution of bariatric procedures
The below figures show a high proportion of bariatric surgeries are carried out on white population groups. There is a high level of unknown ethnicity, in line with national data. We are unable to ascertain if these would represent other ethnic groups but note that the proportion of Asian or Asian British, Black or Black British, Mixed and Other Ethnic Groups are all low for the national datasets (Figure 52).
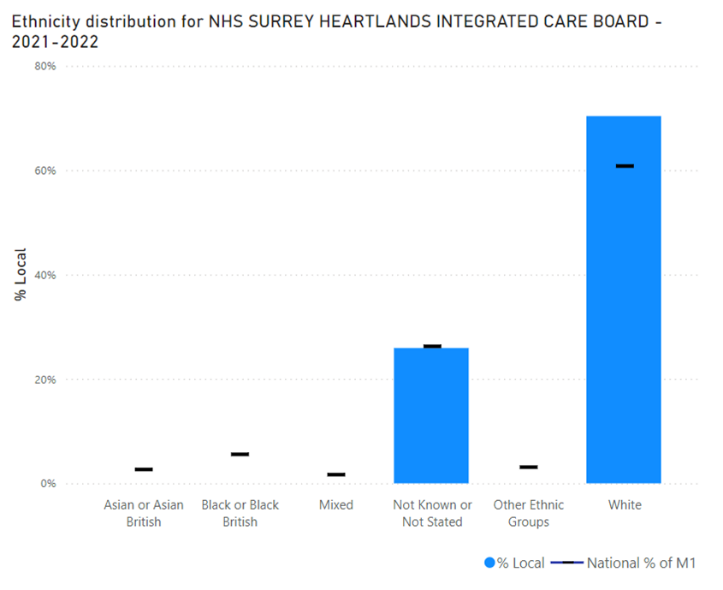
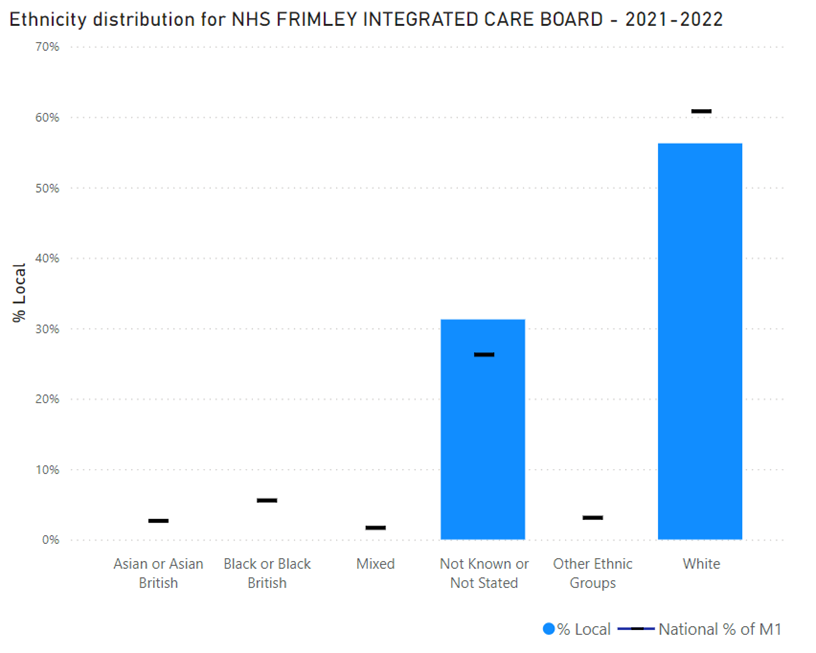
Deprivation distribution of bariatric procedures
The data for both NHS Surrey Heartlands ICB and NHS Frimley ICB show that the majority of procedures are carried out for the least deprived population groups. Many of the deprivation quintiles are not represented, particularly in NHS Frimley, which may be due to the lower overall number (n=55) of surgeries carried out compared to Surrey Heartlands (Figure 53).
Figure 53. Deprivation distribution of bariatric surgery by Surrey ICBs (2021/22)
13. NICE guidelines
- NICE obesity pathways
- Obesity prevention (CG43) is the first national guidance on the prevention of overweight and obesity in adults and children in England and Wales
- Obesity – identification, assessment and management (CG189) is evidence-based advice on the care and treatment of obesity
- Weight management: lifestyle services for overweight or obese adults (PH53) makes recommendations on the provision of effective multi-component lifestyle weight management services for adults who are overweight or obese (aged 18 and over)
- Weight management before, during and after pregnancy (PH27) includes six recommendations based on approaches proven to be effective for the whole population
- Preventing excess weight gain (NG7) includes recommendations for children (post weaning) and adults to support approaches suggested in other NICE guidelines about effective interventions and activities to prevent people becoming overweight or obese
- BMI: preventing ill health and premature death in Black, Asian and other minority ethnic groups (PH46) aims to determine whether lower cut-off points should be used for black, Asian and other minority ethnic groups in the UK as a trigger for lifestyle interventions to prevent conditions such as diabetes, myocardial infarction or stroke
- Obesity: working with local communities (PH42) aims to support effective, sustainable and community-wide action to prevent obesity. It sets out how local communities can achieve this, with support from local organisations and networks
14. Recommendations
Recommendation 1: Improving access to nutritious and affordable food
- Work with schools and stakeholders to explore the role of schools to tackle child poverty, linking with school holiday food provision
- Encourage uptake of the Eat Well Start Well healthy catering award by early years settings across Surrey, with a focus on key neighbourhoods
- Strengthen opportunities for people across Surrey to access healthy affordable food through community growing and supporting local business initiatives and sharing examples of best practice
- Develop evidence-based guidance on catering standards for employers (based on Eat Out Eat Well initiative) in Surrey and promote local businesses to sign up
- Undertake research to understand and inform the design of the initiatives to improve availability of healthy affordable and environmentally friendly food for the local community as well as workforce across the sector
- Review food bank venues (such as hearing loops, ramps) as well as online content to ensure they are more accessible
- Train food bank staff and volunteers to recognise and support clients with a disability and those with mental ill-health.
- Provide tailored Disabled advocacy and support and explore funding solutions for food delivery from food banks (e.g. voluntary non-wheelchair accessible car service) to clients with additional support.
Recommendation 2: Preventing obesity – enabling communities to make healthier food choices to improve health outcomes
- Provide ongoing support with the implementation of Heathy School Standards as part of Surrey Healthy Schools Approach and sharing best practice
- Produce culturally competent information for healthy eating – for example, based on South Asian diet, not English/Western diet
- Develop a resource pack for Health and Social Care professionals on the latest evidence-base, including where/how to signpost/refer patients
- Strengthen the local evidence-base about the impact of food outlets selling food high in fat, salt and sugar on healthy eating behaviours and obesity rates through research, policy and intervention evaluation
- Raise local knowledge and awareness about ultra processed food
- Maximise the role of environmental health officers to support local business to offer healthy food options and food safety training
- Develop and deliver Making Every Contact County (MECC) Food and Health Programme for NHS, Social Care community pharmacies, community links workers, social prescribers
- Explore setting up a network of community-based Food Champions to encourage local communities to take part in social cooking and community growing activities
- Enhance public involvement in co-developing food related community actions through organising a series of Food for Health Road Shows in partnership with Voluntary Community and Faith Sector organisations across Surrey
- Increase the number of campaigns promoting healthy eating and Sugar Smart approaches across Surrey
Recommendation 3: Enhancing the effectiveness and equity of local healthy weight management services
- Complete a review of the current weight management service to optimise a pathway across primary, secondary and tertiary prevention of obesity to reflect both clinical and individual support for both adults and children. Also to ensure there is a seamless pathway in place to support a smooth transition from childrens to adults services.
- Work with our partners who are offering support to adults with adverse childhood experiences to develop an integrated approach to include weight management support and advice
- Allocate resource to commission a multidisciplinary specialist weight management service (which includes psychological support) for complex individuals with a BMI of 30 and above who do not want to be treated by the new obesity medications and respond to emotional and addictive behaviours related to weight
- Ensure that access to novel weight loss medication is available to those most in need equitably across Surrey
- Improve the accessibility of lifestyle services including physical activity across the life course to support children maintain a healthy weight, particularly targeting these living in Surrey key neighbourhood area
- Increase uptake of Health Checks for people within high-risk groups including those with Severe Mental Illness and learning difficulties
- Pilot and evaluate different models of delivering Tier 2 weight management service to add to evidence-base and improve service effectiveness and quality
Recommendation 4: Addressing food inequalities and preventing food insecurity with focus on families with young children, pregnant women, those with limited financial resources and those with a disability
- Increase accessibility to healthy and nutritious food for people with a disability, those from ethnic minority backgrounds, older people, families with young children via food banks and community fridges
- Review the provision of food in settings housing asylum seekers and migrants to ensure healthy options and cooking facilities are available, particularly for those with young children
- Reduce stigma, build sustainability and reduce reliance on food banks by encouraging Districts and Boroughs to promote the use of innovative solutions to deliver community food growing using allotments, development of more pantries and social eating activities
- Undertake research to assess and report on food insecurity to identify households most affected
- Undertake research to better understand the impact of food insecurity on older people, young children and those with a disability
Recommendation 5: Enhancing sustainability of the local food system
- Develop training programme to support people across all ages to set up food growing projects
- Create guidelines for local authority procurement of food to be sustainable and sourced from local producers by default based on Government Buying Standard for food and catering services
- Encourage provision of space for community gardens in new developments, and protect existing allotment sites
- Ensure school meals are healthy and sustainable, using the Soil Association gold award as a guide
- Reduce food waste through training and education
- Work with national government to promote a shift towards lower meat and dairy consumption, to achieve the net zero target
- Use our public-facing platforms to share information on low-carbon dietary choices
Recommendation 6: Developing policy-based interventions
- Make representations to the Advertising Standards Authority (ASA) for increased controls in national policy for advertising food high in fat, salt and sugar
- Develop policies to restrict the number of new premises offering food high in fat, salt and sugar as part of spatial planning underpinned by the use of Health Impact Assessment.
- Encourage business owners of food shops within 500 meters walking distance of a primary and secondary school to reduce selling food high in fat, salt and sugar
- Restrict opening hours of fast-food takeaways selling food high in fat, salt and sugar within 500 meters of a primary or a secondary school during term time before and after school finishes
- Develop and implement a land management policy to embed nature-based solutions, community action and new technology alongside financial sustainability into land management and decision-making. It will be more resilient to climate change, be net zero and have a strong local community with growing biodiversity.
15. Acknowledgements
Project supervisor/lead author: Negin Sarafraz-Shekary
Contributing authors: Jenn Smith, Jane Semo, Will King
We would also like to acknowledge the contributions of the members of the Surrey Food Partnership
16. References
[1] Government food strategy – GOV.UK (www.gov.uk)
[2] Recipe for health: a plan to fix our broken food system
[3] Food and Agriculture Organisation of the United Nations – Hunger and food insecurity
[4] NHS Confederation – Why preventing food insecurity will support the NHS and save lives
[5] United Kingdom Food Security Report 2021: Theme 4: Food Security at Household Level – GOV.UK
[6] Hunger in the UK | Trussell
[7] Wider Determinants of Health – Data | Fingertips | Department of Health and Social Care
[8] Cost of Living Crisis – Surrey Coalition of Disabled People
[9] United Kingdom Food Security Report 2024: Introduction – GOV.UK
[10] Hunger in the UK, Hunger in the UK | Trussell
[11] Government food strategy – GOV.UK
[12] Department for Education – Free School Meals Guidance
[13] Policy in Practice | Benefits calculator, Data analytics for local gov
[14] Institute for Government. 2023. Tackling obesity. Improving policy making on food and health. Henry Dimbleby. 2022. The National Food Strategy
[15] 1 Cole TJ, Freeman JV, Preece MA. Body mass index reference curves for the UK, 1990. Archives of Disease in Childhood 1995 73:25-29
[16] Adult overweight and obesity – NHS England Digital
[17] Health Survey for England, 2021: Data tables – NHS England Digital
[18] Luppino FS et al., Overweight, Obesity and Depression: A Systematic Review and Meta-Analysis of Longitudinal Studies, Archives of General Psychiatry 2010; 67(3):220-9)
[19] Caird J et al., Childhood Obesity and Educational Attainment: A Systematic Review, Evidence for Policy & Practice Information Centre (EPPI)-Centre, Social Science Research Unit, Institute of Education, University of London, 2011
[20] Time to Solve Childhood Obesity
[21] The Food Foundation – Nourishing children early years
[22] Child hospital admissions caused by decay going unchallenged
[23] Health matters: child dental health – GOV.UK
[24] National Diabetes Audit (NDA) reports | Diabetes UK
[25] Causal relationships between adiposity and childhood asthma: bi-directional Mendelian Randomization analysis – PubMed
[26] Estimating population attributable fractions to quantify the health burden of obesity – PMC
[27] Cheung CRLH, Kelly DA. Non-alcoholic fatty liver disease in children. BMJ. 2011;343(jul18 1):d4460. doi:10.1136/bmj.d4460
[28] Sharma V, Coleman S, Nixon J, et al. A systematic review and meta-analysis estimating the population prevalence of comorbidities in children and adolescents aged 5 to 18 years. Obes Rev. July 2019:obr.12904. doi:10.1111/obr.12904
[29] Office for Health Improvement and Disparities. 2022. Adult obesity: applying All Our Health.
[30] Diabetes UK. 2021. Treatment of adult obesity position statement: September 2021
[31] National Diabetes Audit dashboards – NHS England Digital
[32] National Diabetes Audit – Young People with Type 2 Diabetes dashboard
[33] Diabetes – Data | Fingertips | Department of Health and Social Care
[34] National Diabetes Audit (NDA) 2023-24 quarterly report for England, Integrated Care Board (ICB), Primary Care Network (PCN) and GP practice – NHS England Digital
[35] Cancer Research UK. 2023. How does obesity cause cancer
[36] Ma, Y., Ajnakina, O., Steptoe, A. and Cadar, D., 2020. Higher risk of dementia in English older individuals who are overweight or obese. International journal of epidemiology, 49(4), pp.1353-1365
[37] The costs of obesity – an update | Institute for Fiscal Studies
[38] Source: House of Lords Library, Impact of ultra-processed food on children’s health , InFocus , 9 October 2023— citing Food and Agriculture Organisation (FAO) of the United Nations (UN), Ultra-processed foods, diet quality and human health using the NOVA classification system (2019), pp 13–14: Ultra-processed foods, diet quality and human health [accessed 20 September 2024]
[39] Written evidence from Scientific Advisory Committee On Nutrition (SACN) – Written Evidence (FDO0014)
[40] Food, Diet and Obesity Committee – Corrected oral evidence: Food, diet and obesity (07/03/2024)
[41] Food, Diet and Obesity Committee – Corrected oral evidence: Food, diet and obesity (22/02/2024)
[42] The Ultra-Processed Food Content of School Meals and Packed Lunches in the United Kingdom – PubMed
[43] Part 6: Diet – NHS England Digital
[44] BAPEN – Malnutrition and Nutritional Care Survey in Adults
[45] Key priorities for implementation | Nutrition support for adults: oral nutrition support, enteral tube feeding and parenteral nutrition | Guidance | NICE
[46] Key priorities for implementation | Nutrition support for adults: oral nutrition support, enteral tube feeding and parenteral nutrition | Guidance | NICE
[47] What is the scale of malnutrition in the UK? | BAPEN
[48] BAPEN – Malnutrition and Nutritional Care Survey in Adults
[49] BAPEN – The cost of malnutrition in England and potential cost savings from nutritional interventions (short version)
[51] Global inequalities in the double burden of malnutrition and associations with globalisation: a multilevel analysis of Demographic and Health Surveys from 55 low-income and middle-income countries, 1992–2018 – The Lancet Global Health
[52] Club4 Impact Report 2023 – Holiday, Activity and Food Programme in Surrey
[53] E-food Desert Index | CDRC Data
[54] Fast food outlets: density by local authority in England – GOV.UK
[55] Food, Diet and Obesity Committee – Corrected oral evidence: Food, diet and obesity (14/03/2024)
[56] Proposed reforms to the National Planning Policy Framework and other changes to the planning system – GOV.UK
[57] Food Foundation – Written Evidence
[58] The Broken Plate | Food Foundation
[59] Halford JC et al. (2007). Beyond-brand effect of television (TV) food advertisements/commercials, in Public Health Nutrition 11(9):897-90
[60] Halford JC, Gillespie J, Brown V, Pontin EE, Dovey TM. (2004). Effect of television advertisements for foods on food consumption in children. Appetite. Apr 1;42(2):221-
[61] Hastings G, Stead M, McDermott L, Forsyth A, MacKintosh AM, Rayner M, Godfrey C, Caraher M, Angus K. (2003). Review of research on the effects of food promotion to children. London: Food Standards Agency. Sep 22
[62] Zimmerman FJ, Shimoga SV. The effects of food advertising and cognitive load on food choices. BMC Public Health. 2014 Dec;14(1):342
[63] Harris JL, Bargh JA, Brownell KD. Priming effects of television food advertising on eating behavior. Health psychology. 2009 Jul;28(4):404
[64] Koordeman R, Anschutz DJ, van Baaren RB, Engels RC. Exposure to soda commercials affects sugar-sweetened soda consumption in young women. An observational experimental study. Appetite. 2010 Jun 1;54(3):619-22
[65] Adfree Cities – Written Evidence
[66] Turning the Tide Strategy – Obesity Health Alliance
[67] Lucas T, Horton R. The 21st-century great food transformation. Lancet (London, England). 2019;393(10170):386-387. doi:10.1016/S0140- 6736(18)33179-9
[68] Edwards P, Roberts I. Population adiposity and climate change. Int J Epidemiol. 2009;38(4):1137-1140. doi:10.1093/ije/dyp172
[69] Bahadur ID KK, Dias GM, Veeramani A, et al. When too much isn’t enough: Does current food production meet global nutritional needs? 2018. doi:10.1371/journal. pone.0205683
[70] Environmental Investigation Agency, Greenpeace. Checking Out On Plastics. A survey of UK supermarkets’ plastic habits. 2018.
[71] low income is classed as living on less than 60% of median net disposal income in UK
[72] Surrey Safeguarding Children Partnership – Effective family resilience