
Place Packs – Surrey Downs
Place Packs – Surrey Downs
Date produced: 17/12/2024
Contents
Demographics
Population pyramid
In Surrey Downs, the total population is 315,695 with a median age of 44 years. This median age is 2 years older compared to Surrey and 5 years older compared to England.
- The population of Surrey Downs is ageing.
- 27.1% of Surrey Downs’s residents are over the age of 60, which is a difference of +2.4% if compared to Surrey and a difference of +3.4% if compared to England.
- 1.3% are over the age of 90, a difference of +0.2% if compared against Surrey and a difference of +0.4% if compared against England.
- Most patients aged 90+ are female.
- There are 2683 female patients aged 90 and over in Surrey Downs, which is 1.9 times greater than the number of males (1397).
- The number of males and females below 25 is roughly similar.
Population pyramid of Surrey Downs
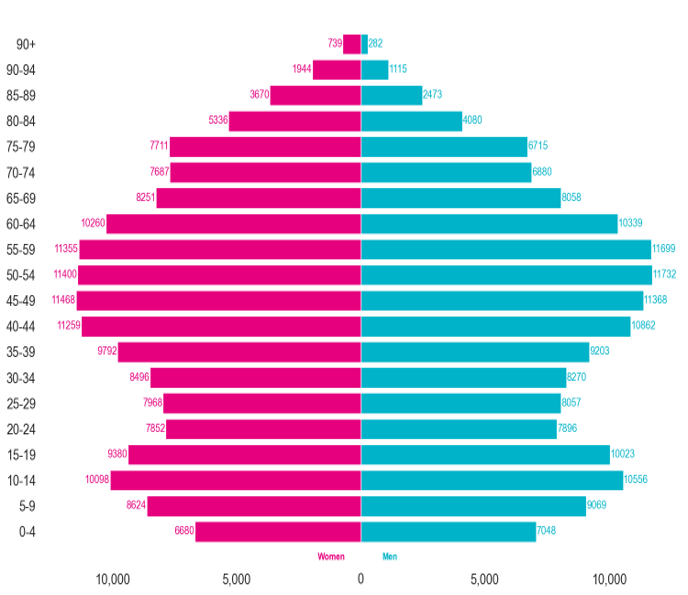
Data Source: ONS Census 2021
Sex and age by health status
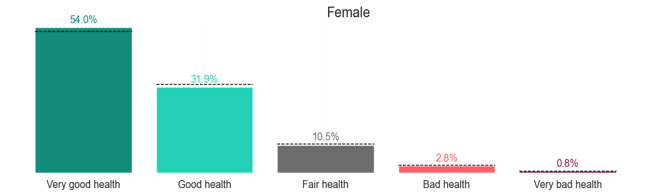
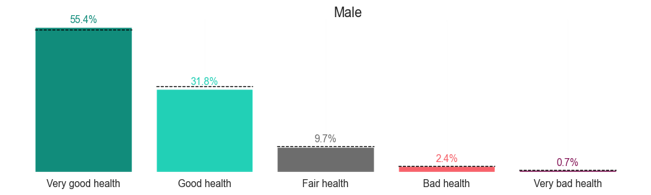
In Surrey Downs, there was no difference between males and females in reporting ‘very good health’.
- The number of males in ‘very good health’ is 1.4% higher than for females.
- The number of females in ‘very bad health’ is 0.1% higher than for males.
- The number of people in “very bad health” increases with age.
Health status for females in Surrey Downs
Health status for males in Surrey Downs
Health status by age in Surrey Downs
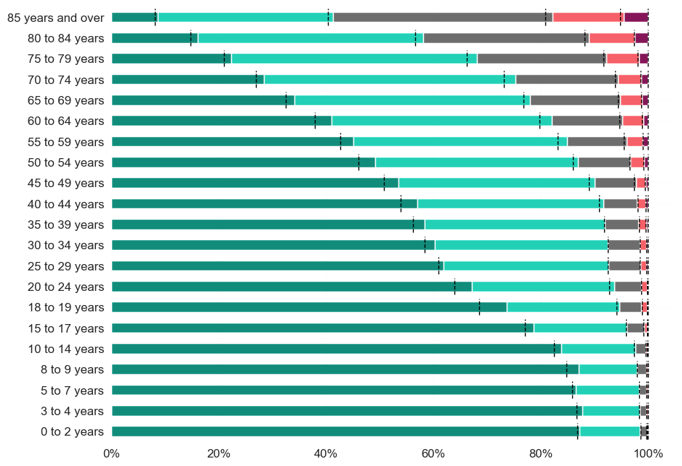
From left to right, the bars are “Very good health”, “Good health”, “Fair health”, “Bad health”, and “Very bad health”.
Data Source: ONS Census 2021
Index of multiple deprivation
Surrey Downs is the second most populated place in Surrey with an Index of multiple deprivation score of 9.
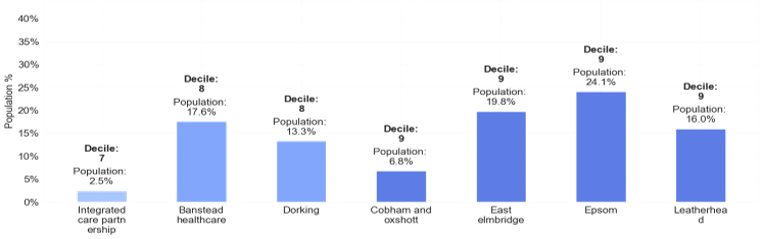
- The highest percentage of Surrey Downs’s registered patients, 24.1%, reside in Epsom (Decile 9), while the smallest percentage, 2.5%, lives in Integrated Care Partnership (Decile 7).
- 2.5% of Surrey Downs’s registered patients live in Decile 7 PCNs, 30.9% in Decile 8 and 66.7% in Decile 9 PCNs.
IMD Decile and Population by Place
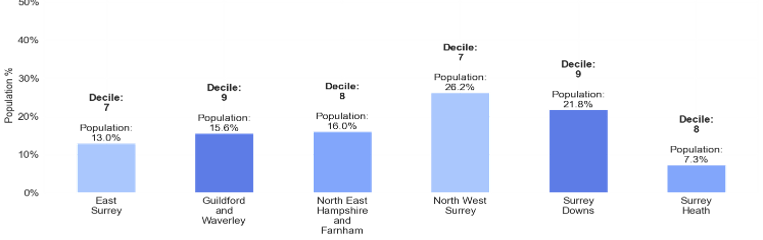
IMD Decile and Population by PCN in Surrey Downs
IMD Score by PCN in Surrey Downs
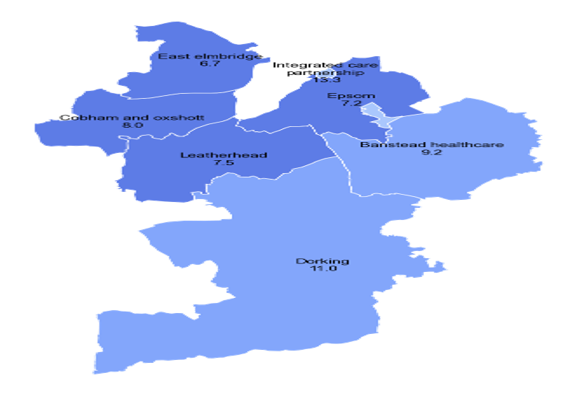

Based on the English IMDs from 2019. Deciles have been aggregated up to PCN and Place using population weighted scores.
Data Source: ONS
Index of multiple deprivation and health status
In Surrey Downs, the higher IMD Decile, the more people report ‘very good health’.
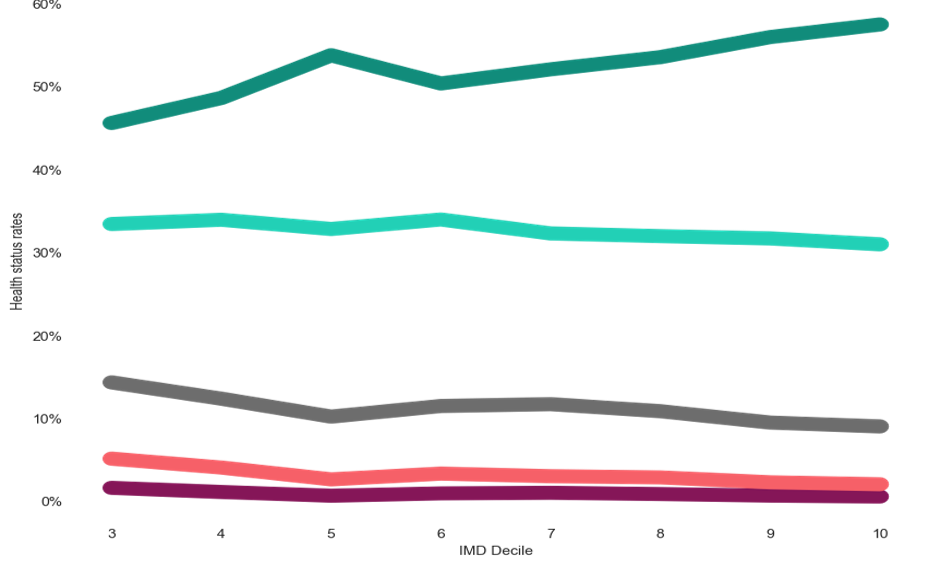
From top to bottom, the bars are “Very good health”, “Good health”, “Fair health”, “Bad health”, and “Very bad health”.
Data Source: ONS
Ethnicity
The largest ethnic group in Surrey Downs was the white grouping at 86.42%.
- Integrated care partnership has the highest diversity of populations, with 20.41% of non-white ethnicities.
Ethnicity demographics in Surrey Downs
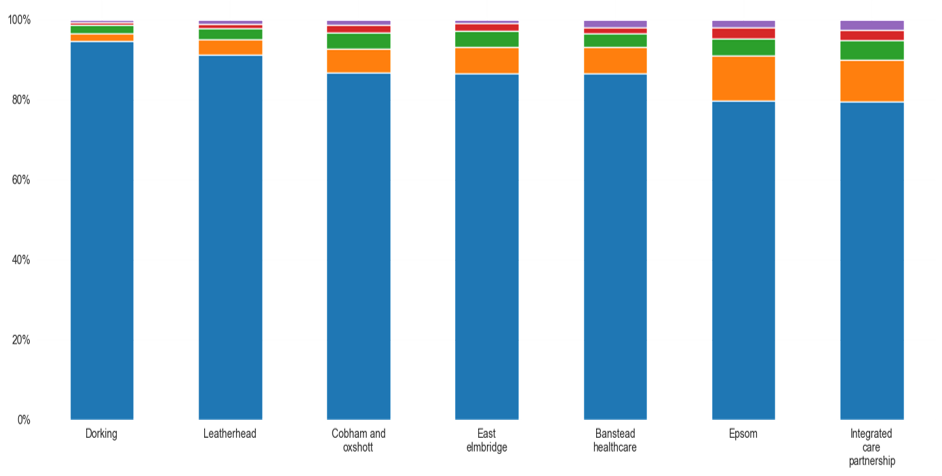
From top to bottom, the bars are “Black, Black British, Black Welsh, Caribbean or African”, “Other ethnic group”, “Mixed or Multiple ethnic groups”, “Asian, Asian British or Asian Welsh”, and “White”.
Data Source: ONS Census 2021
Ethnicity and health status
In Surrey Downs the mixed or multiple ethnic groups ethnicity reported the highest proportion of ‘very good health’ at 70.1%.
- The other ethnic group ethnicity reported the highest proportion of ‘very bad health’ at 0.8%.
Health status by ethnicity in Surrey Downs
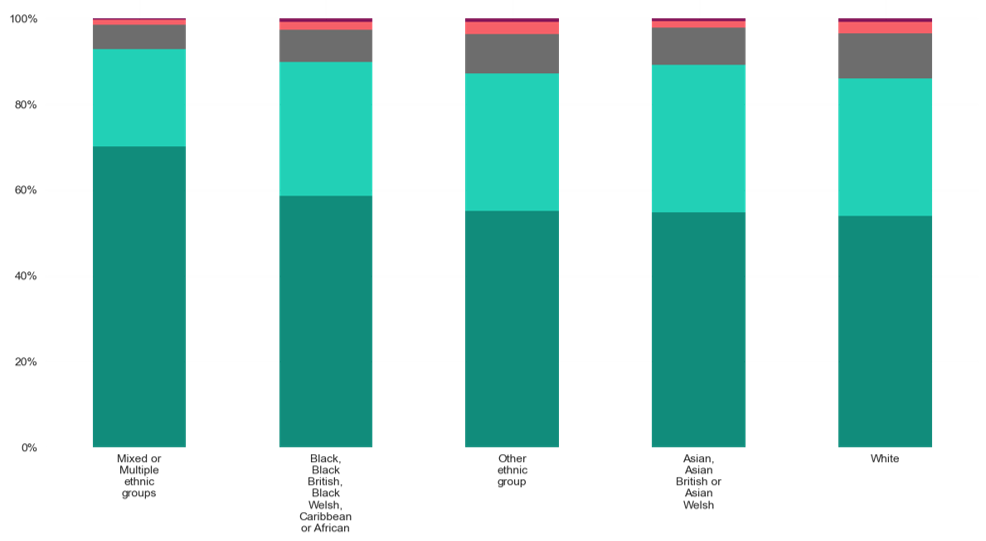
From top to bottom, the bars are “Very good health”, “Good health”, “Fair health”, “Bad health”, and “Very bad health”.
Data Source: ONS Census 2021
In Surrey Downs, the ‘White’ (1.7%) group of people reported a lower rate of ‘bad/very bad health’ compared to Surrey (1.8%).
Bad/very bad health status in Surrey Downs
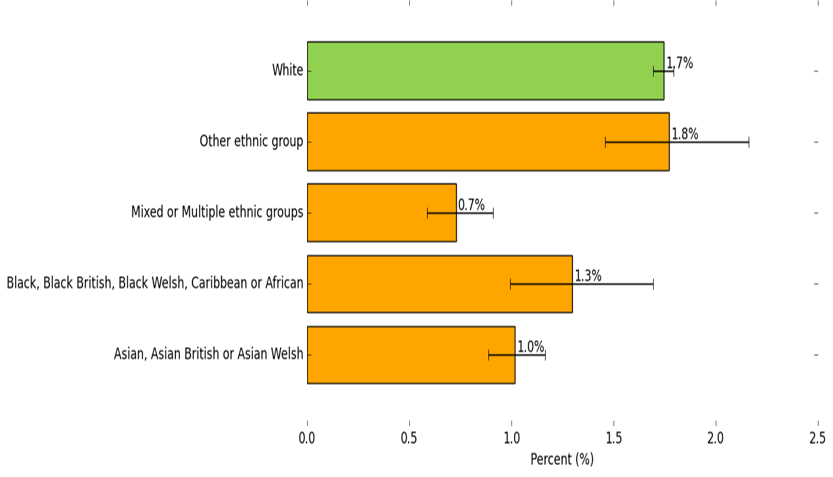
The ‘White’ group is performing better than the Surrey average. All the other groups are performing similar to the Surrey average.

Data Source: ONS Census 2021
Note: These are benchmarked against the Surrey average
Proficiency in English
In Surrey Downs, 0.77% of people reported ‘limited English proficiency’, which is similar to the Surrey value of 1.04%.
- No PCNs have reported a ‘limited English proficiency’ value above the Surrey average.
Proficiency in English by Place
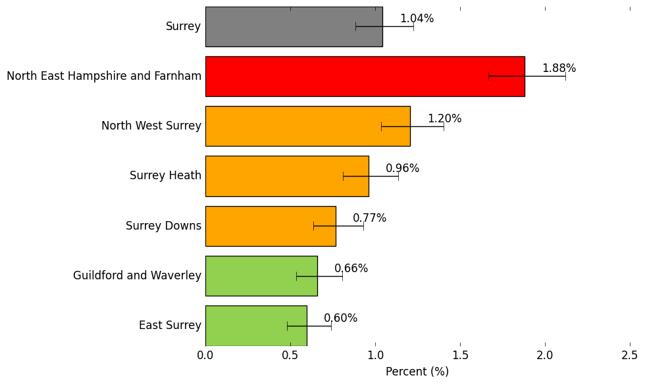
North East Hampshire and Farnham is performing worse than the Surrey average. North West Surrey, Surrey Heath, and Surrey Downs are performing similar to the Surrey average. Guildford and Waverley and East Surrey are performing better than the Surrey average.
Proficiency in English by PCN in Surrey Downs
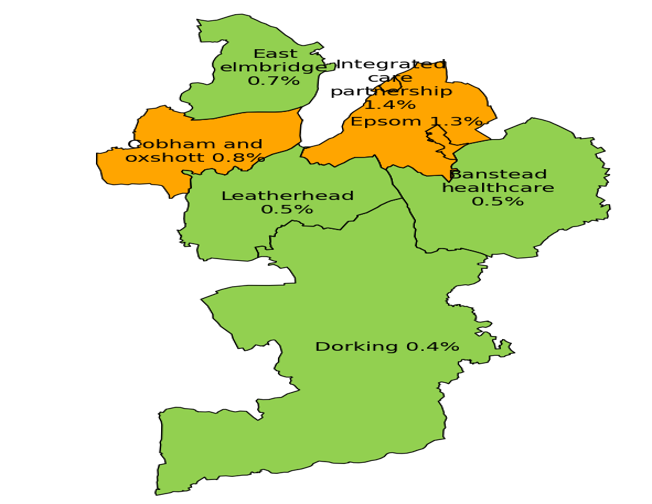
Integrated Care Partnership, Epsom, and Cobham and Oxshott are performing similar to the Surrey average. East Elmbridge, Leatherhead, Banstead Healthcare, and Dorking are performing better than the Surrey average.

Data Source: ONS Census 2021
Note: These are benchmarked against the Surrey average.
Proficiency in English and health status
In Surrey Downs people who reported being ‘fluent in English’ also reported the highest proportion of ‘good health’ at 90.8%.
People who reported ‘limited English’ also reported the highest proportion of ‘not good health’ at 10.3%.
Health status by proficiency in English
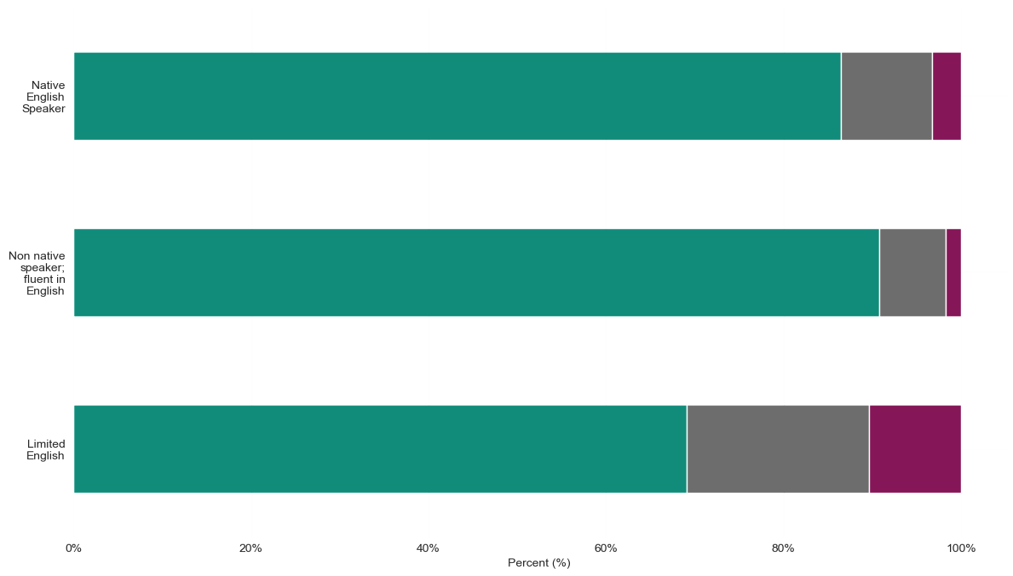
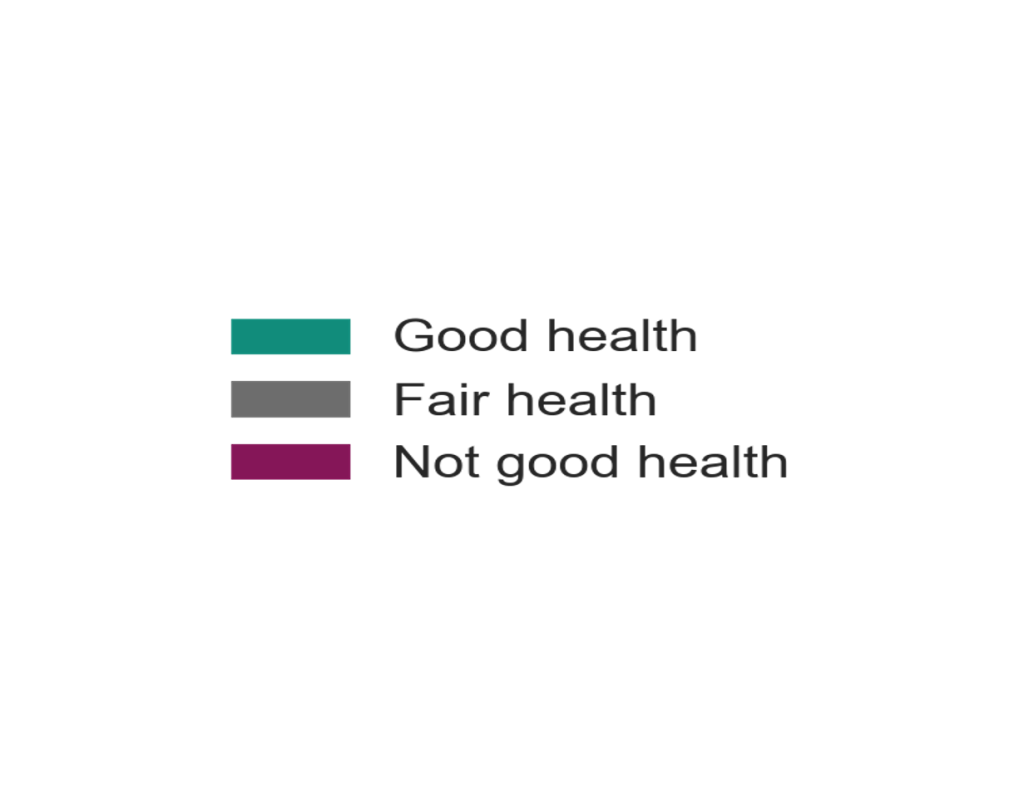
From left to right, the bars are good health, fair health, and not good health.
Data Source: ONS Census 2021
Religion
In Surrey Downs, 51.09% of the population adheres to Christianity, making it the most prevalent religion.
Religion in Surrey Downs
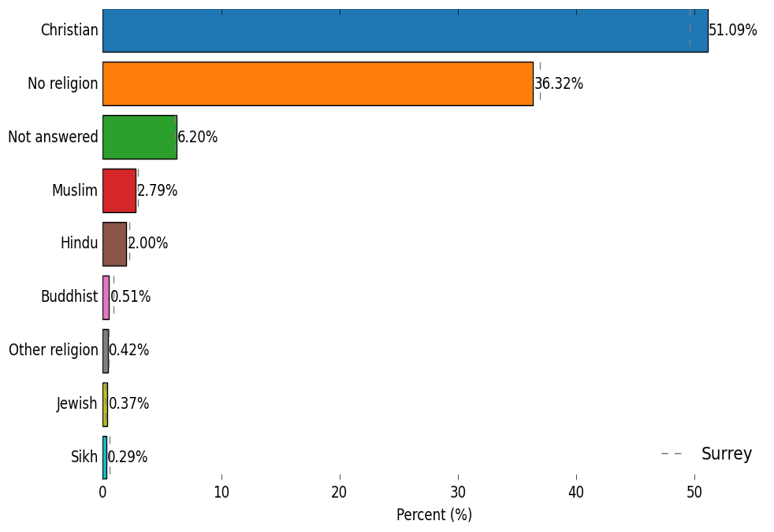
Data Source: ONS Census 2021
Qualifications
Level of qualification
In Surrey Downs, 36.5% of the population holds a level 4 qualification or above.
Level of qualification in Surrey Downs
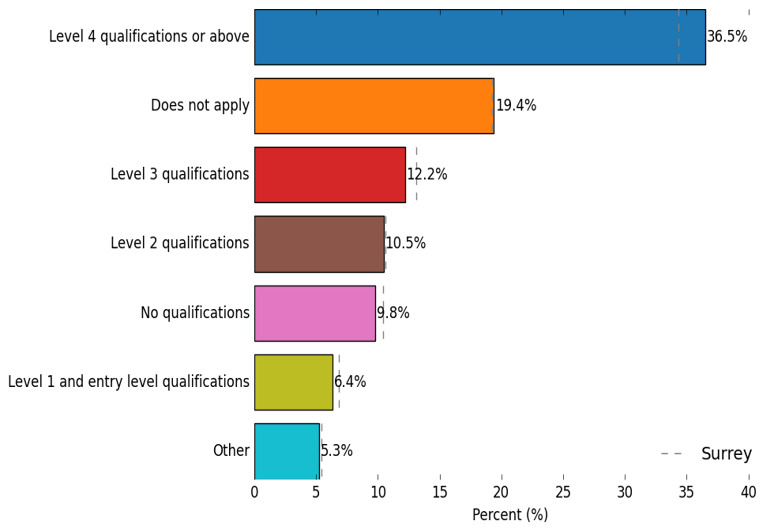
Data Source: ONS Census 2021
Work
Economically active
- In Surrey Downs, 62.12% reported being economically active, which is lower than Surrey’s value of 64.14%.
- Banstead healthcare (59.8%), Cobham and Oxshott (57.4%), Dorking (61.5%) and Leatherhead (59.7%) reported a lower rate than the Surrey average.
Economically active by Place
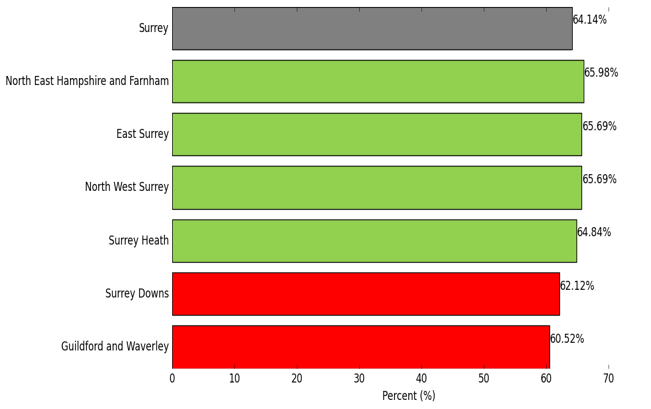
North East Hampshire and Farnham, East Surrey, North West Surrey, and Surrey Heath are performing better than the Surrey average. Surrey Downs and Guildford and Waverley are performing worse than the Surrey average.
Economically active by PCN in Surrey Downs
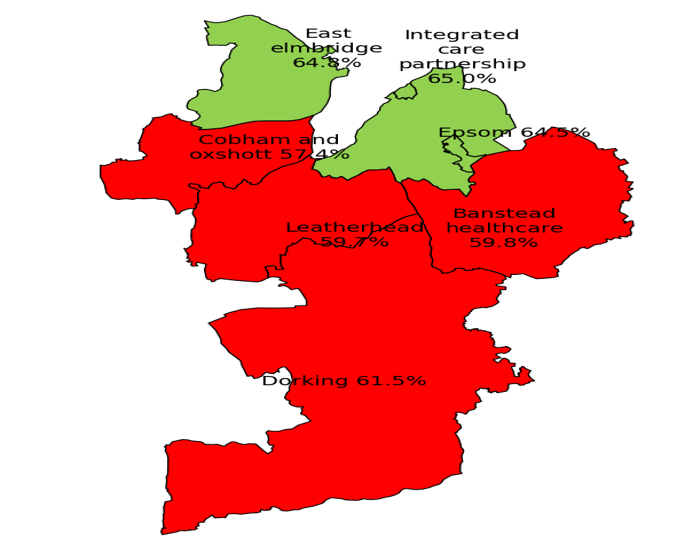
Integrated Care Partnership, Epsom, and East Elmbridge are performing better than the Surrey average. Cobham and Oxshott, Leatherhead, Banstead Healthcare, and Dorking are performing worse than the Surrey average.

Data Source: ONS Census 2021
Note: These are benchmarked against the Surrey average.
Occupation
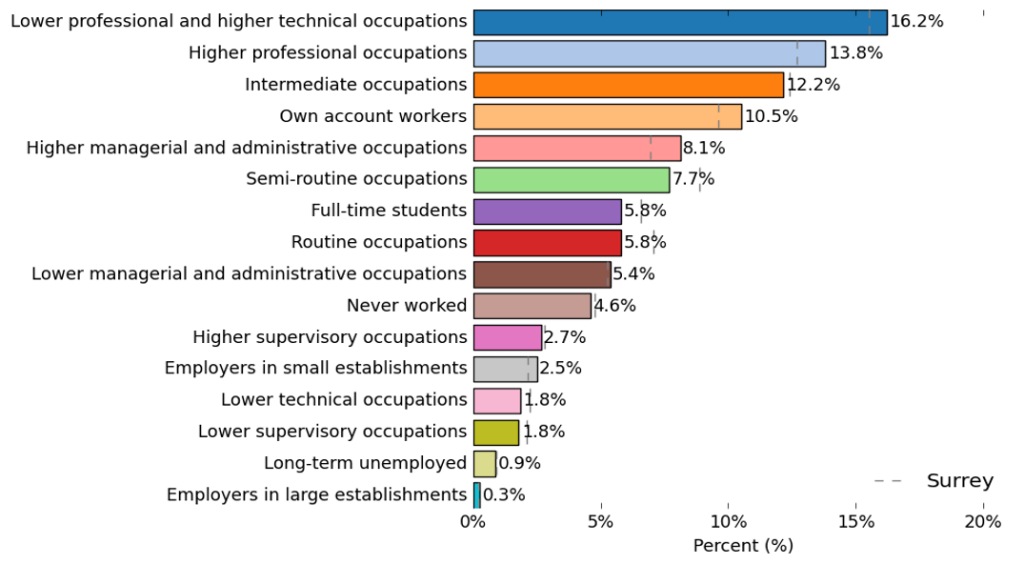
- In Surrey Downs, 16.2% of people work in lower professional and higher technical occupations, making it the most prevalent occupation.
Occupations in Surrey Downs
Data Source: ONS Source 2021
Occupation and health status
- In Surrey Downs people who reported being ‘full-time students’ also reported the highest proportion of ‘good health’ at 95.0%.
- People who reported ‘never worked’ reported the highest proportion of ‘not good health’ at 13.3%.
Health status by occupation
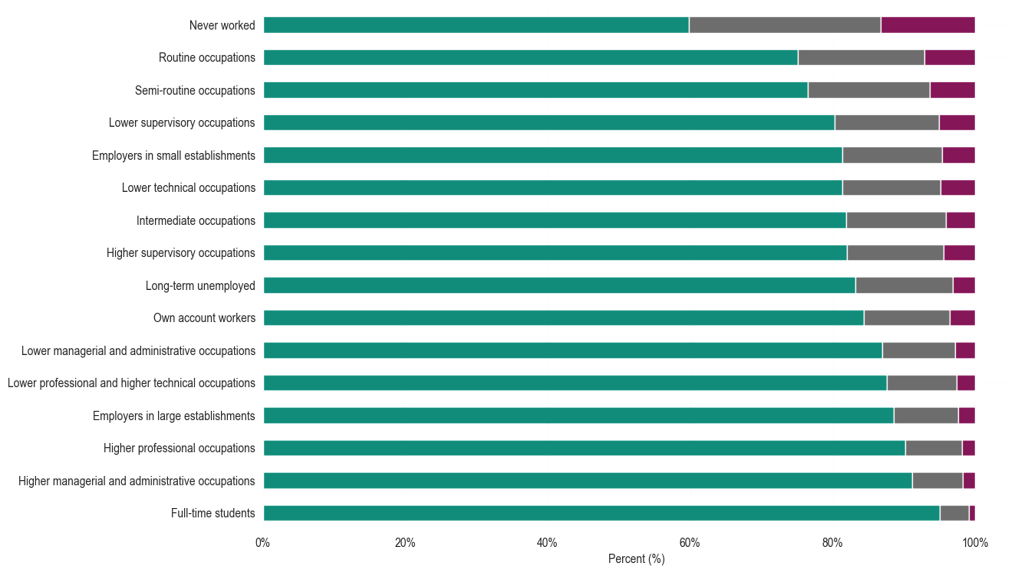
From left to right, the bars are “Good health”, “Fair health”, and “Not good health”.
Data Source: ONS Census 2021
Economic activity and proficiency in English
- In Surrey Downs, most of the people who reported being ‘non native speaker; fluent in English’ also reported being economically active and employed at 70.1%.
- Most of the people who reported ‘limited English’ also reported being economically inactive at 49.1%.
Economic activity by English proficiency
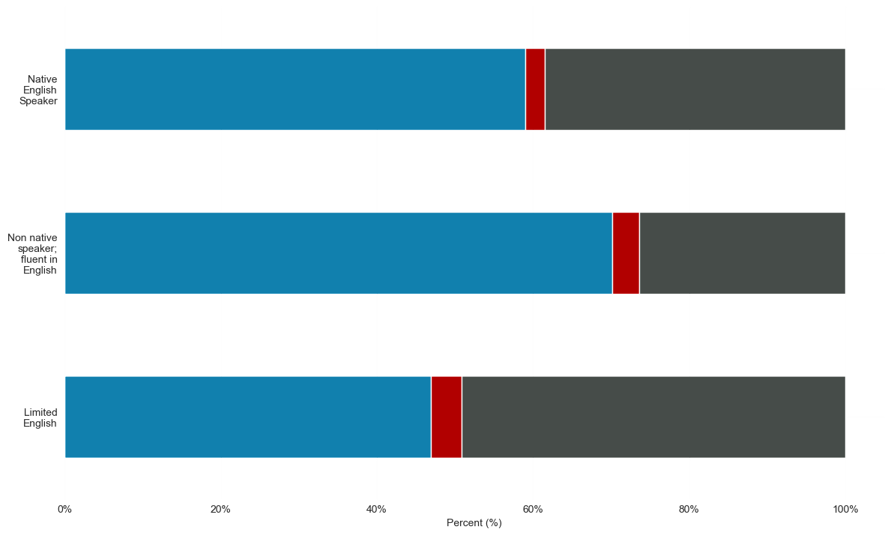
From left to right, the bars are “Economically active: employed”, “Economically active: unemployed”, and “Economically inactive”.
Data Source: ONS Census 2021
Economically inactive and health status
- In Surrey Downs, 3.31% of economically inactive people reported ‘not good health’ status, which is similar to the Surrey value of 3.41%.
- Dorking (3.8%) reported a higher rate than the Surrey average.
Economically active reporting a ‘not good health’ status by Place
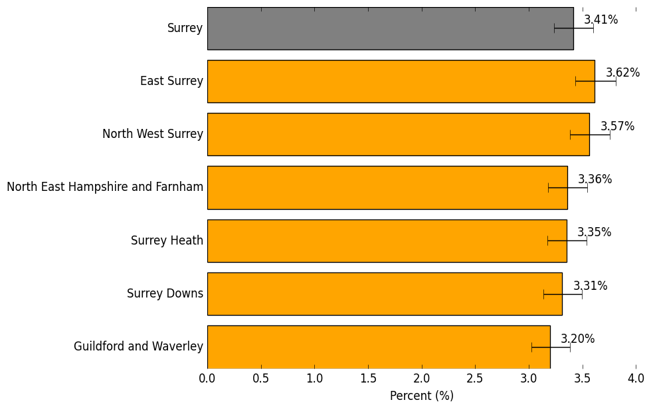
All Places are performing similar to the Surrey average.
Economically active reporting a ‘not good health’ status by PCN
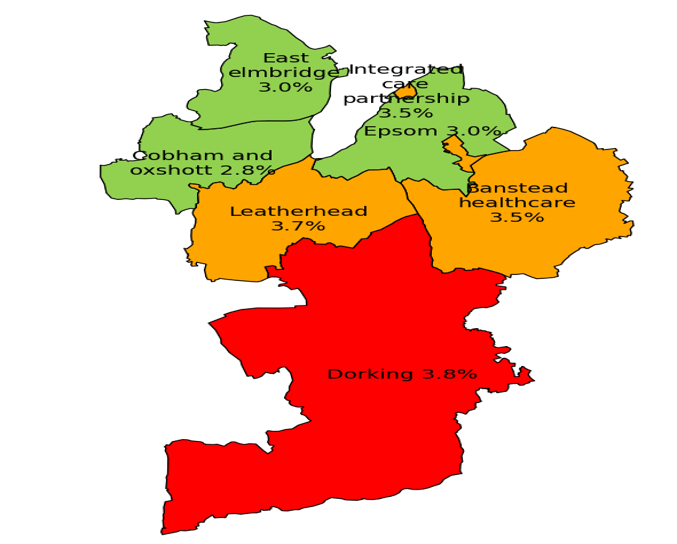
East Elmbridge, Epsom, and Cobham and Oxshott are performing better than the Surrey average. Integrated Care Partnership, Leatherhead, and Banstead Healthcare are performing similar to the Surrey average. Dorking is performing worse than the Surrey average.

Data Source: ONS Census 2021
Note: these are benchmarked against the Surrey average
Travel to work
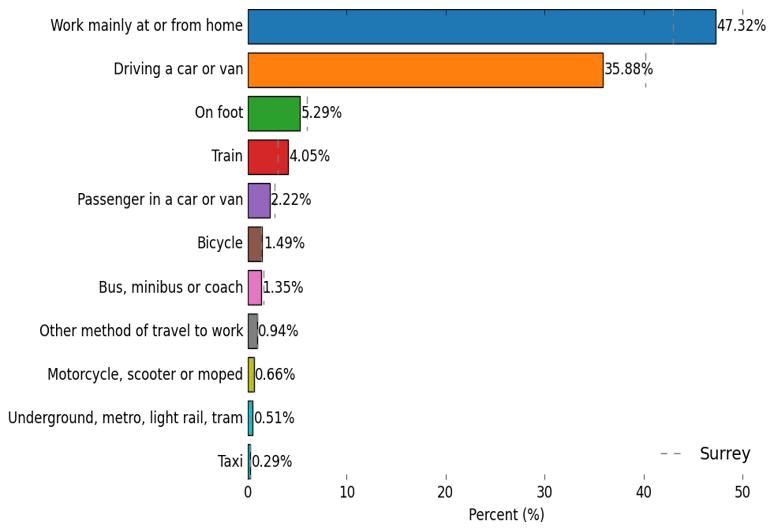
In Surrey Downs, 47.32% of the population doesn’t travel to work.
Travelling to work in Surrey Downs
Data Source: ONS Census 2021
Mental Health
Social Emotional and Mental Health Needs – All Pupils
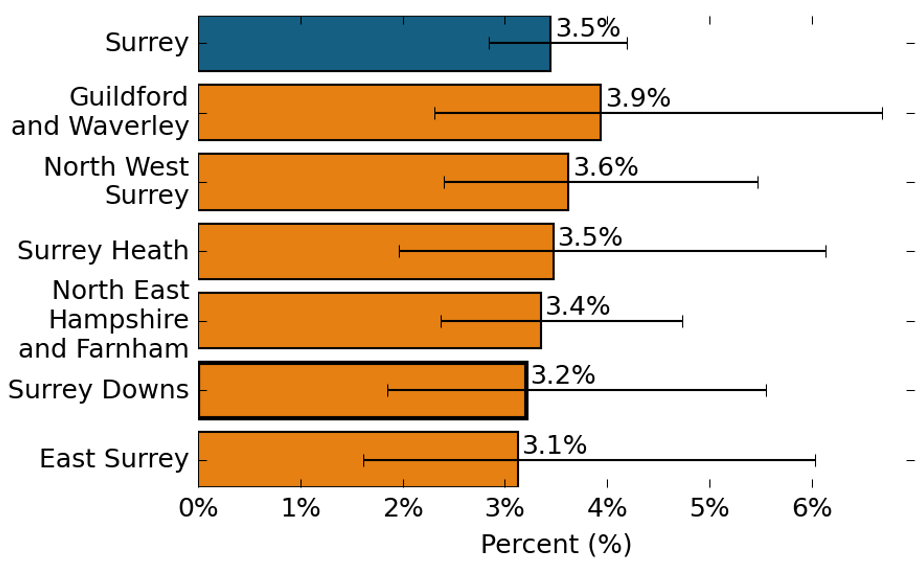
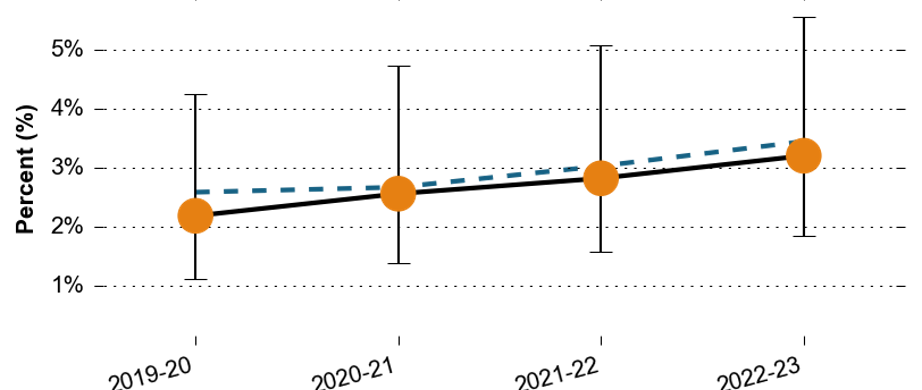
In Surrey Downs, the proportion of All Pupils with Social Emotional and Mental Health Needs is 3.2%, which is similar to the 3.5% observed in Surrey in 2022-23.
All Pupils with Social Emotional and Mental Health Needs by Place
All Pupils with Social Emotional and Mental Health Needs in Surrey Downs

Data Source: Department of Education
Note: These are benchmarked against the Surrey average
Social Emotional and Mental Health Needs – Primary Pupils
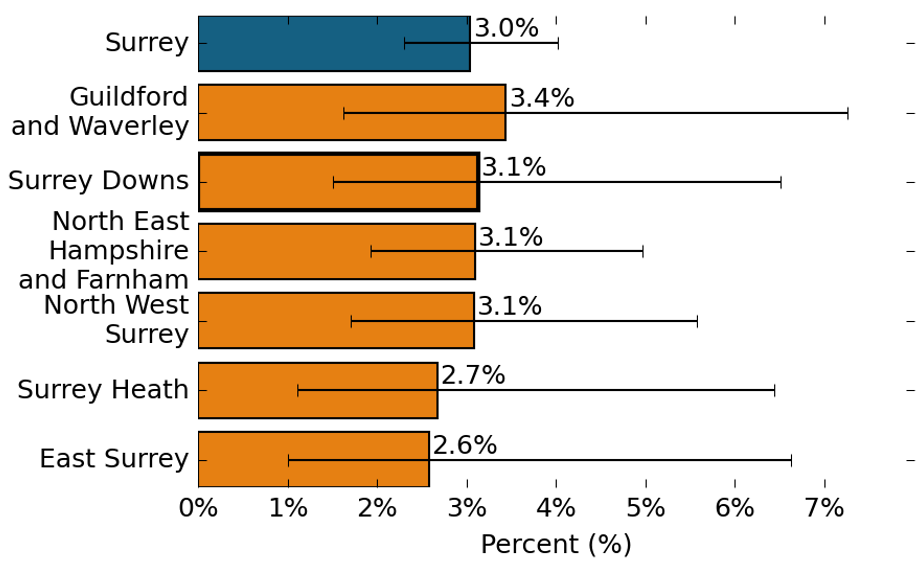
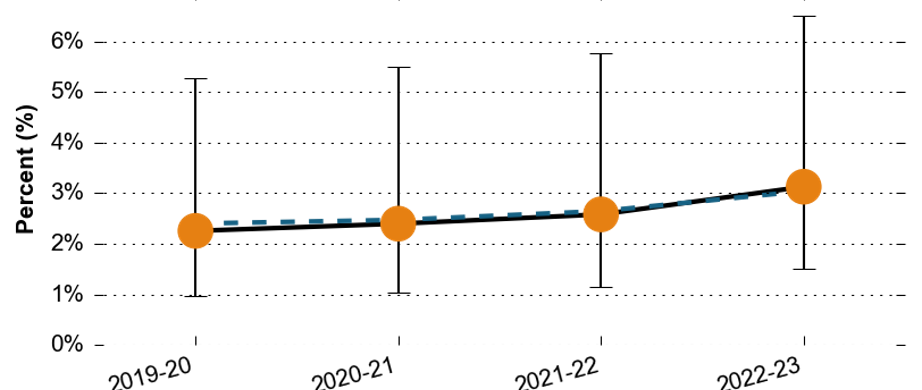
In Surrey Downs, the proportion of State-funded primary pupils with Social Emotional and Mental Health Needs is 3.1%, which is similar to the 3.0% observed in Surrey in 2022-23.
State-funded primary pupils with Social Emotional and Mental Health Needs by Place
State-funded primary pupils with Social Emotional and Mental Health Needs in Surrey Downs

Data Source: Department of Education
Note: These are benchmarked against the Surrey average
Social Emotional or Mental Health Needs – Secondary Pupils
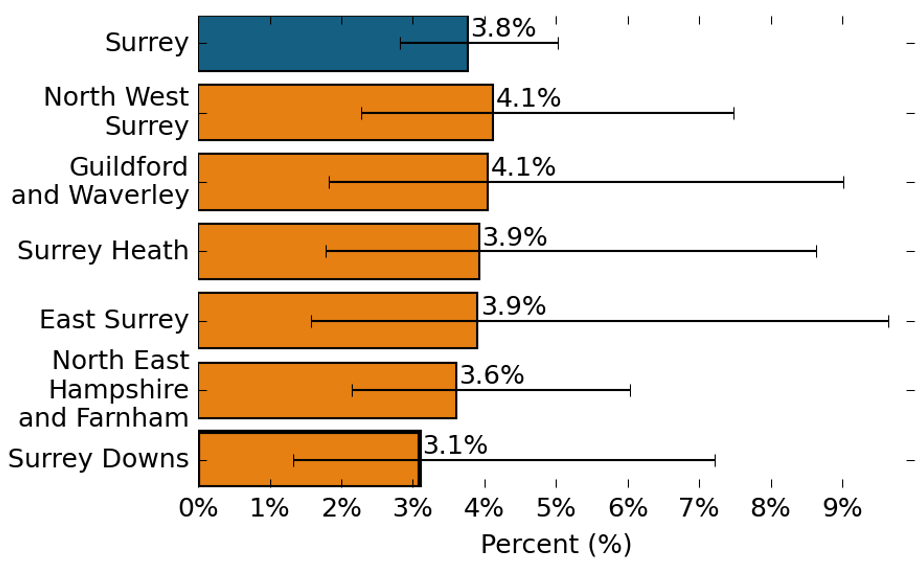
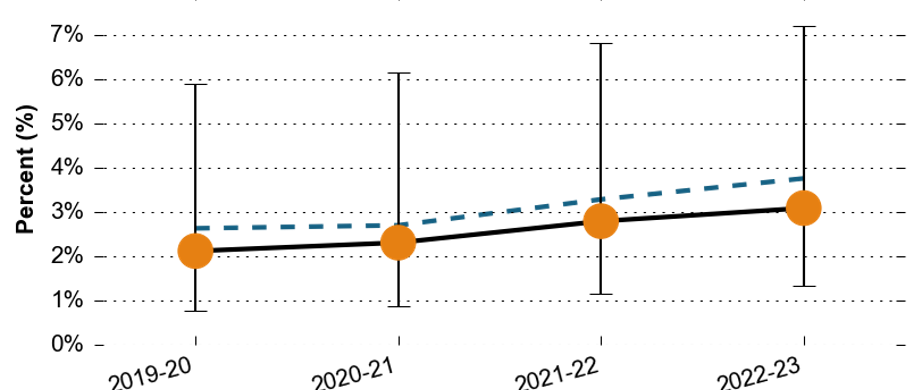
In Surrey Downs, the proportion of State-funded secondary pupils with Social Emotional or Mental Health Needs is 3.1%, which is similar to the 3.8% observed in Surrey in 2022-23.
State-funded secondary pupils with Social Emotional or Mental Health Needs by Place
State-funded secondary pupils with Social Emotional or Mental Health Needs in Surrey Downs

Data Source: Department of Education
Note: These are benchmarked against the Surrey average
Reported a Mental Health Condition
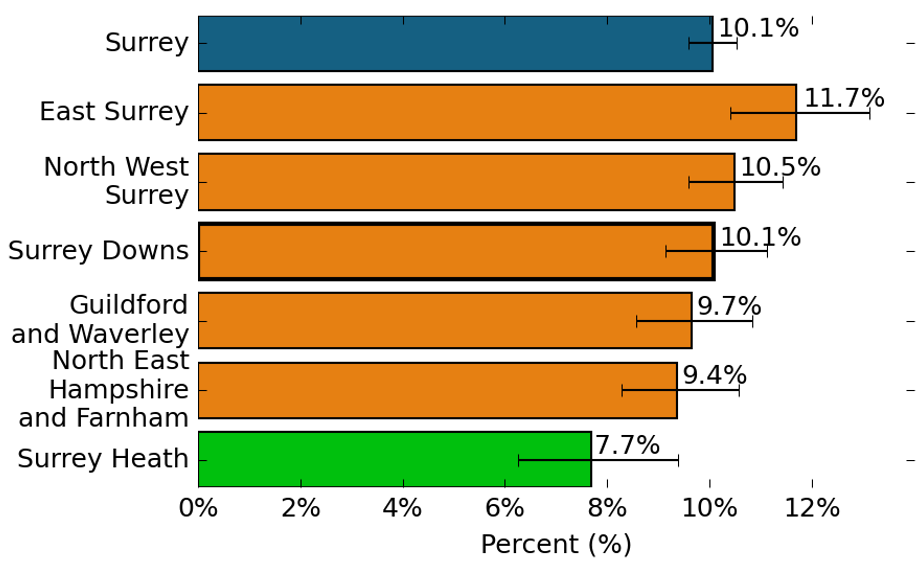
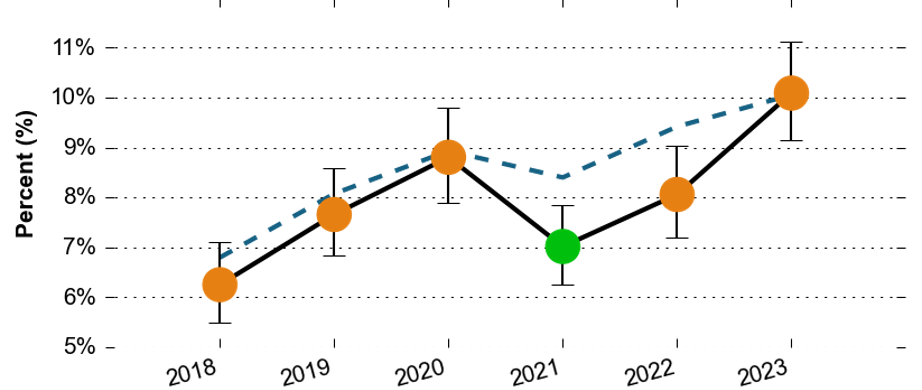
In Surrey Downs, 10.1% reported a mental health condition, which is similar to the 10.1% observed in Surrey in 2023.
People that Reported A Mental Health Condition by Place
People that Reported A Mental Health Condition in Surrey Downs
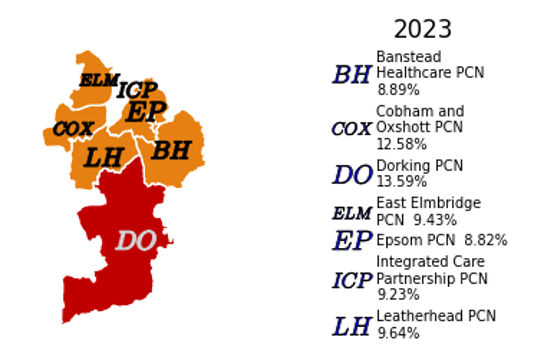
People that Reported A Mental Health Condition by PCN in Surrey Downs

Data Source: GP Patient Survey
Note: These are benchmarked against the Surrey average
Musculoskeletal
Reported problems with physical mobility
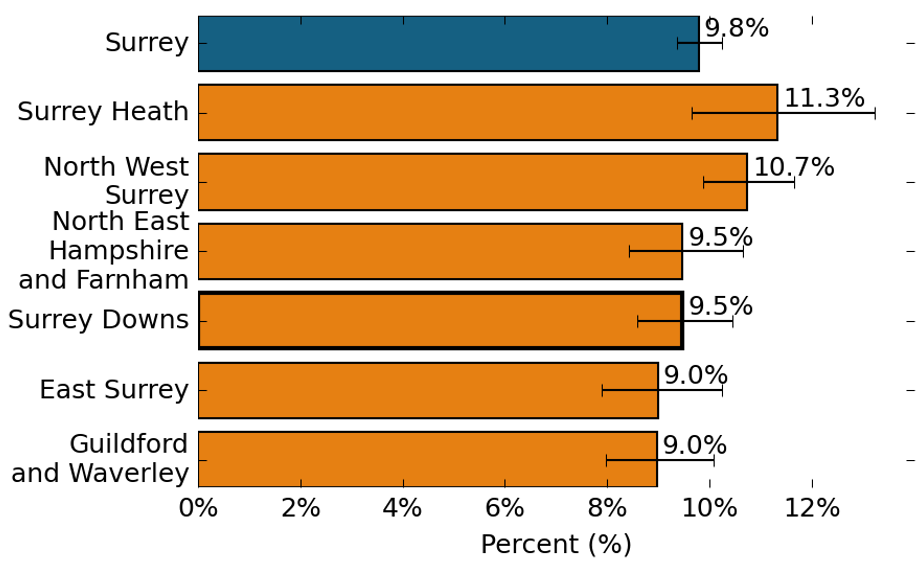
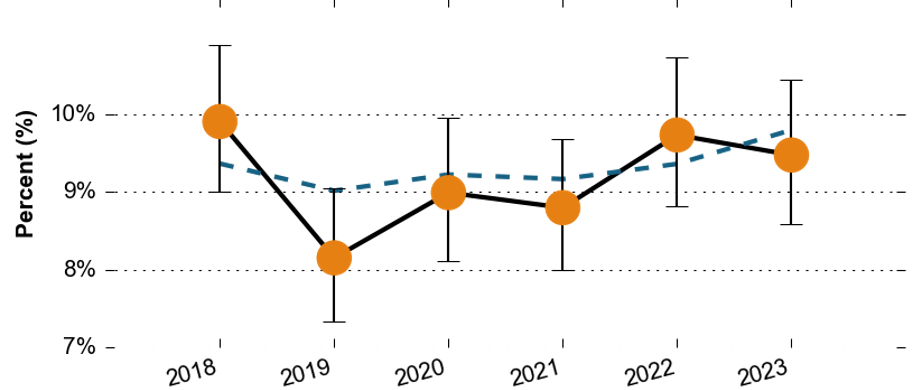
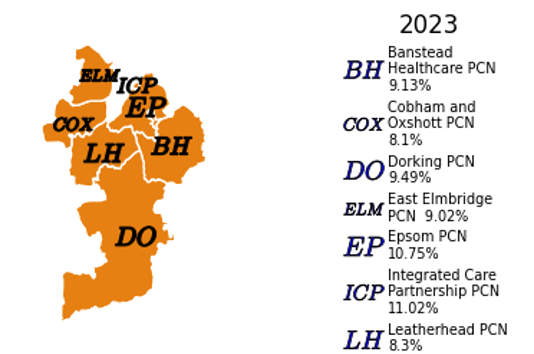
In Surrey Downs, 9.5% reported problems with physical mobility, which is similar to the 9.8% observed in Surrey in 2023.
People that reported problems with physical mobility by Place
People that reported problems with physical mobility in Surrey Downs
People that reported problems with physical mobility by PCN

Data Source: GP Patient Survey
Note: These are benchmarked against the Surrey average
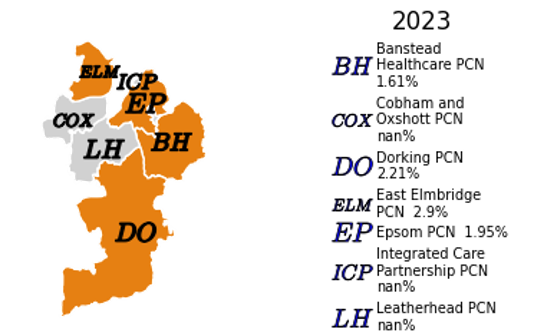
Reported two or more falls that have needed medical attention
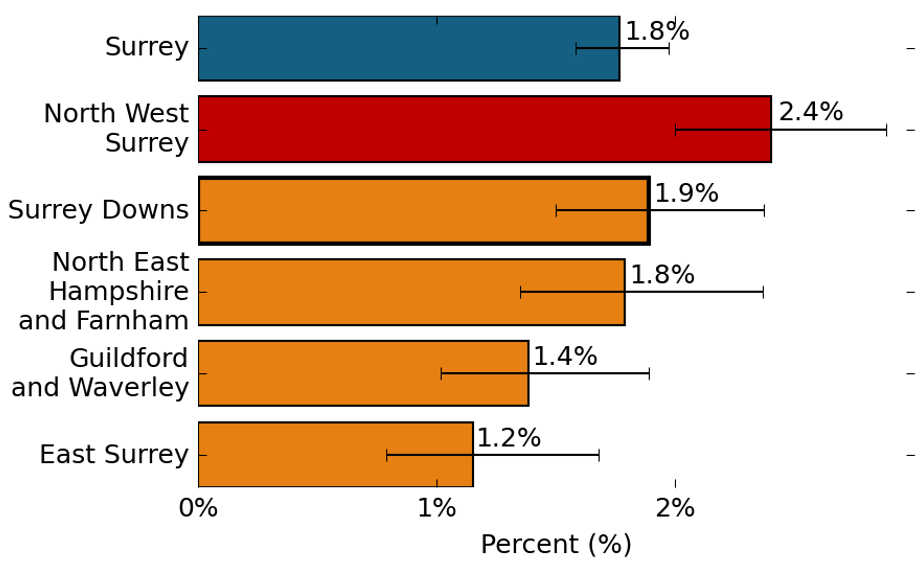
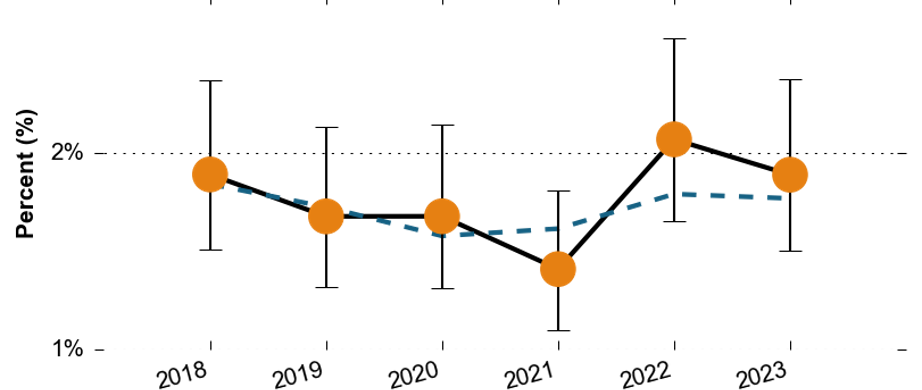
In Surrey Downs, 1.9% reported two or more falls that have needed medical attention, which is similar to the 1.8% observed in Surrey in 2023.
People that reported two or more falls that have needed medical attention by Place
People that reported two or more falls that have needed medical attention in Surrey Downs
People that reported two or more falls that have needed medical attention by PCN

Data Source: GP Patient Survey
Note: These are benchmarked against the Surrey average
Loneliness
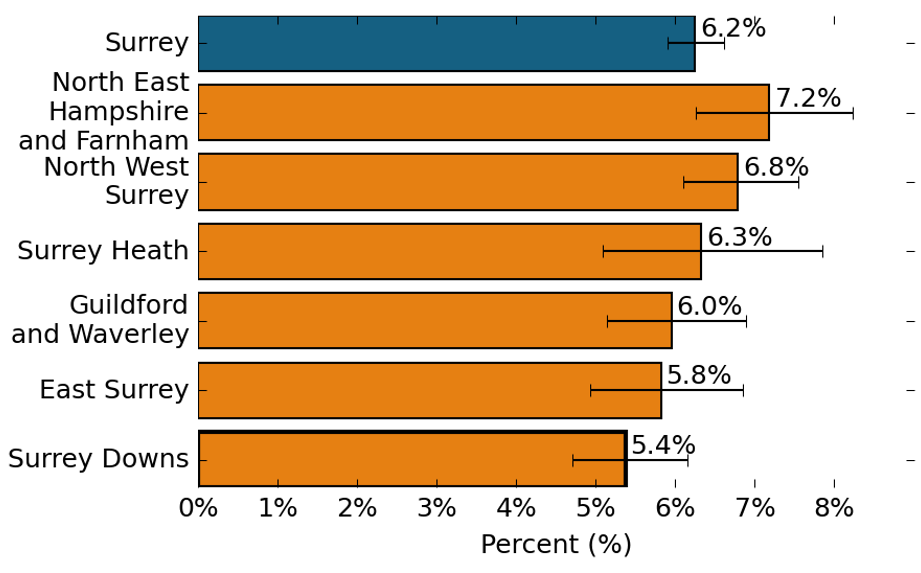
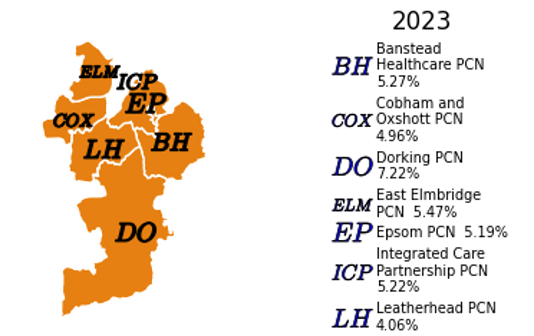
Reported feeling isolated from others
In Surrey Downs, 5.4% reported feeling isolated from others, which is similar to the 6.2% observed in Surrey in 2023.
People that reported feeling isolated from others by Place
People that reported feeling isolated from others in Surrey Downs

People that reported feeling isolated from others by PCN

Data Source: GP Patient Survey
Note: These are benchmarked against the Surrey average
Smoking
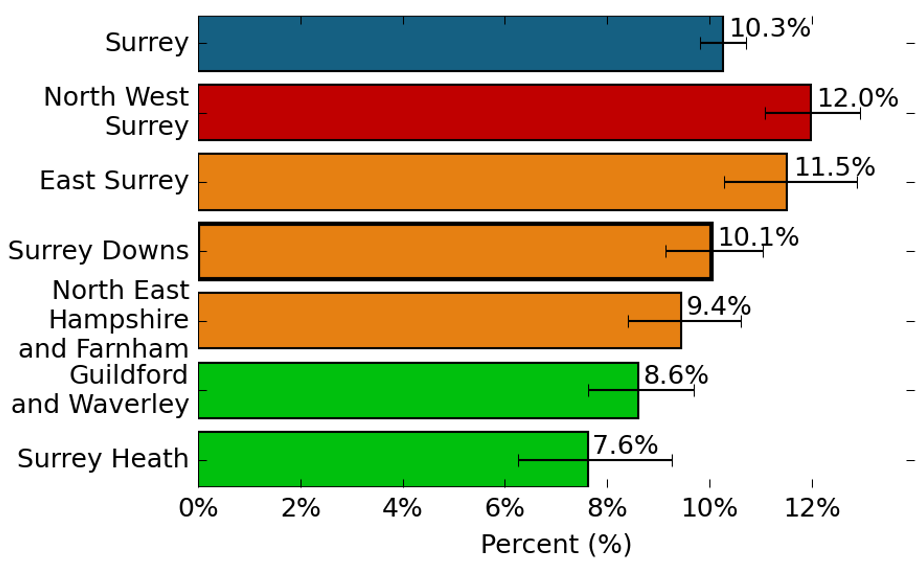
Described themselves as a current Smoker
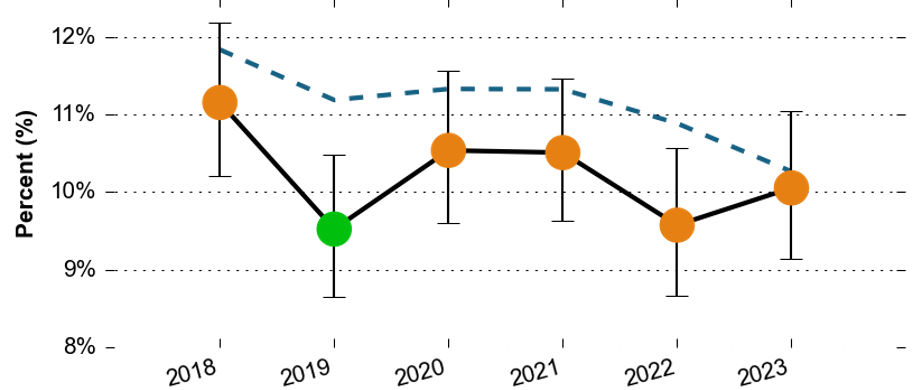
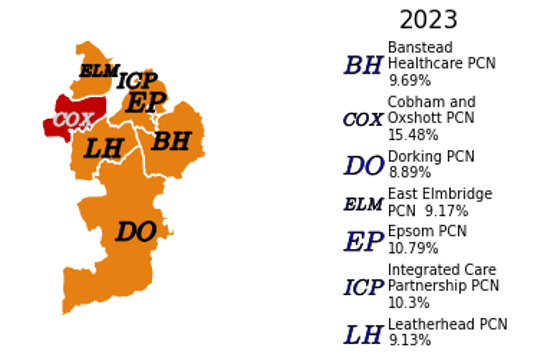
In Surrey Downs, 10.1% described themselves as a current Smoker, which is similar to the 10.3% observed in Surrey in 2023.
People that Described themselves as a current Smoker by Place
People that Described themselves as a current Smoker in Surrey Downs
People that Described themselves as a current Smoker by PCN

Data Source: GP Patient Survey
Note: These are benchmarked against the Surrey average