This page includes data and a summary of pupil and school numbers by the characteristics of pupils and types of schools.
STATE-FUNDED PRIMARY SCHOOLS: includes middle schools as deemed, primary academies, including free schools.
STATE-FUNDED SECONDARY SCHOOLS: includes middle schools as deemed, city technology colleges and secondary academies, including free schools, university technical colleges and studio schools.
SPECIAL SCHOOLS: Excludes general hospital schools. Includes special academies and free schools.
PUPIL REFERRAL UNITS: includes pupils who are sole or dual main registrations. Also includes alternative provision academies and free schools. Also includes pupils who are registered with other providers and further education colleges.
Summary
This data is largely collected through the School Census and the methodology is detailed here. The next data update should be in June/July 2023.
There were 201,993 pupils registered in Surrey in 2021/22. Just under 1 in 5 Surrey pupils attend an independent school.
Just under half (46%) of Surrey pupils attend state-funded primary schools (Key Stages 1 to 2 which take place from ages 5 to 11). Just under 1 in 3 (32%) of pupils in Surrey are from state-funded secondary schools (Key Stages 3 to 4 which take place from ages 12 to 16).
The number of Surrey pupils in state-funded special schools increased by 8 per cent (223 pupils) in the last year. The number of pupils in state-funded special schools rose by 44 per cent in the last six years between 2015/16 to 2021/22 (from 2,024 to 2,911).
The number of pupils in Surrey by school type, 2021/22
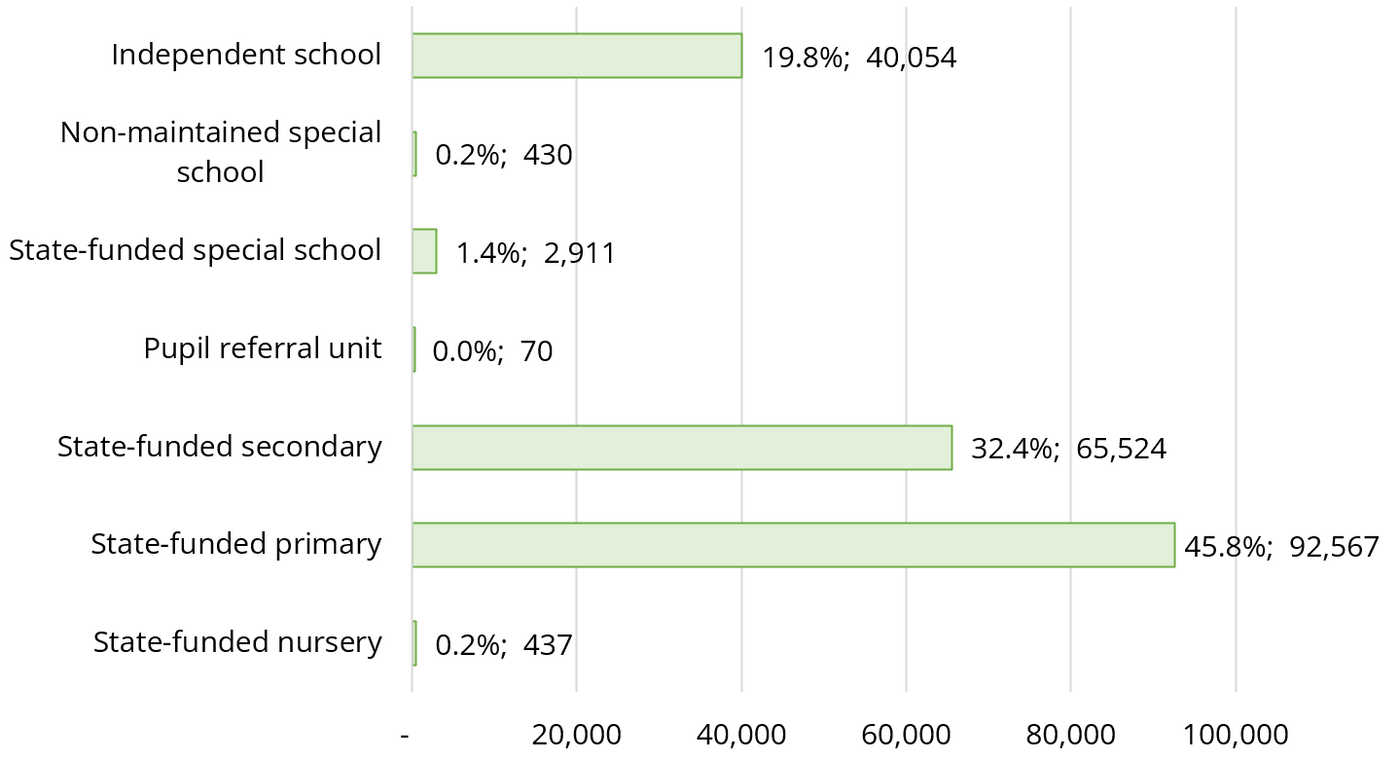
Pupil numbers in independent schools are not broken down by whether they are primary or secondary schools.
Academies receive their funding from central government rather than a local authority and are run by an academy trust. Both academy and local authority-maintained schools are considered ‘state-funded’ schools.
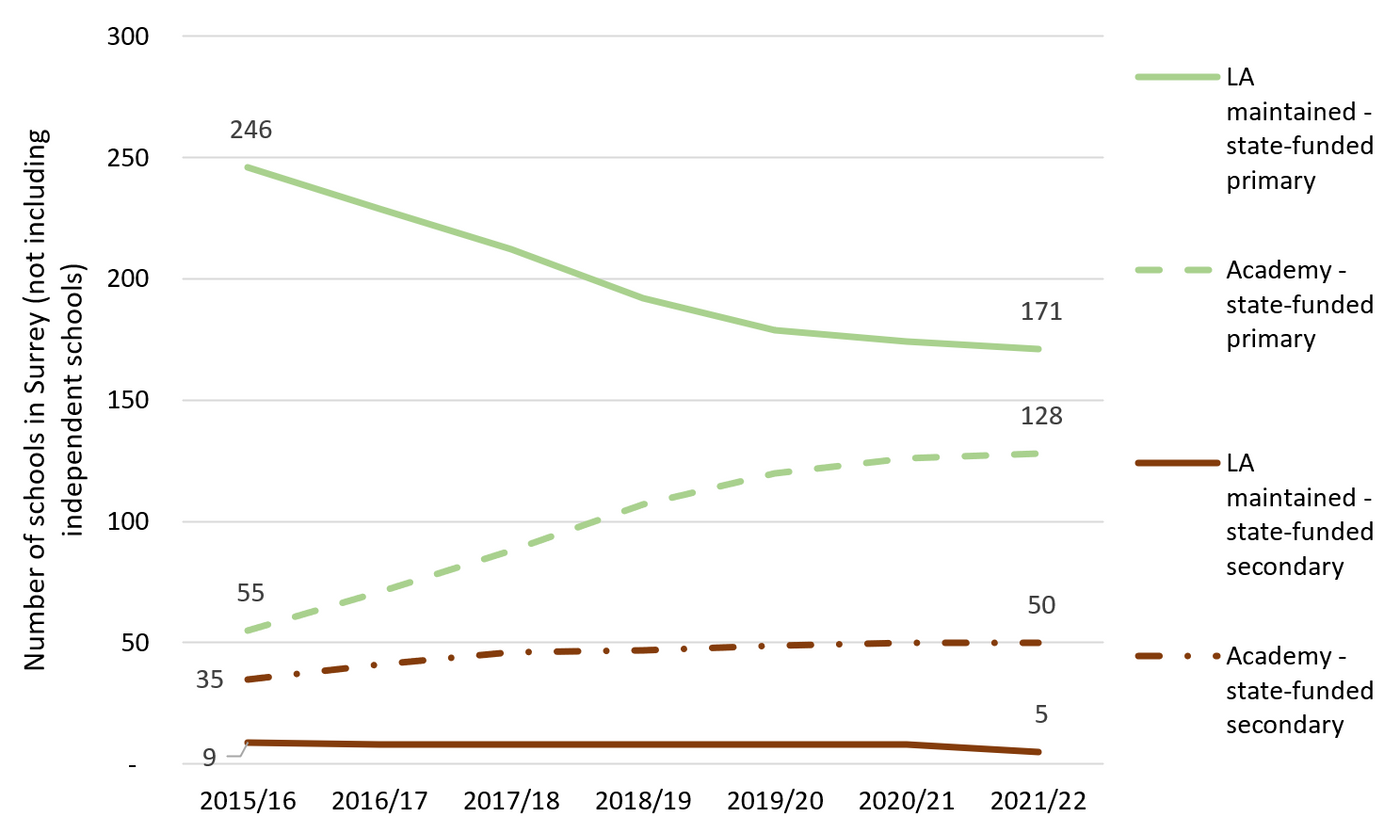
The number of schools in Surrey which are academies has increased over time. Over 4 in 10 state-funded primary schools in Surrey are now academies (43% in 2021/22). This has increased from under 2 in 10 (18%) state-funded primary schools being academies in 2015/16. The majority of state-funded secondary schools in Surrey are academies (91 per cent in 2021/22) and just 5 of the 55 are local authority funded.
The number of schools in Surrey by academy status, 2015/16 to 2021/22
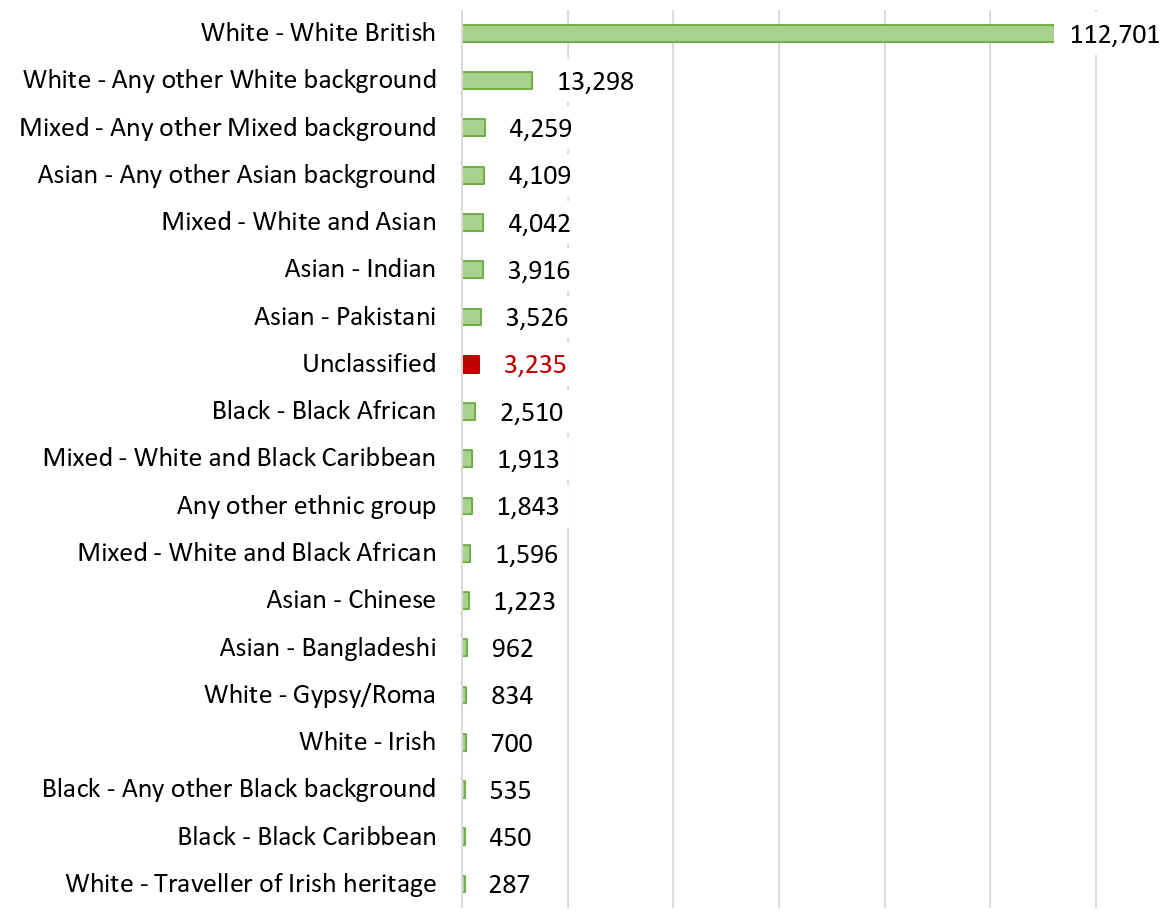
In Surrey, around 70 per cent of the pupils at state-funded schools are registered as White British (112,701 pupils) in 2021/22. The second largest ethnic group in Surrey schools are those who are White but are not British, made up by 287 Traveller of Irish heritage pupils, 700 Irish pupils, 834 Gypsy/Roma pupils, and 13,298 White pupils who are not White British, Gypsy/Roma, or Travellers of Irish heritage. Just over 5 per cent of pupils are South Asian, with 3,916 pupils registered as Indian, 3,526 pupils as Pakistani, and 962 as Bangladeshi in 2021/22. Around 2 per cent of pupils are Black, of which, 2,510 pupils are registered as Black African and 450 as Black Caribbean. Pupils of mixed ethnicity represent the third largest ethnic group overall. Of the 7.3 per cent of pupils who are of a mixed ethnicity, 1,596 are White and Black African, 1,913 are White and Black Caribbean, and 4,042 pupils are White and Asian.
The number of pupils in state-funded schools in Surrey by ethnicity, 2021/22
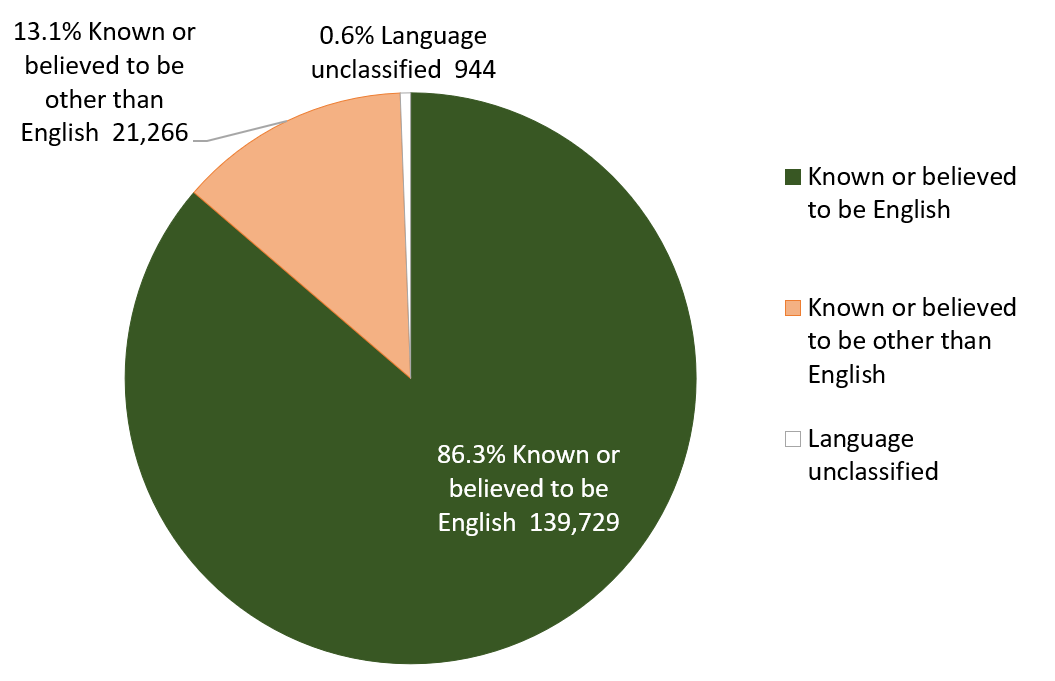
The majority, 86 per cent, of the pupils in Surrey state-funded schools are known or believed to have English as their first language in 2021/22. However, 21,266 pupils in Surrey are known or believed to have English as their second (or higher) language. The proportion of pupils with English not as their first language is larger in Surrey primary schools (15.0% representing 13,926 pupils) compared to secondary schools (10.5% representing 6,887 pupils). Surrey-I also includes tables which breakdown the distribution of first language by other school types.
The number of pupils in state-funded schools in Surrey by first language, 2021/22
