Air Quality
Air Quality
Publication date
This chapter was published in August 2025
Minor data amendments were made in February 2026.
Contents
- Executive Summary
- Introduction
- Whose health is at risk
- What is air pollution?
- Air pollutant thresholds
- Health conditions affected by air pollution
- National context to address poor air quality
- Local context to address poor air quality
- Elmbridge Borough Council
- Epsom and Ewell Borough Council
- Guildford Borough Council
- Mole Valley District Council
- Reigate and Banstead Borough Council
- Runnymede Borough Council
- Spelthorne Borough Council
- Surrey Heath Borough Council
- Tandridge District Council
- Waverley Borough Council
- Woking Borough Council
- Recommendations
- Contributors
- Glossary of abbreviations
- References
- Acknowledgements
Executive Summary
Air quality is a public health and environmental issue in Surrey, as there is no safe level for many pollutants. This JSNA provides a comprehensive assessment of air pollution across the county, its health impacts, and strategic responses at local and national levels.
Key Findings:
- Air pollution contributes to respiratory and cardiovascular diseases, cancer, dementia, and premature mortality. Vulnerable groups (children, the elderly, and those with pre-existing conditions) are most at risk. In Surrey, air pollution is attributed to higher-than-average mortality rates compared to England.
- Key outdoor pollutants include nitrogen dioxide (NO₂), particulate matter (PM2.5 and PM10), ozone (O₃), sulphur dioxide (SO₂), ammonia (NH₃), carbon monoxide (CO), and volatile organic compounds (VOCs). Indoor air quality is also a concern, from sources including domestic heating, cooking, and tobacco smoke.
- Major contributors include road traffic, domestic wood burning, industrial emissions, and aviation (notably from Heathrow and Gatwick airports). Urban areas and locations near major roads show higher pollution levels.
- While long-term trends show reductions in NO₂ and PM due to cleaner vehicles and reduced coal use, challenges remain especially with rising O₃ levels and increased domestic wood burning.
- As of the 1st February 2026, Surrey has 17 Air Quality Management Areas (AQMAs), with varying levels of progress. District and Boroughs are implementing monitoring, public awareness campaigns, electric vehicle (EV) infrastructure, and school-based interventions.
- A 2025 survey revealed that over 85% of respondents are concerned about air pollution health impacts, yet more than half are unaware of local air quality levels.
Strategic Priorities:
- The Surrey Air Alliance (SAA) coordinates efforts across councils, health services, and other partners to monitor, model, and mitigate air pollution.
- The Surrey Heartlands Integrated Care Board (ICB) Asthma Project integrates air quality into asthma care particularly for children and promotes asthma-friendly schools.
- Local Transport Plans, Climate Change Strategies, and Clean Air Strategies aim to reduce emissions through sustainable transport, planning controls, and public engagement.
Recommendations:
- Expand air quality monitoring and modelling (including ultrafine particles).
- Promote Surrey wide clean air campaigns and anti-idling initiatives.
- Improve public access to real-time air quality data.
- Support behaviour changes through education and infrastructure (e.g. EV charging, active travel).
- Explore domestic wood burner scrappage schemes.
- Expand airTEXT pollution warning system throughout Surrey, to support those vulnerable to poor air quality.
This JSNA underscores the need for coordinated, evidence-based action to improve air quality and protect the health of Surrey’s residents and visitors.
Introduction
Air quality is a critical determinant of public health and well-being. It is essential to assess and understand the current state of air quality in Surrey to inform effective policies, interventions, and resource allocation as there is currently no safe level for several pollutants. This Joint Strategic Needs Assessment (JSNA) [1] on air quality aims to provide a comprehensive overview of the existing evidence base, identify key issues, and outline potential further areas for action.
Key objectives
- Assess current air quality levels: Evaluate the levels of various air pollutants in Surrey, including particulate matter (PM2.5 and PM10), nitrogen dioxide (NO2), ozone (O3), and sulphur dioxide (SO2).
- Identify vulnerable populations: Determine the groups most at risk from poor air quality, such as children, the elderly, individuals with respiratory conditions, and those living in areas with high levels of pollution.
- Understand the health impacts: Explore the link between air pollution and a range of health outcomes, including respiratory diseases, cardiovascular problems, and mortality rates.
- Analyse contributing factors: Identify the primary sources of air pollution in Surrey, such as road traffic, domestic heating, industrial emissions, and agricultural activities.
- Review existing strategies and interventions: Evaluate the effectiveness of current measures to improve air quality and identify areas for improvement.
- Develop recommendations: Propose strategies, policies and actions to address air quality issues in Surrey and protect public health.
Scope
This JSNA covers the entire geographical area of Surrey, including both urban and rural areas. It draws on a variety of data sources, including air quality monitoring data, health data, census data, and other relevant information.
Why does air pollution matter
There is no safe level of air pollution—adverse health effects can occur even at low concentrations. Therefore, even small reductions in air pollutants can lead to significant improvements in public health. These are the direct benefits of cleaner air, such as reduced respiratory and cardiovascular diseases. In addition, actions taken to reduce air pollution—like promoting active transport or reducing vehicle use—can bring important co-benefits to health. These include increased physical activity, reduced noise pollution, improved road safety, and broader environmental gains such as climate change mitigation. [2]
A clear indication air quality has on the environment around us was shown during the COVID-19 pandemic in which air pollution dropped significantly. This was primarily due to the lockdowns that drastically reduced vehicle movement and all forms of transport.
Figure 1 outlines the differences in air quality before and during the COVID-19 pandemic lockdowns in the UK, when NO2 measurements were significantly improved. [3]
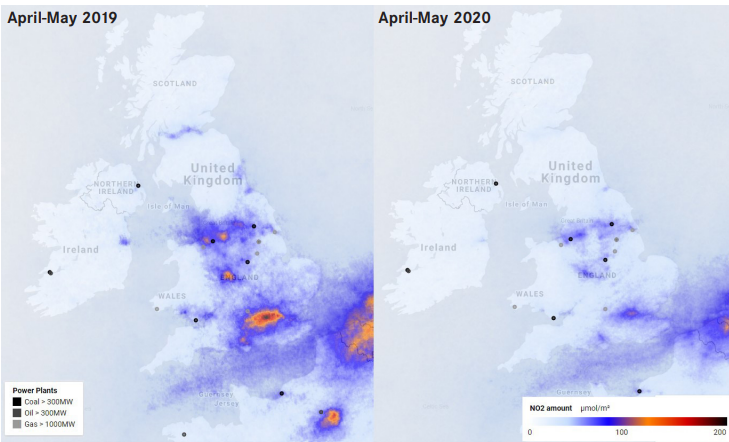
Source: Centreforcities.org
Figure 1 – NO2 measurements over the United Kingdom during the COVID-19 lockdowns.
Whose health is at risk
Everyone’s health is at risk. Air pollution can cause and worsen health conditions in all individuals, particularly society’s most vulnerable populations. Long-term exposure to air pollution can cause chronic conditions such as cardiovascular and respiratory diseases as well as lung cancer, leading to reduced life expectancy. Short-term increases in levels of air pollution can also cause a range of health impacts, including effects on lung function, exacerbation of asthma, increases in respiratory and cardiovascular hospital admissions and mortality.
Short and long-term exposures to air pollution can cause ill health at all stages of life. Short-term exposures can increase hospital admission rates. Long-term exposure can reduce life expectancy. Exposures can particularly affect those who are vulnerable such as children, the elderly, people with existing cardiovascular or respiratory diseases, pregnant women, communities in areas of higher air pollution, and low-income communities. Figure 2 provides a visual representation of the health impact of poor air quality from first breath to last.
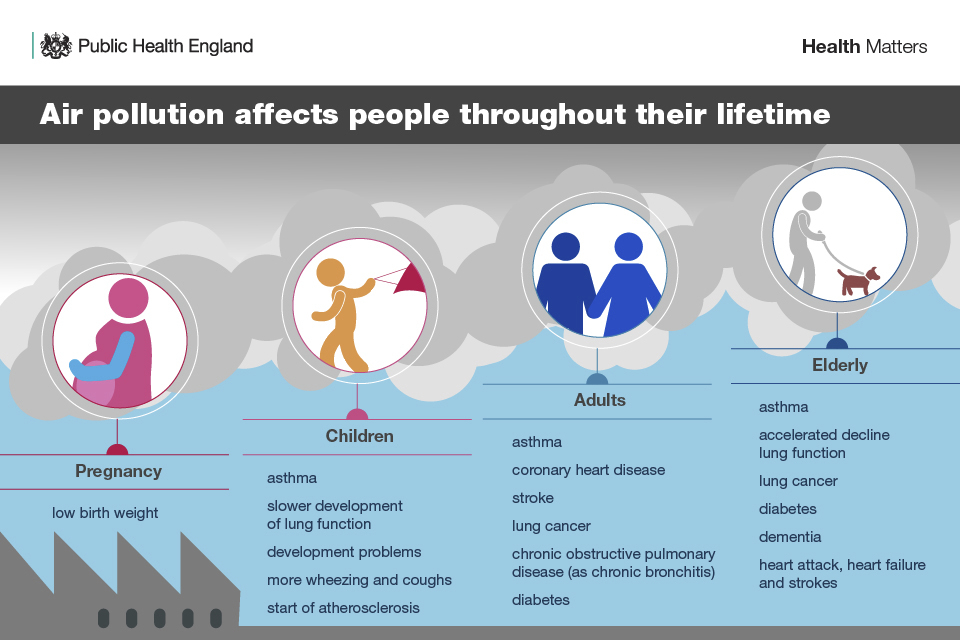
Source: Public Health England, 2025
Figure 2 – Shows the stages of life that air pollution can impact the health of a person.
What is air pollution?
Key pollutants
The primary air pollutants affecting public health include:
Nitrogen dioxide (NO2)
NO₂ [4] is a reddish-brown gas that is primarily produced during the combustion of fossil fuels, such as those used in vehicles and power plants. In the UK, NO₂ is a significant air pollutant, contributing to the formation of smog and acid rain. It is often measured alongside nitric oxide (NO), as both gases are collectively referred to as nitrogen oxides (NOₓ). In addition, NO2 is a ‘precursor pollutant’, as it is involved in the formation of O3. [5]
The main sources of NO2 in the UK are emissions from road transport, particularly diesel vehicles, and industrial processes. Power stations and residential heating systems also contribute to NO₂ levels. Natural sources, such as lightning and wildfires, play a minor role. In urban areas, road transport is the dominant source, accounting for a significant portion of NO₂ concentrations. [6]
Health Impacts: Exposure to NO2 has several adverse health effects, [7] particularly on the respiratory system. Short-term exposure can cause inflammation of the airways, leading to symptoms such as coughing, wheezing and difficulty breathing. Long-term exposure may increase the risk of developing respiratory diseases like asthma and reduce lung function. Vulnerable populations, including children, the elderly, and individuals with pre-existing respiratory conditions, are at greater risk of adverse health impacts. Additionally, NO₂ can exacerbate heart conditions and increase susceptibility to respiratory infections.
Trends in NO2 since 1990
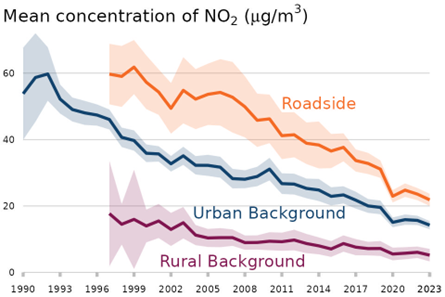
Source: DEFRA (Gov.Uk 2025)
Figure 3 – Annual mean concentrations of NO2 in the UK, 1990 to 2023
Figure 3 shows that over the last thirty years reductions in concentrations were observed at most monitoring sites across the UK. Emissions of NOX in the UK have continued to decrease as newer road vehicles subject to stricter emission standards enter the fleet and power generation moves away from the use of coal.
Figure 4 shows a map of the Surrey estimates of NO2. The areas closest to London, the higher the estimates. Whilst the estimates are lower in the south and west of Surrey. There are no safe limits of NO2 but the lower the numbers the less impact on health it has.
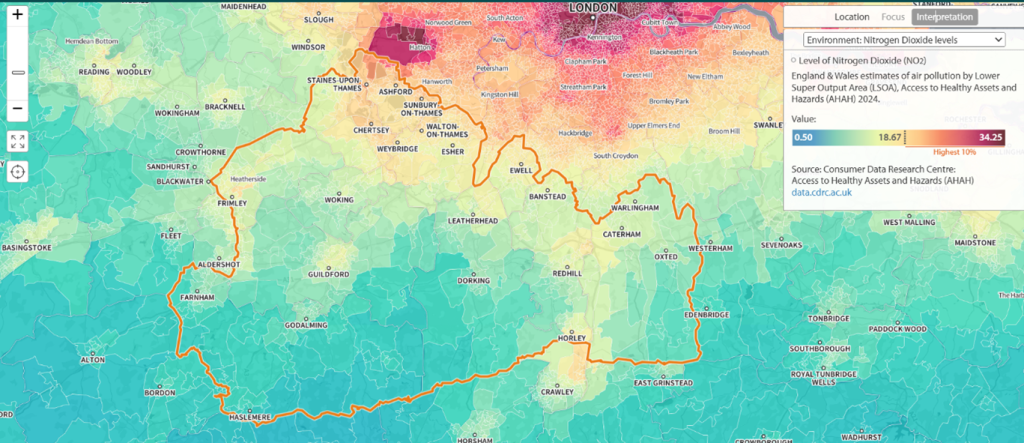
Source: Shape Atlas, 2025
Figure 4 – Map showing estimates of NO2 across Surrey
Particulate matter (PM10, PM2.5, and PM0.1)
Particulate Matter (PM) [8] refers to a mixture of solid particles and liquid droplets found in the air. These particles vary in size, with PM10 representing particles less than 10 micrometres in diameter, PM2.5 representing fine particles less than 2.5 micrometres, and PM0.1 representing ultrafine particles less than 0.1 micrometres. PM is composed of various substances, including organic chemicals, metals and soil or dust particles. [9]
In the UK, the primary sources of PM include emissions from road transport particularly from diesel vehicles, industrial processes, and residential heating systems. Construction and demolition activities also contribute to PM10 levels, while domestic wood burning and tyre and brake wear from vehicles are significant sources of PM2.5. Natural sources such as pollen, sea spray, and wildfires contribute to PM concentrations, but human activities are the dominant contributors. [10]
Health impacts: Exposure to PM has serious health implications, particularly for vulnerable populations such as children, the elderly, and individuals with pre-existing respiratory conditions. PM10 and PM2.5 can penetrate deep into the lungs, causing and/or enhancing respiratory issues like asthma and bronchitis, and can exacerbate cardiovascular diseases. Emerging evidence suggests that PM0.1 can enter the bloodstream, potentially affecting the heart, brain, and other organs. Long-term exposure to PM is associated with increased mortality rates, lung cancer, and other chronic health conditions. [11].
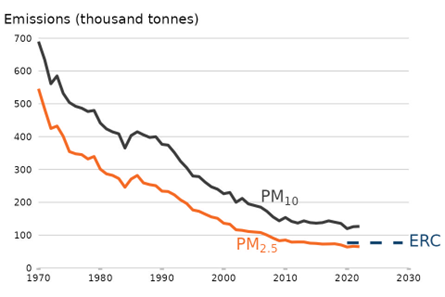
Source: DEFRA (Gov.uk 2025)
Figure 5 – Annual mean concentrations of PM10 and PM2.5 in the UK, 1992 to 2023
Trends in PM10 and PM2.5 since 1970 seen in Fig 5 above, show that UK annual emissions of PM2.5 have decreased by 88% since 1970 and PM10 has decreased by 82%.
Levels of PM generally decreased between 1970 and the late-2000s. There are many reasons for this long-term decrease, which covers most emissions sources, but the reduction in the burning of coal and improved emission standards for transport and industrial processes are major drivers. Since the late 2000s annual emissions of PM have generally continued to fall, but the rate of change has reduced. Compared to earlier decades, emission levels have been relatively steady with small annual fluctuations. No trends are available for PM0.1.
Figure 6 shows a map of the estimates of PM in Surrey, with the highest numbers in areas closest to London.
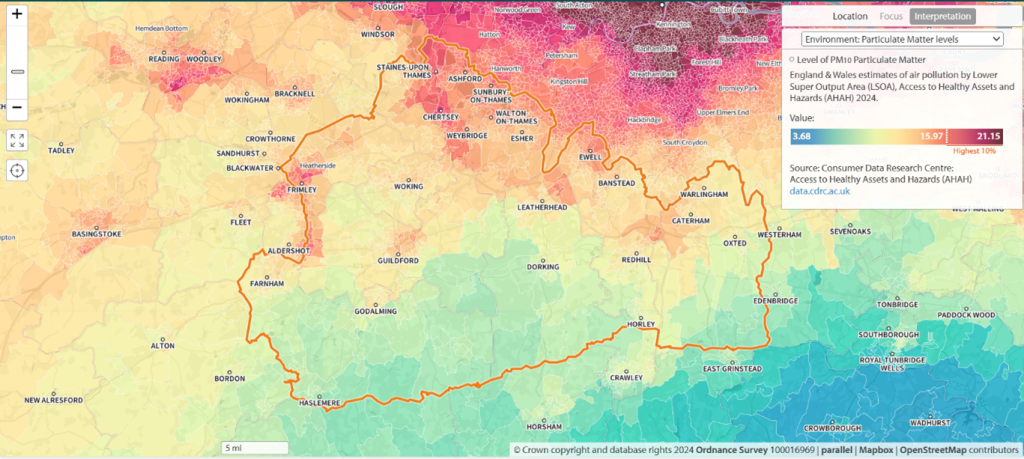
Source: Shape Atlas, 2025
Figure 6 – Map showing estimates of PM across Surrey
Ozone
Ozone (O₃) [12] is a gas known for its distinctively pungent smell. It exists in the stratosphere where it forms a protective layer against ultraviolet radiation and at ground level where it acts as a significant air pollutant. Ground-level O3 is not directly emitted but is formed through chemical reactions between NOₓ and volatile organic compounds (VOCs) in the presence of sunlight.
In the UK ground-level O3 is primarily formed from precursor pollutants such as NOₓ and VOCs which originate from vehicle emissions, industrial processes, and natural sources like wildfires. The chemical reactions that produce O3 are driven by sunlight, making O3 levels higher during warmer months. Additionally, methane emissions contribute to O3 formation. The complexity of these reactions and the ability of O3 to travel long distances make managing O3 pollution challenging. [13]
Health impacts: Exposure to elevated levels of O3 can have serious health consequences. It can irritate the respiratory tract, eyes, nose, and throat, leading to symptoms such as coughing, sore throats, and shortness of breath. O3 exacerbates respiratory conditions like asthma and chronic obstructive pulmonary disease (COPD), and even short-term exposure can impair lung function. Vulnerable populations, including children, the elderly, and individuals with pre-existing respiratory conditions, are particularly at risk of adverse health impacts. High O3 levels are also linked to increased hospital admissions for respiratory illnesses. [14]
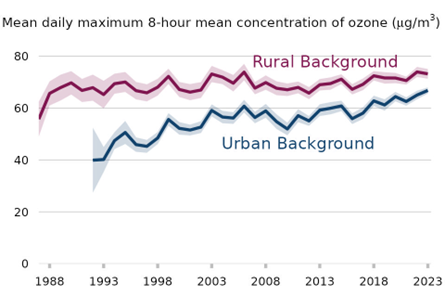
Source: DEFRA (Gov.uk 2025)
Figure 7 – Annual mean concentrations of O3 in the UK, 1987 to 2023
Trends in the UK O3 since 1988 seen in Fig 7 show that urban background O3 levels are increasing over a 30-year period, with the last few years typically being hotter than usual contributing to the recent increase.
Rural background O3 levels have shown no real trends and the reason the pollutant is higher in rural backgrounds is due to their being fewer other pollutants that degrade or inhibit O3. The gradual convergence of urban and rural background levels is due to a reduction in NO2 emissions from road transport and industrial processes that would have suppressed O3 concentrations.
Sulphur dioxide (SO2)
Sulphur Dioxide (SO₂) [15] is a colourless gas with a pungent, irritating odour. It is a significant air pollutant, primarily produced from the combustion of fossil fuels such as coal and oil. SO₂ is also used in various industrial processes, including the production of sulphuric acid and as a preservative in food and beverages.
The main sources of SO2 emissions in the UK are power plants, oil refineries, and industrial facilities that burn fossil fuels. Domestic heating systems and some motor vehicles also contribute to SO₂ levels. Natural sources, such as volcanic activity, play a minor role. Over the past few decades, emissions have significantly decreased due to stricter regulations and the closure of coal-fired power plants.
Health impacts: Exposure to SO2 can have serious health effects, particularly on the respiratory system. Short-term exposure can cause irritation of the nose and throat, coughing, and shortness of breath. High levels of exposure can lead to more severe respiratory issues, including asthma attacks and bronchitis. Long-term exposure may result in chronic respiratory diseases and reduced lung function. Vulnerable populations, such as children, the elderly, and individuals with pre-existing respiratory conditions, are at greater risk of adverse health impacts. [16]
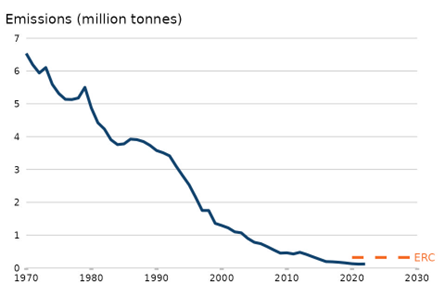
Source: DEFRA (Gov.uk 2025)
Figure 8: Annual emissions of sulphur dioxide in the UK, 1990 – 2023
Since 2022 there have been changes to the largest sources of SO2. The three largest sources of SO2 emissions in the UK now are domestic combustion (31%), industrial combustion (26%) and fuel combustion in energy production and transformation (23%). Industrial combustion refers to the burning of fuels on manufacturing and construction sites to generate energy for industrial use, such as producing heat or electricity, or to drive mobile machinery.
Figure 9 shows the estimations of SO2 across Surrey, with minimal mid-range estimates in line with the declining trends since 1970 above.
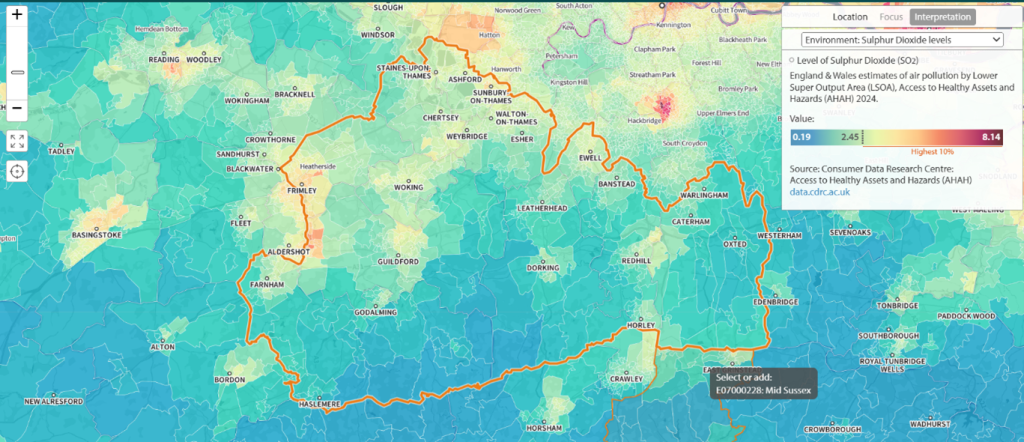
Source: Shape Atlas, 2025
Figure 9 – Map showing estimates of SO3 across Surrey
Ammonia (NH3)
Ammonia (NH₃) [17] is a colourless gas with a pungent smell, commonly used in industrial processes and is a key component in agricultural fertilizers. It is highly soluble in water and can form ammonium compounds. NH3 is produced naturally and through human activities, with significant emissions arising from agricultural practices.
In the UK, the primary sources of NH3 emissions are agricultural activities, particularly from livestock manure and the application of nitrogen-based fertilizers. Other sources include industrial processes, waste management, and emissions from vehicles equipped with catalytic converters. Natural sources, such as the decomposition of organic matter, also contribute to NH3 levels, but human activities are the dominant contributors. [18]
Health Impacts: Exposure to NH3 can have various health effects, depending on the concentration and duration of exposure. Short-term exposure to high levels of NH3 can cause irritation of the eyes, nose, and throat, leading to coughing and wheezing. Prolonged exposure can result in more severe respiratory issues, such as bronchitis and asthma. NH3 is also corrosive and contact with skin or eyes can cause burns and permanent damage. Vulnerable populations, including children, the elderly, and individuals with pre-existing respiratory conditions, are at greater risk of adverse health impacts. [19]
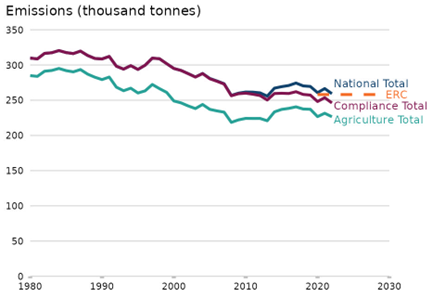
Source: DEFRA (Gov.uk 2025)
Figure 10 – Annual emissions of NH3 in the UK, 1990 to 2023
Trends in UK NH3 since 1980 (seen in Fig 10) show UK emissions of NH3 have decreased by 16 per cent since 1980 to 259 thousand tonnes in 2022. Most of this reduction occurred between 1980 and 2008. Emissions of NH3 then remained relatively stable from 2008 to 2013. Annual NH3 emissions were the lowest in 2013 at 256 thousand tonnes. Since then, emissions have been higher but have remained below the levels seen prior to the mid-2000’s. Changes in the trend of emissions of NH3 are driven largely by changes to farming practices and herd sizes.
Carbon monoxide (CO)
Carbon Monoxide (CO) [20] is a colourless, tasteless, odourless, and non-irritating gas produced as a by-product during the incomplete combustion of carbon-based fuels, such as gas, oil, wood, and coal. It is a significant air pollutant and poses serious health risks due to its ability to prevent the blood from carrying oxygen to cells, tissues, and organs.
The primary sources of CO emissions in the UK are road transport, particularly from vehicles with internal combustion engines, and industrial processes. Emissions from residential heating systems, such as gas boilers and wood-burning stoves, also contribute to CO levels. Faulty or poorly maintained appliances, such as gas cookers and heaters, can produce significant amounts of CO. Natural sources include wildfires and volcanic activity but human activities are the dominant contributors.
Health Impacts: Exposure to CO can have severe health effects. When inhaled, CO binds with haemoglobin in the blood, forming carboxyhaemoglobin, which reduces the amount of oxygen that can be transported around the body. Symptoms of CO poisoning include headaches, dizziness, nausea, confusion, and shortness of breath. Severe exposure can lead to loss of consciousness, respiratory failure, and death. Long-term exposure to low levels of CO can cause chronic health issues, including cardiovascular and neurological problems. [21]
Non-methane volatile organic compounds (NMVOCs)
Non-methane volatile organic compounds (NMVOCs) [22] are a diverse group of organic chemicals that exclude methane. These compounds can be found in indoor and outdoor environments and are known for their ability to react with other pollutants to form ground-level O3 and PM. NMVOCs include substances such as benzene, formaldehyde and toluene, which can have various health and environmental impacts.
In the UK, NMVOCs are emitted from a wide range of sources. Major contributors include road transport, industrial processes, and the use of solvents in products like paints, cleaning agents, and air fresheners. Agricultural activities such as the use of pesticides and fertilizers also release NMVOCs. Natural sources like vegetation and wildfires contribute to NMVOC emissions, but human activities are the dominant sources. [23]
Health Impacts: Exposure to NMVOCs can have significant health effects. Some NMVOCs, such as benzene and formaldehyde, are known carcinogens and can cause cancer with long-term exposure. Short-term exposure to high levels of NMVOCs can lead to respiratory issues, eye irritation, and headaches. NMVOCs also contribute to the formation of ground-level O3 which can exacerbate asthma and other respiratory conditions. Vulnerable populations, including children, the elderly, and individuals with pre-existing health conditions, are particularly at risk of adverse health impacts.
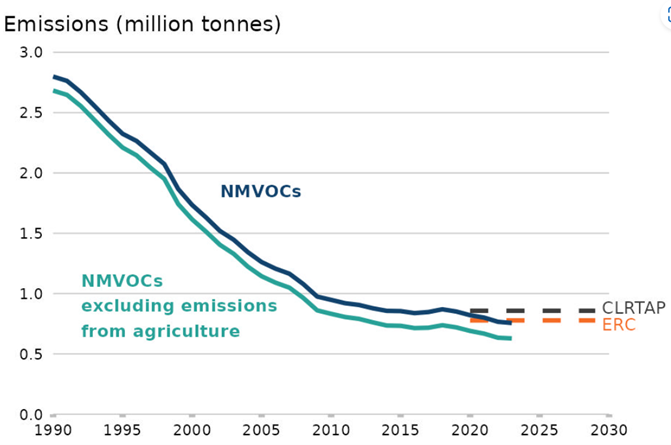
DEFRA (Gov.uk 2025)
Figure 11: Annual emissions of NMVOCs in the UK, 1990 – 2023
Trends in NMVOCs since 1990 seen in Fig 11 show UK emissions of NMVOC have decreased by 73% between 1990 and 2022. This is largely due to controls on emissions from road vehicles, which have delivered a 97% reduction in road transport sector emissions since 1990. There have also been large reductions in emissions from industrial processes, product use (54% reduction) and UK extraction, production and distribution of fossil fuels (85% reduction) such as North Sea oil and coal. [24]
Indoor air quality
What is indoor air quality / pollution
People spend 80-90% of their time indoors (homes, schools, workplaces, other public spaces and on transport). The effects of poor indoor air quality on health are understood less well than those due to poor outdoor air quality. The indoor environment is more complex and variable than outdoors. Sources and concentrations of pollutants can vary greatly between and within buildings.
Indoor pollutant sources include building materials, cooking and heating appliances, consumer products, occupant activities, damp and mould, as well as sources from the land on which buildings are sited. Concentrations of certain pollutants are higher indoors and can be exacerbated by poor ventilation. Indoor pollutant concentrations are also affected by the infiltration of air from outdoors. There is strong evidence for associations between certain individual pollutants and overall poor indoor air quality, with an increased risk of respiratory and cardiovascular illness, cognitive impairment and certain cancers. [25] Figure 12 shows the sources of air pollution in a home.
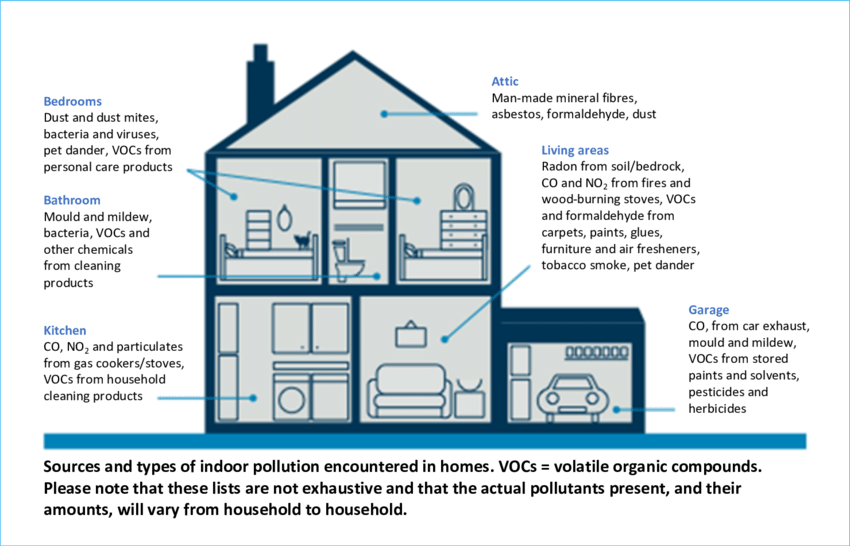
Source: UK Parliament POST, 2023
Figure 12 – Sources of indoor pollution in a home.
Carbon monoxide (CO)
Carbon Monoxide (CO) [26] is a significant concern for indoor air quality in the UK due to its colourless, odourless and tasteless nature, making it difficult to detect without proper equipment. Common sources of CO in homes include faulty or poorly maintained gas boilers, gas cookers, wood-burning stoves, and portable generators. Evidence suggests that indoor carbon monoxide levels can vary significantly, with higher concentrations typically found in homes with fuel-burning appliances.
To mitigate the risks, it is crucial to ensure that all fuel-burning appliances are properly installed, regularly maintained, and adequately ventilated. Installing CO alarms is also recommended to provide early warnings of dangerous CO levels. [27]
Nitrogen dioxides (NO2)
Nitrogen dioxides (NO₂) is a significant indoor air pollutant with common sources including gas stoves, heaters, and tobacco smoke. Evidence indicates that NO₂ levels in homes can vary, with higher concentrations typically found in urban areas due to infiltration of traffic emissions.
To mitigate the risks, it is essential to ensure adequate ventilation, maintain fuel-burning appliances and reduce indoor sources of NO₂.
Sulphur dioxide (SO2)
Sulphur dioxide (SO₂) is a significant indoor air pollutant in the UK with common sources including domestic combustion such as burning a variety of fuels in stoves, boilers and fireplaces.
Evidence indicates that SO₂ levels in homes can vary, with higher concentrations typically found in areas around heavy industrial activity.
To mitigate the risks, it is essential to ensure adequate ventilation, maintain fuel-burning appliances, and reduce indoor sources of SO₂.
Volatile organic compounds (VOCs)
Volatile organic compounds (VOCs) [28] are a diverse group of chemicals that can significantly impact indoor air quality. These compounds are emitted from a variety of sources, including building materials, furnishings, cleaning products, air fresheners and personal care products. VOCs can also originate from outdoor sources such as vehicle emissions and industrial activities.
Common VOCs found indoors include formaldehyde, benzene, and toluene. Exposure to VOCs can lead to a range of health effects, from short-term symptoms like eye, nose and throat irritation, headaches and dizziness to long-term effects such as liver, kidney, and central nervous system damage. Some VOCs are also known to be carcinogenic. Evidence suggests that indoor VOC levels can be significantly higher than outdoor levels, particularly in homes with poor ventilation.
To mitigate the risks associated with VOCs, it is essential to use low-emission products and ensure proper ventilation. The UK has established guidelines to control VOC levels in indoor environments to protect public health. [28]
Particulate Matter (PM)
Particulate matter (PM) is a critical indoor air pollutant in the UK consisting of tiny particles suspended in the air, including PM10 and PM2.5. PM can originate from various indoor sources such as cooking, smoking, burning candles, and using wood-burning stoves and infiltration from outdoor sources such as vehicle emissions and industrial activities.
Evidence suggests that indoor PM levels can be significantly higher than outdoor levels especially in poorly ventilated homes.
To mitigate the risks associated with PM it is essential to ensure adequate ventilation and the use of air purifiers to reduce indoor levels of PM.
Environmental tobacco smoke (ETS) and vaping
Environment tobacco smoke (ETS) and vaping has declined in public spaces (due to the 2007 ban of smoking in specific indoor public places) but remains a source of indoor air pollution in the home. ETS consists of more than 5,000 chemical compounds (including CO, PM and VOCs), with at least 70 compounds classified as carcinogens. Smoking caused an estimated 125,000 deaths in the UK in 2019 [29]. ETS can also accumulate in indoor environments (on walls, flooring, furniture, clothes and dust), which can then recirculate and react to form secondary pollutants leading to chronic exposure (termed third-hand smoke). E-cigarette or vape devices, originally designed for smoking cessation, have become increasingly popular especially with young people and those from lower socioeconomic backgrounds. There is limited evidence regarding pollutants emitted during vaping, but studies have shown an increase in indoor PM2.5 concentrations to over 150 μg/m3 during vaping. [30] [29]
Chief Medical Officer’s (CMO) report (2024) – indoor air quality
The CMO’s Annual Report 2024 – Health in Cities [31] advises that the switch from coal and highly polluting solid fuels to gas and electric for heating indoor spaces, has for many decades been improving indoor air quality. However, the popularity of wood burners particularly in affluent areas, has reversed this positive trend over the last decade in many cities. In urban areas where there are laws to enforce smokeless fuels (smoke control areas) these should be adhered to because air pollution is extremely dangerous at high concentrations. Elsewhere in lower density areas, occasional lifestyle use of modern design wood burners using dry wood is usually reasonable, but discharge of PM from frequent / continual use of wood burners is not good for health, especially for vulnerable people.
Since 2024, there has been a national campaign to raise awareness of the health impacts of domestic indoor wood burning. ‘Clean Air Night’ [32] takes place in January and encourages all those who use wood burners (other than those where this is their only source of heating), to learn more about the health effects, to use ‘ready to burn’ materials and eco design accredited wood burners, and to consider reducing the number of times that they use the wood burner.
Figure 13 from the CMO report shows the number of emissions from various types of indoor heating, ranging from a solid fuel open fire to electric heating. These emissions greatly affect the indoor air quality and can affect health.
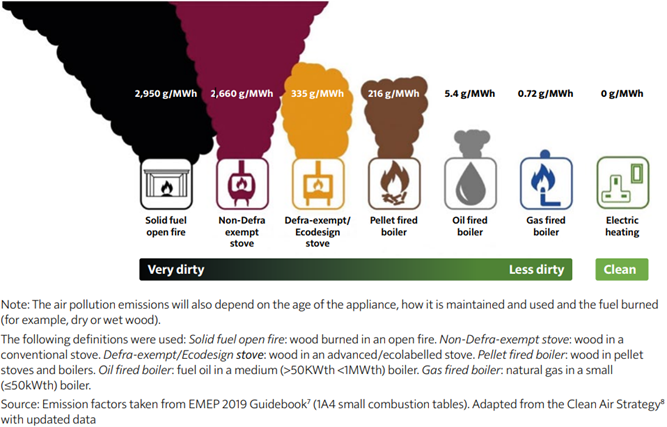
Figure 13 – The relative PM2.5 emissions from domestic heating methods
Air pollutant thresholds
World Health Organisation (WHO)
The WHO published the latest Air Quality Guidelines (AQG) in 2021 which are global targets to help national, regional and city governments across the world to reduce the impact on health of air pollution. The targets are based on evaluation of scientific evidence and shown in table 1. [33]
| Pollutant | Averaging Time (mean) | Microgram (µg) level per m3 |
| PM2.5 | Annual mean | 5 |
| PM2.5 | 24-hour mean | 15 |
| PM10 | Annual mean | 15 |
| PM10 | 24-hour mean | 45 |
| Ozone (03) | 8-hour mean | 100 |
| Ozone (03) | Peak Season | 60 |
| Nitrogen Dioxide (NO2) | Annual mean | 10 |
| Nitrogen Dioxide (NO2) | 24-hour mean | 25 |
| Nitrogen Dioxide (NO2) | 1-hour mean | 200 |
| Sulphur Dioxide (SO2) | 24-hour mean | 40 |
| Sulphur Dioxide (SO2) | 10-min mean | 500 |
| Carbon Monoxide (CO) | 24-hour mean | 4 |
| Carbon Monoxide (CO) | 8-hour mean | 10 |
| Carbon Monoxide (CO) | 1-hour mean | 35 |
| Carbon Monoxide (CO) | 15-min mean | 100 |
Note: Annual and peak season is long-term exposure, white 24 and 8-hour is short term exposure.
Table 1 – The pollutants and the WHO recommended thresholds for specific time periods.
European Union (EU)
The EU published in 2024 the ‘Directive on ambient air quality and cleaner air for Europe’ [34] as part of the ‘zero pollution action plan’ which sets aims for 2050 (in line with WHO guidelines). The interim targets to be attained by 2030 are in table 2.
| Pollutant | Averaging Time (mean) | Microgram (µg) level per m3 |
| PM2.5 | Annual mean | 10 |
| PM2.5 | 24-hour mean | 25a |
| PM10 | Annual mean | 20 |
| PM10 | 24-hour mean | 45a |
| NO2 | Annual mean | 20 |
| NO2 | 24-hour mean | 50a |
| NO2 | 1-hour mean | 200b |
| SO2 | Annual Mean | 20 |
| SO2 | 24-hour mean | 50a |
| SO2 | 1-hour mean | 350b |
| CO | 24-hour mean | 4a |
| CO | 8-hour mean | 10 |
a – not to be exceeded more than 18 times per year
b – not to be exceeded more than 3 times a year
Table 2 – The pollutants and EU target thresholds for specific time periods.
United Kingdom (UK)
Air quality has improved in England over recent decades. However, it continues to be the biggest environmental risk to public health, with children, the elderly and vulnerable people most affected. Poor air quality also has consequences for crop yields and particularly in the case of NH3 and NOx significant impacts for the natural environment and biodiversity.
Across England the Air Quality Standards Regulations 2010 [35] and the PM2.5 targets within the Environmental Targets (Fine Particulate Matter) (England) Regulations 2023 [36] and the Air Quality Strategy: A framework for local authority delivery [37] set the limit values for pollutants shown in table 3.
| Pollutant | Averaging Time (Mean) | Microgram (µg) level per m3 |
| PM2.5 | Annual | 20 (10 by 31 Dec 2040) |
| PM10 | Annual | 40 |
| PM10 | 24-hour | 50a |
| NO2 | Annual | 40 |
| NO2 | 1-hour | 200b |
| SO2 | 24-hour | 125c |
| SO2 | 1-hour | 350d |
| CO | 8-hour | 10 |
| O3 | 8-hour | 100e |
a – Not to exceed 35 times in a year
b – Not to exceed 18 times in a year
c – Not to exceed 3 times in a year
d – Not to exceed 24 times in a year
e – Not to exceed 10 times in a year
Table 3 – The pollutants and UK limits for specific time periods.
Comparison of WHO, EU and UK levels
The table below shows Microgram (µg) level per m3 for WHO, EU and UK
| Pollutant | Averaging Time (Mean) | WHO | EU | UK |
| PM2.5 | Annual mean | 5 | 10 | 20 |
| PM2.5 | 24-hour mean | 15 | 25 | N/A |
| PM10 | Annual mean | 15 | 20 | 40 |
| PM10 | 24-hour mean | 45 | 45 | 50 |
| 03 | 8-hour mean | 100 | N/A | 100 |
| NO2 | Annual mean | 10 | 20 | 40 |
| NO2 | 24-hour mean | 25 | 50 | N/A |
| SO2 | 24-hour mean | 40 | 50 | 125 |
| SO2 | 1-hour mean | N/A | 350 | 350 |
| CO | 24-hour mean | 4 | 4 | N/A |
| CO | 8-hour mean | 10 | 10 | 10 |
N/A = No threshold data available for comparison.
Table 4 – The comparison shows that the WHO has set ambitious targets.
The UK has currently set targets that are higher levels than EU and WHO for many pollutants including PM2.5, PM10, NO2, which are double the EU targets and SO2 which is 2.5 times higher. However, for PM2.5 the Environmental Targets (Fine Particulate Matter) (England) Regulations 2023 [36] set a legally binding target of 10(µg) /m3 by 31 December 2040 and the Environmental Improvement Plan 2023 [38] sets an interim target of 12(µg) /m3 by 31 January 2028.
Health conditions affected by air pollution
Short and long-term exposure to air pollution can lead to a range of diseases including the following:
- Respiratory – Chronic Obstructive Pulmonary Disease (COPD), asthma, lung cancer and lower respiratory infections
- Coronary Heart Disease (CHD)
- Stroke
- Diabetes
- Dementia
Air pollution can cause and worsen health effects in all individuals, particularly society’s most vulnerable populations. Long-term exposure can cause chronic conditions such as cardiovascular and respiratory diseases, as well as lung cancer, leading to reduced life expectancy. Short-term increases in air pollution levels can also cause a range of health impacts, including effects on lung function, exacerbation of asthma, and increases in respiratory and cardiovascular hospital admissions and mortality. Children are particularly at risk as their bodies are still developing, and damage caused while young can increase the risk of disease in later life. [39]
Figure 14 shows some of the conditions that can be exacerbated or caused by air pollution, it also shows the specific pollutant related to the condition.
![A diagram of the human body highlights various health impacts caused by air pollutants, with labels pointing to affected organs and systems. Each health effect is associated with specific pollutants:
Head:
Headache and anxiety (Sulphur Dioxide – SO₂)
Impacts on the central nervous system (Particulate Matter – PM)
Eyes, Nose, Throat:
Irritation of eyes, nose and throat
Respiratory System:
Breathing problems (Ozone – O₃, PM, Nitrogen Dioxide – NO₂, Benzo[a]pyrene – BaP)
Irritation, inflammation and infections
Asthma and reduced lung function (NO₂)
Chronic obstructive pulmonary disease (PM)
Lung cancer (PM, BaP)
Cardiovascular System:
Cardiovascular diseases (PM, O₃, SO₂)
Internal Organs:
Impacts on liver, spleen and blood (NO₂)
Impacts on the reproductive system (PM)
The diagram visually communicates how different pollutants affect various parts of the body, emphasising the widespread health risks associated with air pollution.](https://cdn-wp.datapress.cloud/surrey/20250813144341/Picture18.png)
Source: European Environment Agency, 2025
Figure 14 – Range of conditions and the air pollutants that can impact.
The annual mortality of human-made air pollution in the UK is roughly equivalent to between 28,000 and 36,000 deaths every year. It is estimated that between 2017 and 2025 the total cost to the NHS and social care system of air pollutants (PM2.5 and NO2 for which there is more robust evidence for an association) will be £1.6 billion. [40]
When diseases with weaker evidence of association are also added, including COPD, diabetes, low birth weight, lung cancer (for NO2 only) and dementia, the costs were £157 million in 2017 and could reach £18.6 billion by 2035. There could be around 2.5 million new cases of the above diseases by 2035 if current air pollution levels persist. [41]
Figure 15 shows the mortality mentioned above and data from the UK Health Forum and Imperial College London in collaboration with and funded by Public Health England (PHE). They developed a modelling framework and estimated that a 1 µg/m3 reduction in PM2.5 air pollution in England could prevent around 50,900 cases of CHD, 16,500 strokes, 9,300 cases of asthma and 4,200 lung cancers over an 18-year period. [42]
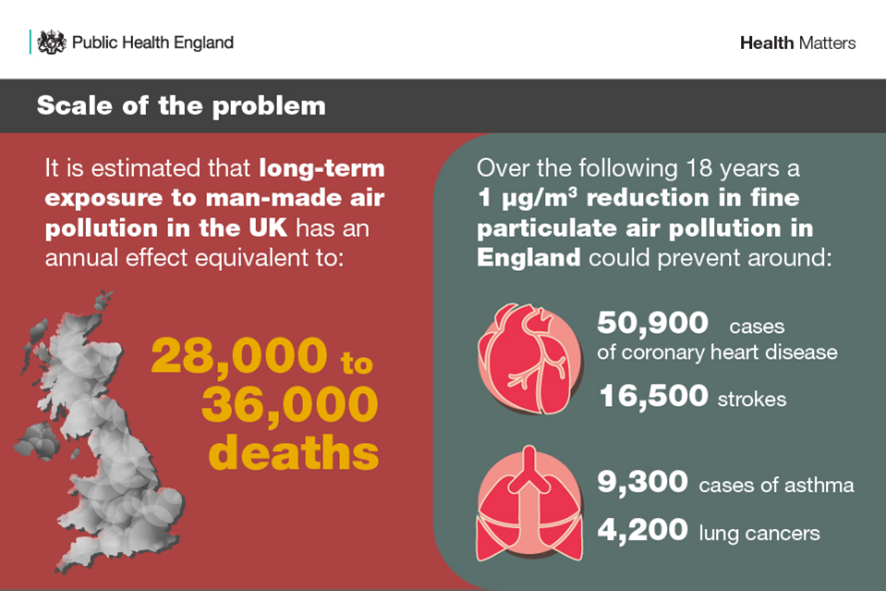
Source: Public Health England, 2018
Figure 15 – The estimated annual mortality rate for man-made air pollution and the positive impact of reducing fine particulate matter by 1µg/m3.
The Department for Environment, Food and Rural Affairs (DEFRA) publishes the Daily Air Quality Index (DAQI) [43] with the purpose of informing the public about levels of air pollution and provides recommended actions and health advice. They number the index from 1-10, separate into 4 bands (low, moderate, high and very high) and separate the advice given for people considered at a higher risk from air pollution from general population advice.
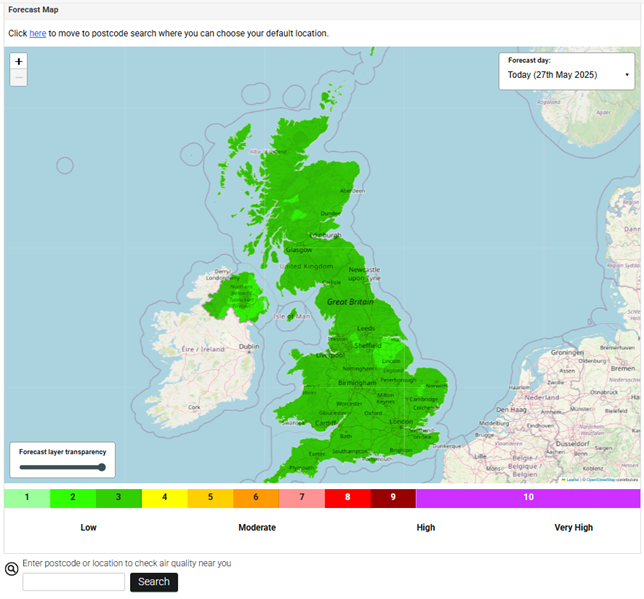
Figure 16 – UK map screenshot showing the air pollution for 27 May 2025.
Figure 16 is a screenshot of the pollution forecast on 27 May 2025 that is published by DEFRA. There is a box at the bottom for entering the postcode to check the air quality in a specific area. Figure 17 is a screenshot of the air quality over Surrey on the same day as the UK image above.
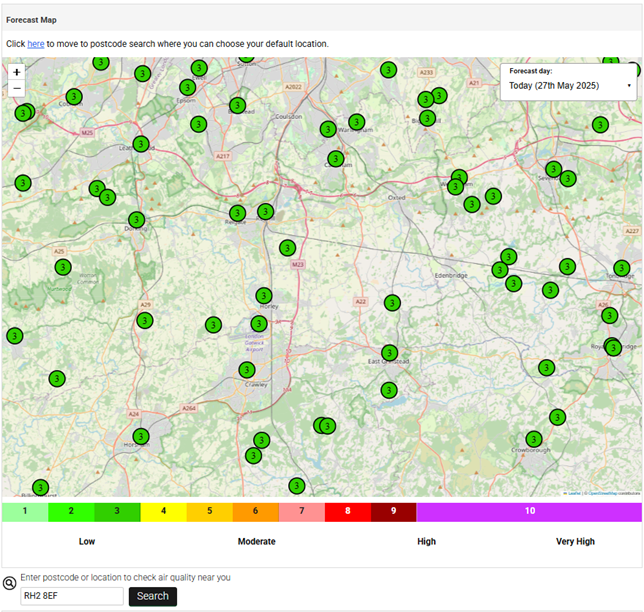
Figure 17 – Map of Surrey and the air quality monitoring sites showing the daily index.
Prevalence of health conditions affected by air pollution across Surrey
Fraction of mortality rates
Figure 18 shows the fraction of mortality rate in Surrey compared to England, where Surrey has a slightly higher mortality rate attributed to air pollution than the England average. The fraction of mortality rate can be viewed as the mortality burden associated with long term exposure to particulate air pollution (PM2.5) at current levels, expressed as a percentage of annual deaths from all causes in those aged 30 years and over.
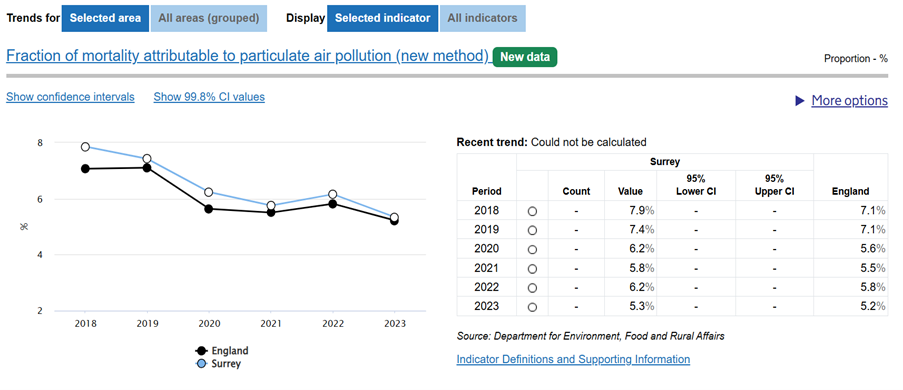
Figure 18 – The mortality rate in Surrey compared with England.
Figure 19 shows the District and Borough Council levels of fractional mortality in comparison to the England average.
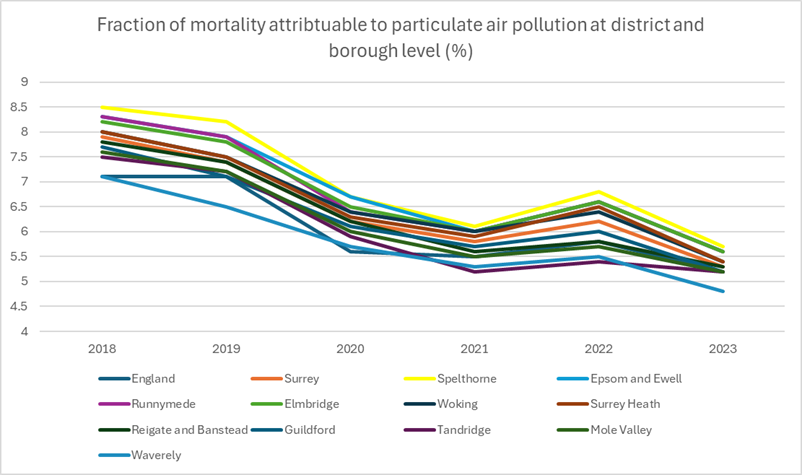
Figure 19 – The fraction of mortality rates across the Districts & Boroughs.
The graph shows that in 2018 all areas except Waverley had higher fraction of mortality rates attributed to air pollution. Whilst this gap has been steadily closing over the 5 years to 2023, Waverley remains the only Council area that has a lower mortality rate than the England average. Table 5 shows the fraction of mortality rates to provide some context to the graph in Figure 19 and how much the gap has closed.
| Area specified | 2018 | 2019 | 2020 | 2021 | 2022 | 2023 |
| England | 7.1 | 7.1 | 5.6 | 5.5 | 5.8 | 5.2 |
| Surrey | 7.9 | 7.4 | 6.2 | 5.8 | 6.2 | 5.3 |
| Spelthorne | 8.5 | 8.2 | 6.7 | 6.1 | 6.8 | 5.7 |
| Epsom and Ewell | 8.3 | 7.9 | 6.7 | 6 | 6.6 | 5.6 |
| Runnymede | 8.3 | 7.9 | 6.4 | 6 | 6.6 | 5.6 |
| Elmbridge | 8.2 | 7.8 | 6.5 | 6 | 6.6 | 5.6 |
| Woking | 8 | 7.5 | 6.4 | 6 | 6.4 | 5.4 |
| Surrey Heath | 8 | 7.5 | 6.3 | 5.9 | 6.5 | 5.4 |
| Reigate and Banstead | 7.8 | 7.4 | 6.2 | 5.6 | 5.8 | 5.3 |
| Guildford | 7.7 | 7.1 | 6.1 | 5.7 | 6 | 5.2 |
| Tandridge | 7.5 | 7.2 | 5.9 | 5.2 | 5.4 | 5.2 |
| Mole Valley | 7.6 | 7.2 | 6 | 5.5 | 5.7 | 5.2 |
| Waverley | 7.1 | 6.5 | 5.7 | 5.3 | 5.5 | 4.8 |
Table 5 – The fraction of mortality rates for District and Borough Councils in Surrey.
Chronic obstructive pulmonary disease (COPD), chronic heart disease (CHD) and asthma
Data on health conditions such as Asthma, CHD and COPD has been compiled by District and Borough Councils as well as Surrey Heartlands and Frimley ICBs across Primary Care Networks (PCNs) from April 2023.
Table 6 shows that the prevalence of Asthma, CHD and COPD across Surrey are lower than the England prevalence. However, there are some District and Borough Council areas with higher rates as follows:
- The prevalence of CHD in Tandridge is higher than England, and in Mole Valley, Spelthorne, Surrey Heath and Waverley it is higher than Surrey.
- The prevalence of COPD in all areas is lower than England, but in Mole Valley, Runnymede, Spelthorne and Tandridge it is higher than Surrey.
- The prevalence of Asthma in Waverley is the same as England, and in Epsom and Ewell, Mole Valley, Surrey Heath, and Tandridge it is higher than Surrey.
| Area Name | CHD prevalence (count) | CHD prevalence (%) | COPD prevalence (count) | COPD prevalence (%) | Asthma prevalence (count) | Asthma prevalence (%) |
| England | 1,862,774 | 3.0 | 6,832,634 | 1.8 | 22,710,916 | 6.5 |
| Surrey | 34,011 | 2.6 | 16,283 | 1.3 | 71,380 | 5.9 |
| Elmbridge | 3,436 | 2.2 | 1,538 | 1.0 | 7,380 | 5.1 |
| Epsom & Ewell | 2,182 | 2.5 | 1,022 | 1.2 | 4,903 | 6.0 |
| Guildford | 2,759 | 2.1 | 1,367 | 1.1 | 7,045 | 5.8 |
| Mole Valley | 2,895 | 3.0 | 1,352 | 1.4 | 5,876 | 6.4 |
| Reigate & Banstead | 3,843 | 2.5 | 2,011 | 1.3 | 8,627 | 6.1 |
| Runnymede | 2,167 | 2.6 | 1,148 | 1.4 | 4,180 | 5.3 |
| Spelthorne | 3,099 | 2.9 | 1,624 | 1.5 | 5,398 | 5.3 |
| Surrey Heath | 3,103 | 2.8 | 1,419 | 1.3 | 6,478 | 6.1 |
| Tandridge | 2,895 | 3.2 | 1,335 | 1.5 | 5,371 | 6.3 |
| Waverley | 4,726 | 2.9 | 2,022 | 1.3 | 9,972 | 6.5 |
| Woking | 2,906 | 2.4 | 1,445 | 1.2 | 6,150 | 5.3 |
Source: OHID
Table 6 – The prevalence of Asthma, CHD and COPD across England, Surrey and the District and Borough Councils in Surrey.
These prevalences are shown on maps in Figures 20, 21 and 22
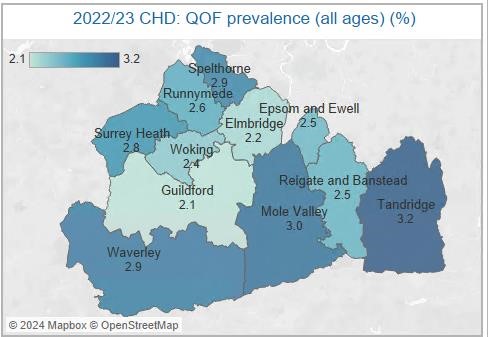
Fig 20 – The Districts and Boroughs map outlining the prevalence of CHD.
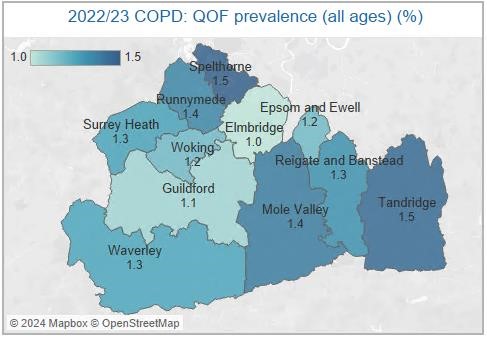
Fig 21 – The Districts and Boroughs map outlining the prevalence of COPD.
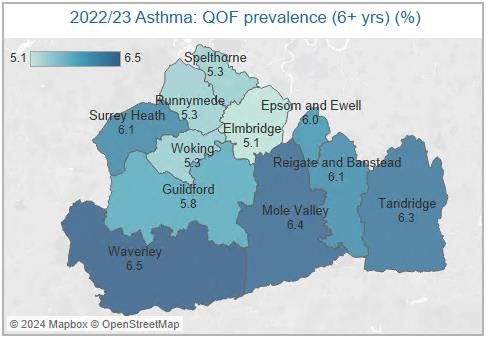
Fig 22 – The Districts and Boroughs map outlining the prevalence of Asthma.
Table 7 shows the prevalence of these health conditions which may be exacerbated by exposure to air pollution by PCN. The data shows:
- The prevalence of Asthma in Dorking PCN is higher than England, and both East Waverley and West of Waverley PCNs are higher than the overall Surrey prevalence.
- The prevalence of CHD in South Tandridge, West if Waverley, Banstead Healthcare, Dorking, Epsom, Leatherhead and Integrated Care Partnership PCNs are all higher than England.
- The prevalence of CHD in Healthy Horley, North Tandridge, East Waverley, Woking Wise 1, Surrey Heath and Farnham PCNs are all higher than the overall Surrey prevalence
- There are no PCNs with a prevalence of COPD higher than England, but Dorking PCN is the same as the England prevalence.
- The prevalence of COPD in Healthy Horley, North Tandridge, South Tandridge, COCO, SASSE Network 3, Banstead Healthcare and Leatherhead PCNs are all higher than the overall Surrey prevalence.
- Dorking PCN prevalence of all three conditions is above or equivalent to the England prevalence.
- South Tandridge, West of Waverley, Banstead Healthcare and Leatherhead PCNs all have CHD prevalence above England and either Asthma or COPD prevalence above the overall Surrey prevalence.
- Healthy Horley, North Tandridge and East Waverley PCNs all have at least two of the health conditions which may be exacerbated by air pollution higher than the overall Surrey prevalence.
| Area Name | Asthma (%) | CHD (%) | COPD (%) |
|---|---|---|---|
| East Surrey Place | 5.6 | 2.7 | 1.4 |
| Care Collaborative (Redhill) PCN | 5.8 | 2.3 | 1.3 |
| Healthy Horley PCN | 5.7 | 2.8 | 1.4 |
| North Tandridge PCN | 5.6 | 2.8 | 1.5 |
| Redhill Phoenix PCN | 5.3 | 2.3 | 1.2 |
| South Tandridge PCN | 5.5 | 3.2 | 1.5 |
| Guildford and Waverley Alliance | 5.6 | 2.6 | 1.1 |
| Central and North Guildford PCN | 5.2 | 1.9 | 1.2 |
| East Waverley PCN | 6.2 | 2.9 | 1.2 |
| Guildford East PCN | 4.7 | 2.3 | 0.7 |
| West of Waverley PCN | 6.4 | 3.4 | 1.3 |
| North-West Surrey Alliance | 4.7 | 2.4 | 1.2 |
| COCO PCN | 5.3 | 2.4 | 1.5 |
| SASSE Network 1 PCN | 3.9 | 2.3 | 1.1 |
| SASSE Network 2 PCN | 4.7 | 2.5 | 1.2 |
| SASSE Network 3 PCN | 4.6 | 2.5 | 1.4 |
| Walton Practices Confederation PCN | 3.9 | 2.1 | 1.0 |
| WB PCN | 4.7 | 2.4 | 1.2 |
| WHAM PCN | 4.8 | 2.3 | 1.1 |
| Woking Wise 1 PCN | 5.5 | 2.7 | 1.2 |
| Woking Wise 2 PCN | 4.6 | 2.1 | 1.2 |
| Woking Wise 3 PCN | 5.1 | 2.5 | 1.2 |
| Surrey Downs Health and Care Partnership | 5.7 | 3.1 | 1.4 |
| Banstead Healthcare PCN | 5.8 | 3.6 | 1.7 |
| Cobham and Oxshott PCN | 4.2 | 2.6 | 0.8 |
| Dorking PCN | 6.7 | 3.2 | 1.8 |
| East Elmbridge PCN | 5.3 | 2.4 | 1.0 |
| Epsom PCN | 5.7 | 3.1 | 1.3 |
| Integrated Care Partnership PCN | 5.6 | 3.2 | 1.2 |
| Leatherhead PCN | 5.8 | 3.7 | 1.5 |
| Frimley ICB | 5.6 | 2.7 | 1.3 |
| Surrey Heath PCN (population 95, 768) | 5.7 | 2.7 | 1.3 |
| Farnham PCN (population 41,505) | 5.5 | 2.7 | 1.3 |
Table 7 – The prevalence of Asthma, CHD and COPD across PCNs in Surrey.
Lived Experience survey
The Lived Experience survey on Surrey Says was open between 14 March and 11 May 2025 and was completed by 55 respondents across Surrey.
Tables 8, 9 and 10 provide the demographic data of age range, gender and length of time at current residence from the responses. Just over 50% of respondents were in the age ranges between 45 to 64 years (with all ages represented), just over 65% were female, and 60% had been in their current residence for more than 10 years.
| Age Range options | Total | Percentage (%) |
| 16-24 | 1 | 1.82 |
| 25-34 | 3 | 5.45 |
| 35-44 | 7 | 12.73 |
| 45-54 | 17 | 30.91 |
| 55-64 | 11 | 20.00 |
| 65-74 | 6 | 10.91 |
| 75+ | 6 | 10.91 |
| Prefer not to say | 4 | 7.27 |
| Not answered | 0 | 0.00 |
Table 8 – Age range demographic data.
| Genders options | Total | Percentage (%) |
| Male (including trans male) | 15 | 27.27 |
| Female (including trans female) | 36 | 65.45 |
| Non-binary | 0 | 0.00 |
| Other (not listed) | 0 | 0.00 |
| Prefer not say | 4 | 7.27 |
| Not answered | 0 | 0.00 |
Table 9 – Gender demographic data.
| Length of time at current residence options | Total | Percentage (%) |
| Less than 1 year | 0 | 0.00 |
| 1-5 years | 13 | 23.64 |
| 6-10 years | 8 | 14.55 |
| More than 10 years | 33 | 60.00 |
| Not answered | 1 | 1.82 |
Table 10 – Length of time living in current residence demographic data.
Respondents were asked about health issues they had experienced in the last 12 months in relation to air quality. Tables 11, 12 and 13 show that there was a wide range of health issues experienced by respondents with just over 27% considering air pollution to be the main or significant contributing factor. However over 85% were concerned about the health impacts of air pollution.
| Have you experienced any of the following health issues in the past year? | Total | Percentage (%) |
| Asthma | 14 | 25.45 |
| COPD (Chronic Obstructive Pulmonary Disease) | 3 | 5.45 |
| CVD (Cardiovascular Disease) | 1 | 1.82 |
| Allergies or sensitivities | 20 | 36.36 |
| Eye irritation | 24 | 43.64 |
| Headaches or migraines | 27 | 49.09 |
| Fatigue or low energy | 35 | 63.64 |
| Difficulty concentrating | 18 | 32.73 |
| None of the above | 10 | 18.18 |
| Not answered | 0 | 0.00 |
Table 11 – These health conditions are all linked to or exacerbated by air pollution.
| If you have experienced any of the issues in the above question, how much do you believe air quality is a contributing factor? | Total | Percentage (%) |
| 5 – main contributing factor | 8 | 14.55 |
| 4 – significant contributing factor | 7 | 12.73 |
| 3 – somewhat a contributing factor | 15 | 27.27 |
| 2 – minimal contributing factor | 12 | 21.82 |
| 1 – not a factor at all | 3 | 5.45 |
| Not applicable | 10 | 18.18 |
| Not Answered | 0 | 0.00 |
Table 12 – The level of contribution given to air quality on health conditions.
| Are you concerned about the potential health impacts of air pollution? | Total | Percentage (%) |
| Yes | 47 | 85.45 |
| No | 5 | 9.09 |
| Don’t know | 3 | 5.45 |
| Not answered | 0 | 0.00 |
Table 13 – Concern about the health impacts of air pollution.
Respondents were asked, using a free text question, why they thought air quality was a factor in their health issues. 52% of respondents that answered this question explained that they considered traffic to be the primary cause behind their health issues. The causes mentioned include:
- Traffic (15)
- Aircraft / airport (5)
- Log burners / bonfires (3)
- Local incinerators (2)
- Waste burning (legal and illegal) (2)
- Temperature (1)
- Pollen / hay fever (1)
Respondents were asked to describe what their concerns were relating to the health impacts of air pollution. There were a wide range of concerns with respondents mentioning that when they go into more rural areas, they find it easier to breathe and their conditions are less affected. The majority mentioned traffic congestion, specifically HGVs and an apparent lack of control on them. Some parents expressed concerns about idling traffic near schools and that using active travel routes in an AQMA makes breathing worse and exacerbates health conditions. Many are concerned that the air quality is getting worse, or they feel like the air quality in their specific areas is getting worse, and that their health will worsen and they may develop more conditions such as dementia and cancers.
Table 14 shows respondents’ awareness of air quality in their area, with more than half saying they were not aware of the air quality. For those residents that were aware of their local air quality, there were a range of methods in which people obtained information e.g. apps and websites, internet searches, local council sites, services such as AirTEXT and DEFRA. Some respondents said they can smell the difference or just by breathing they can tell the air quality difference. Some respondents stated they would like to see updates posted on Council social media pages.
| Are you aware of the air quality in your area? | Total | Percentage (%) |
| Yes | 25 | 45.45 |
| No | 30 | 54.55 |
| Not answered | 0 | 0.00 |
Table 14 – Awareness of air quality in respondents’ area.
Table 15 show how respondents rated their air quality with just over 23% describing it as good. No respondent described it is as excellent, and just over 30% described it as poor.
| How would you rate the air quality in your area overall? | Total | Percentage (%) |
| Excellent | 0 | 0.00 |
| Good | 13 | 23.64 |
| Fair | 25 | 45.45 |
| Poor | 17 | 30.91 |
| Not answered | 0 | 0.00 |
Table 15 – Respondent rating of their local air quality.
Table 16 shows that over 50% of respondents noticed a change in air quality during the pandemic between March 2020 and March 2021. This was a period when there were multiple lockdowns in the UK with traffic and aircraft movements severely restricted and monitoring data showed improved air quality across the country.
| Have you noticed any changes in air quality over the following time periods? | Total | Percentage (%) |
| April 2021 – Present day | 19 | 34.55% |
| March 2020 – March 2021 (during the pandemic) | 28 | 50.91% |
| Before March 2020 | 3 | 5.45% |
| No changes noticed | 15 | 27.27% |
| Not answered | 0 | 0.00% |
Table 16 – Respondents noticing changes in air quality during specific periods of time.
The survey gave respondents the opportunity to provide more details about what they noticed during the pandemic period, with 64% mentioning the following:
- Less traffic on the road.
- Air felt cleaner.
- Easier to breathe.
- Health issues eased.
- Couldn’t smell or taste exhaust fumes.
- It felt more peaceful and increased activity in local wildlife.
However, since April 2021 people are noticing that:
- Traffic feels worse.
- An increasing trend in the number of log burners being used, especially in colder months.
- More fly tipping causing rubbish smells in the air.
- Increase in health issues due to poor air quality.
80% of responses put traffic and congestion as the primary cause of air pollution in Surrey and had the following suggestions for improvement:
- Traffic congestion reduction such as reducing speed limits, less HGV’s and improving the flow of traffic in hotspots.
- More investment in buses and cycling infrastructure.
- More controls on wood burning and bonfires.
- More public information about air quality monitoring.
While the Lived Experience survey had a limited number of respondents compared to the population of Surrey, over 85% said they would sign up to a free air quality alert system such as airTEXT if it was available in their area, and just under 82% would be interested in learning more about air quality and its impact on health.
National context to address poor air quality
Air quality is a public health and environmental issue where poor air quality can lead to health problems and adversely affect the natural environment. The UK government has implemented a comprehensive framework to address air quality issues. These include legislation, strategies and initiatives designed to reduce emissions, enhance air quality monitoring, and promote public awareness and engagement.
Legislation
The following are the primary legal instruments and statutory guidance documents that shape air quality policy and regulation in England:
- Environment Act 1995
One of the early legislative frameworks addressing environmental protection, including provisions for pollution control, the Act sets out requirements for an annual Air Quality Status Report (ASR), Air Quality Management Areas (AQMA), and Air Quality Action Plans (AQAP). [44] - Air Quality (England) Regulations 2000 as amended by the Air Quality (England) (Amendment) Regulations 2002
These regulations implement air quality objectives under the Environment Act 1995 and set limits for key pollutants. [45] - Air Quality Standards Regulations 2010
These regulations transpose EU air quality directives into UK law, establishing legally binding pollutant limit values. [46] - Environment Act 2021
In a major update to environmental governance post-Brexit, this Act introduces legally binding environmental targets, including for air quality and smoke control areas, and the requirement for a local Air Quality Strategy where there are no AQMA in a Council area. [47] - The Environmental Targets (Fine Particulate Matter) (England) Regulations 2023
These regulations set long-term targets for reducing PM2.5 pollution for 2028-2040. [48]
National air quality strategy
The UK has a well-established framework for improving air quality built on two main pillars: emissions reduction and concentration control. The national air quality strategy outlines standards, objectives, and a range of measures aimed at reducing pollution and protecting public health and the environment.
Key Strategic Documents:
- Air Quality Plan for NO₂ in the UK (2017)
This plan was developed to meet EU air quality limit values for NO₂. It includes targeted actions for local authorities in areas where NO₂ levels exceed legal limits, particularly from road transport. [49] - Clean Air Strategy (2019)
A comprehensive strategy addressing all major sources of air pollution, including transport, industry, agriculture, and domestic sources. It aims to protect health, improve the environment, and support clean growth. [50] - Environmental Improvement Plan (2023)
This plan builds on the 25 Year Environment Plan and sets out how the government will deliver cleaner air, water, and biodiversity. It includes legally binding targets for air quality and outlines the role of local and national government in achieving them. [51] - Air Quality Strategy: Framework for Local Authority Delivery
This framework supports local authorities in implementing air quality improvements. It provides guidance on local responsibilities, funding opportunities, and how to align local actions with national targets. [52]
Guidance
A range of technical and policy guidance supports the UK’s air quality framework, helping local authorities, health professionals, and policymakers implement effective air quality management.
Key Guidance Resources:
- Air Quality Management (AQM) Policy and Technical Guidance
Published by DEFRA, this technical guidance supports local authorities in fulfilling their statutory duties under the Environment Act 1995 (as amended). It provides methodologies for air quality assessments, monitoring, and action planning. [53] - Air Quality Hub
Managed by DEFRA, the Air Quality Hub is a secure online platform offering tools, data, and resources for local authority air quality officers. Access is restricted to registered local authority representatives. [54] - Indoor Air Quality at Home – National Institute for Health and Care Excellence (NICE) Guidance
NICE provides evidence-based recommendations on improving indoor air quality in residential settings. This includes advice on ventilation, pollutant sources, and vulnerable populations. [55] - Committee on the Medical Effects of Air Pollutants (COMEAP)
Hosted by the UK Health Security Agency (UKHSA), COMEAP is an expert advisory committee that evaluates the health impacts of air pollutants. COMEAP reports inform national policy and public health guidance. [56] - National Planning Policy Framework
The National Planning Policy Framework (NPPF) emphasises the importance of improving air quality as part of achieving sustainable development. It requires local plans and planning decisions to consider the cumulative impacts of pollution on health and the environment, particularly in areas designated as AQMAs. [57]
Promoting public awareness and engagement
Raising awareness within local communities about air quality health impacts and how to reduce them is a key component of the national strategy. This includes promoting active travel, public transport, and cleaner fuels.
The Chief Medical Officers (CMO) report
The CMO’s Annual Report 2024, “Health in Cities” [58], addresses various health challenges and opportunities in urban environments. Air quality is highlighted as a significant concern due to its impact on public health, particularly in densely populated areas.
Key findings and recommendations on air quality:
- Health Impacts: The report emphasizes the adverse health effects of poor air quality, including increased rates of respiratory and cardiovascular diseases. It notes that air pollution is a major contributor to premature deaths in cities.
- Sources of Pollution: Urban areas face higher levels of pollution from traffic, industrial activities, and domestic heating. The report identifies these sources as critical targets for intervention.
- Monitoring and Data Collection: Enhanced air quality monitoring and data collection are recommended to better understand pollution patterns and inform policy decisions. The report suggests expanding the network of air quality sensors in cities.
- Public Awareness: Increasing public awareness about the health risks associated with air pollution and promoting behavioural changes, such as reducing car use and adopting cleaner technologies, are key strategies.
- Policy and Regulation: The report calls for stricter enforcement of existing air quality regulations and the development of new policies to reduce emissions from vehicles and industrial sources.
- Green Spaces: Promoting the creation and maintenance of green spaces in urban areas is recommended to help mitigate air pollution and provide residents with areas for physical activity and relaxation.
These recommendations aim to improve air quality in cities, thereby enhancing public health and overall quality of life for urban residents.
Air quality information system (AQIS) review
The AQIS review [59] was conducted by DEFRA and the UKHSA to improve the provision of air quality information to the public. This review was initiated following the inquest into the death of Ella Adoo-Kissi-Debrah [60], highlights the need for better air quality information and communication systems. The purpose of the AQIS review was to assess and improve the strengths and limitations of current air quality information systems. The key findings and recommendations are as follows:
Key Findings:
- Technical Capabilities: The UK has advanced air quality monitoring networks and modelling capabilities, but these are not fully utilized for public benefit.
- Public Awareness: There is a lack of public awareness and understanding of air quality information, often due to technical language and insufficient communication channels.
- Health Advice: Current health advice related to air quality is outdated and needs to be aligned with the latest clinical evidence.
- Behaviour Change: There is little evidence that individuals change their behaviour based on air quality information, indicating a need for better communication strategies.
- Target Audiences: Specific groups, such as those with lower socioeconomic status and ethnic minorities, experience higher exposure to air pollution and need targeted information.
Recommendations:
- Outcome-Based Communication: Focus on clear, actionable information that drives behaviour change.
- Accessible Language: Use simple, consistent language and proactively disseminate information across various channels.
- Co-Benefits: Communicate the additional benefits of actions taken to improve air quality.
- Communications Strategy: Develop a multi-year strategy to raise public awareness and promote actions to protect health and reduce pollution.
- Education: Strengthen air quality education in schools and upskill healthcare professionals to provide appropriate advice.
- Indices and Advice: Update the DAQI and develop a long-term air quality statement.
- Alerts System: Review and expand the existing air quality alerts system.
- Review and Evaluation: Continuously develop air quality information based on expert advice and evaluate the effectiveness of implemented changes.
Local context to address poor air quality
Surrey Air Alliance (SAA)
The SAA was first set up in 2012 as a follow on from the Surrey Air Quality Group which was exclusively environmental protection specialists. SAA meets quarterly and reports to the Surrey Environmental Health Managers Group. Members of SAA include representatives from the 12 local authorities covering environmental health (air quality specialists), public health, schools, travel, transport planning, and highways. National Health Service (NHS), National Highways, Environment Agency and invited speakers also attend.
Vehicle emissions remain as the predominant source of air pollution across Surrey, but other sources include fixed domestic and commercial sources along with permitted processes covered by the Environmental Permitting Regulations 2016. There have been several projects undertaken by SAA over the years and most notably include:
- The Surrey Schools Project in 2019/20 which reached out to primary school children and included a road show.
- In 2019 detailed modelling of the whole of Surrey was commissioned from Cambridge Environmental Research Consultants (CERC) covering named pollutants and contained detailed health data.
- The Global Centre for Clean Air Research at University of Surrey has involved SAA members in their work and the mutual support has been very rewarding. [61]
SAA main areas of focus include:
- Annual Status Reports (ASR) are submitted to DEFRA in June for the previous monitoring year. Officers compare and share good practice but also consult other disciplines including public health and highway authorities.
- From 1st February 2026 there are currently 26 Air Quality Management Areas (AQMA) across 8 local authorities in Surrey, ranging from the whole borough to small localities of 3 houses. With improving levels of NO2 (traffic related) it is likely that a number may be revoked within the next two to three years. However, in some areas Air Quality Action Plans are still required and for example Guildford Borough are undertaking an Economic Feasibility Study on a potential Low Emission Zone.
- The Surrey County Council (SCC) Schools Travel Team are engaging pupils and parents across the county in 98 schools which have the Eco-Schools Green Flag award. It is estimated that many thousands of pupils are participating and most importantly promoting a culture of preventing emissions and other greener practices at an early age.
- The Greener Futures Team at SCC have been promoting several schemes, notably the National Highways, Electric Town and Cities Project A3 Guildford, which ran for the last year (until 30 September 2024) to promote electric vans. Unfortunately, this was unsuccessful due to the low uptake. The Active Travel scheme for businesses will remain in place with funding up until September 2025.
- Air quality and planning are very important allies and SAA have adopted guidelines including the Institute of Air Quality Management: Land-use Planning and Development Control: Planning for Air Quality. [62]
- In October 2024 a new air pollution warning system was introduced replacing airAlert. Six authorities currently subscribe to airTEXT with the potential for more.
- SCC are continuing to progress with providing on street EV charging points and are an excellent point of reference for the other partners in terms of protocol and installation.
- SAA has supported the January Clean Air Night campaign for the last two years, and Clean Air Day in June for many years. Clean Air Night focuses on the impacts of domestic wood-burning on air quality which is relevant to Surrey with many making wood-burning a lifestyle choice, a very high concentration on trees across Surrey and several Smoke Control Areas.
- In 2026 SAA will revisit the Surrey wide modelling exercise which produced the detailed maps in 2019 covering named pollutants and detailed health data.
- Seven local authorities will commence the Electric Taxi Project in 2025 which is supported by a DEFRA grant and funding from SCC Public Health.
Clean Air Night [63] happens towards the end of January every year and aims to raise public awareness about the health and environmental impacts of wood burning with the objective of ensuring people can make informed decisions about how they heat their homes.
Clean Air Day [64] occurs around the middle of June every year and aims to raise awareness about the impact of traffic and vehicles emissions on health and environment, to encourage people to leave the car at home and cycle to work or take public transport.
Aether – AQ for Schools programme [65] works in partnership with SCC, SAA and London Sustainability Exchange. It is a DEFRA-funded project that aims to educate children of all ages on the causes and impacts of air pollution and how it can be reduced.
airText [66] airTEXT is a free independent service for the public providing air quality alerts by SMS text message, email and voicemail and 3-day forecasts of air quality, pollen, UV and temperature across Greater London and parts of Surrey (Elmbridge, Mole Valley, Reigate and Banstead, Runnymede, Spelthorne, and Tandridge). Residents, particularly those with chronic respiratory and circulatory conditions, can sign up for this free service at airTEXT/sign-up.
SAA CERC modelling information
The SAA, comprising the District and Borough Councils in Surrey, commissioned CERC to carry out a comprehensive modelling exercise of roadside concentrations of NO₂, PM10 and PM2.5 across Surrey in 2017. The results, published in 2019, are available online as a map of the entire county [67] and estimated the cost of the health impact of air pollution across the county to be between £283 and £345 million. SAA is planning further county-wide modelling by CERC in 2026.
District and Borough Councils in Surrey
Elmbridge Borough Council
Introduction
The main air pollutants of concern within Elmbridge relevant to local air quality management are NO2, PM10 and PM2.5. The Council have a combination of three real time monitoring stations and over 40 passive diffusion tubes monitoring these key pollutants. Two real time stations measuring NO2 and one measuring particulates. The passive diffusion tubes measure NO2.
Real time NO2 levels can be viewed at Hampton Court Parade, East Molesey and Weybridge High Street as well as particulate levels in Esher High Street on UK Air Quality [68]. Figure 23 shows the monitoring locations within Elmbridge.
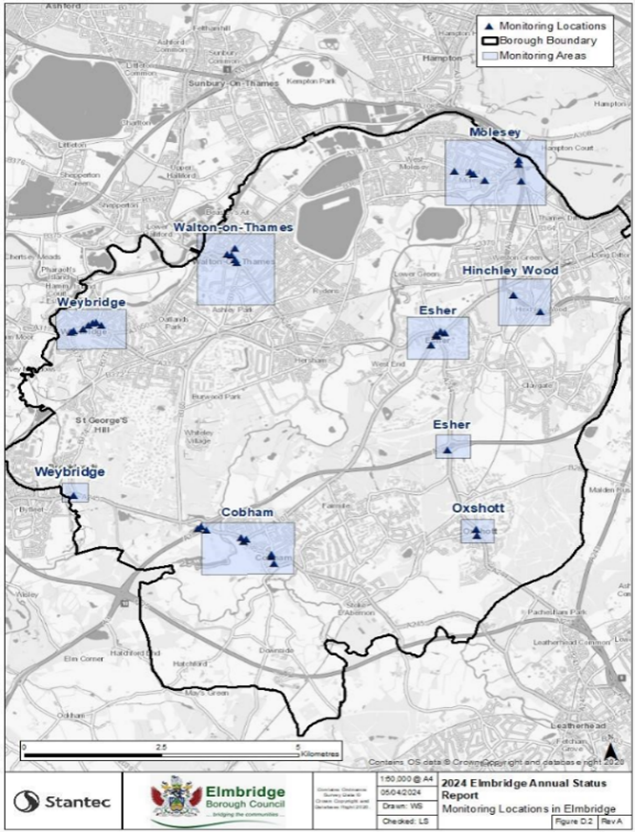
Fig 23 – A map of monitoring locations in Elmbridge.
Elmbridge report air quality monitoring results and progress on action to improve air quality as detailed within the Councils AQAP 2021-26 in the ASR which is submitted to DEFRA each year. Current and historical ASRs can be viewed online. [69]
The ASR Executive Summary provides a clear update on the borough’s key pollutants and what actions are being used to address them within the local authority’s sphere of control.
Trends over last 10 years
In terms of NO2, levels have fallen over the last ten years and the ASRs show the reduction within AQMAs. Cobham AQMA has been revoked due to falling levels of NO2. There remain six AQMAs in 2025. Details on the reductions are displayed within charts in the ASRs.
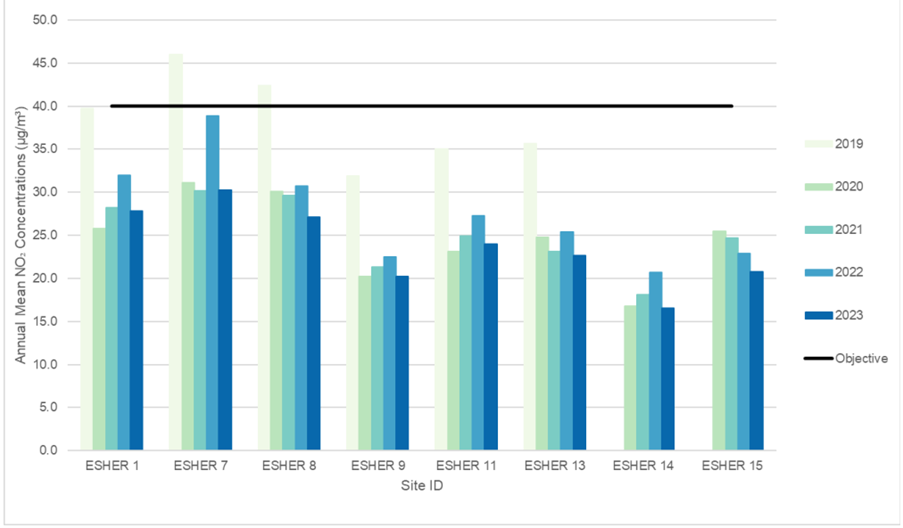
Fig 24 – An example of the trends in NO2 over the period of 2019-2023.
Figure 24 shows that levels are now below the pandemic levels, showing great progress in reducing NO2 levels. For more information on monitoring sites, please see the ASR mentioned below.
Annual Status Report (ASR) and Highlights
The ASR executive summary provides a clear update on the boroughs key pollutants and what actions are been used to address them within the authority’s sphere of control. [70]
The ASR shows the previous year’s monitoring data and updates on the air quality actions contained in the AQAP.
Air Quality Management Area (AQMA)
As of January 2025, there are 6 AQMAs within Elmbridge, declared due to exceedances of the annual mean concentration for NO2 of 40µg/m3. The AQMAs are, Weybridge High Street, Esher High Street, Hinchley Wood, Walton High Street, Hampton Court and Walton Road Molesey.
Air Quality Action Plan (AQAP)
Elmbridge AQAP 2021-26 is due for updating in 2026 should any AQMA’s remain. If all AQMAs are revoked by 2026/7 an Air Quality Strategy (AQS) will be produced.
The AQAP priorities for delivering compliance within the AQMAs, and improving air quality across Elmbridge are:
- Priority 1 – reducing NO2 levels with Elmbridge AQMAs to below the objective in the shortest time practicable.
- Priority 2 – targeting PM2.5 through a range of interventions with the aim of reaching the WHO recommended level of 10 µg/m3 by 2030 within Elmbridge.
- Priority 3 – modal shift to more sustainable transport.
- Priority 4 – ensuring air quality continues to be a priority within the Council’s policies and those of SCC and assist in delivering the projects and actions.
- Priority 5 – partnership working as part of the SAA to improve Surrey’s air quality.
The Council launched The Elmbridge Vision 2030, for a sustainable, thriving Elmbridge driven by the power of its community. Sustainability is at the heart of the vision and Elmbridge’s AQAP 2021- 2026 is integral to the commitment for sustainability and enhancing the natural environment. [71]
Air Quality Strategy (AQS)
Elmbridge do not currently have an AQS.
Strategies to Improve Air Quality – Current and Future
Elmbridge is an active member of the SAA supporting schools air quality projects, electric taxi trial, move to airTEXT, asthma project with Surrey Heartlands and Clean Air Day and Night campaigns.
Elmbridge supports a broad range of interventions to seek improvements in local air quality that include planning polices design code, licensing policy to improve emissions from the taxi and private hire fleet by January 2026, implementation of Local Cycling and Walking Infrastructure Plan (LCWIP), increasing the provision of off-street EV charge points, and a green fleet strategy for the Council vehicles.
In addition to the continued evolution and implementation of existing policy, strategy interventions include:
- Investigate declaring the entire borough a smoke control area.
- Continued targeting of airTEXT services to those residents and visitors with heart and lung conditions and extending the service to those vulnerable to poor air quality.
- The council vision 2030.
Climate Change Strategy
In July 2019, Elmbridge declared a ‘Climate Emergency’ and have pledged to act locally to contribute to national carbon neutral targets through the development of policies and practices, together with the aim of making the Council a carbon neutral organisation by 2030. The Council has adopted its Carbon Management and Reduction Plan to assist in the delivery of this commitment.
The Council launched ‘The Elmbridge Vision 2030’, for a sustainable, thriving Elmbridge driven by the power of its community. Sustainability is at the heart of the vision and the AQAP 2021- 2026 is integral to the commitment for sustainability and enhancing the natural environment. There are number of carbon reduction measures proposed as part of these plans and strategies which will also benefit air quality, including the installation of electric car charging points in the key Council car parks and encouraging the use of sustainable transport modes.
The sustainable Elmbridge hub includes a ‘Clean air’ page that provides more detail about the ways residents can reduce the air pollution that they produce, focusing on electric transport, active travel, utilisation of public transport, car sharing and open fires and wood-burning stoves. [72]
Public Information on Local Air Quality
The Council’s website provides a broad range of information on monitoring results, advice on how residents can improve their local air quality both outdoor and indoor. New bespoke animation targeting what residents can do to protect / reduce their exposure to particulates. [73] Air quality is part of the Elmbridge Sustainable Hub. [74]
Epsom and Ewell Borough Council
Introduction
NO2 from road transport emissions have traditionally been the main concern in Epsom & Ewell and this is consistent with the picture in much of the surrounding areas. Over the last decade a gradual decline in NO2 has been noticed arising from improvements in the vehicle fleet, in respect of the legacy AQMA in Ewell, and partnership work to tackle air quality. It is anticipated the focus will move to particulate pollution which is much more regional in nature, and something not easily tackled locally.
Trends over last 10 years
Data and graphical representations can be found in the ASRs. Trend information is also portrayed in Figure 25, which highlights a gradual improvement in NO2 levels.
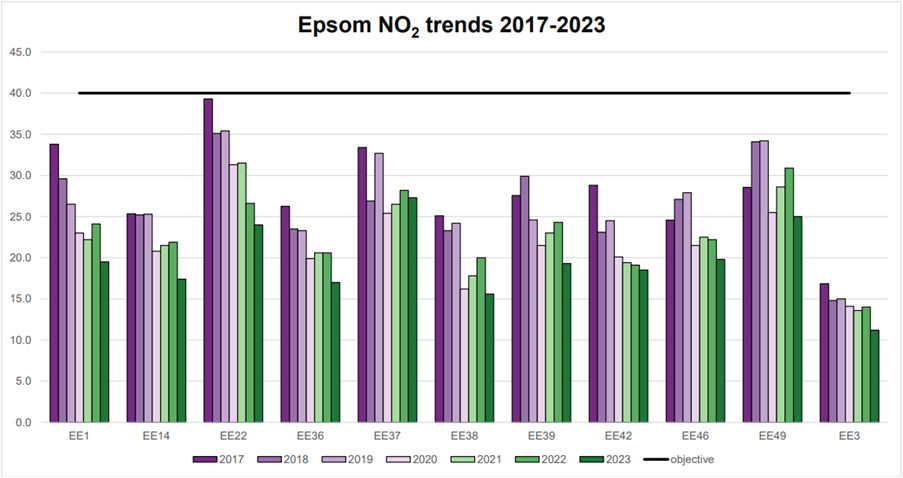
Fig 25 – The trends in NO2 over the period of 2017-2023.
Further monitoring sites can be found on the Council website under ASR.
Annual Status Report (ASR) and Highlights
The 2024 Epsom & Ewell Air Quality ASR highlights that air pollution is primarily linked to road traffic, with NO₂ being the main pollutant of concern. Due to the absence of large industrial or agricultural sources, the Council focuses on reducing NO₂ in residential areas and continues to monitor air quality at multiple sites. [75]
Air Quality Management Area (AQMA)
From January 2026 the AQMA declared for NO2 annual mean located in Ewell Village has been revoked. There are currently no active AQMAs in Epsom and Ewell.
Air Quality Action Plan (AQAP)
The AQAP is legacy from 2010, and all viable actions have been delivered. For information, please see the Further Assessment of NO2 in Ewell High Street report on the Epsom & Ewell website. [76]
Air Quality Strategy (AQS)
Epsom and Ewell do not currently have an AQS in place.
Strategies to Improve AQ – Current and future
Epsom and Ewell has a wider range of climate change measures including the roll out of EV charging in its car parks and planning policies designed to promote EV usage. Additionally, the roll out of energy efficiency measures on Council buildings reduces energy demand and in particular, local gas combustion and energy demands generally.
Supportive of collective action and promotion of ‘Action Surrey’ [77] to low-income families. This is based around wider health benefits such as excessive cold and fuel poverty but has positive impacts on local domestic combustion emissions.
Climate Change Strategy
Epsom & Ewell committed to tackling climate change in 2019 and aims to become carbon neutral by 2035. Its updated ‘Climate Change Action Plan’ (2025–2029) builds on earlier progress, focusing on reducing emissions from Council operations, promoting energy efficiency, expanding solar installations, and engaging the community through education and sustainable practices. [78]
Public Information on Local Air Quality
The Council’s website is the main source of information on the Epsom and Ewell website. [79]
Guildford Borough Council
Introduction
NO2 is the main pollutant of concern in Guildford Borough, particularly in areas where the receptors are situated near busy roads that are connected to or form part of the strategic road network.
In rural areas, the background annual average concentration of NO2 is approximately 10µg/m3. In urban settings the annual average background NO2 levels range from 15-25µg/m3, higher concentrations closer to the road emission sources. [80] In the Guildford borough, the main source of emissions is road traffic as four major roads pass through the borough. The M25 enters the borough briefly at Junction 10 (Wisley), which links to the A3 London to Portsmouth trunk road. The A3 runs from north to south through the borough, linking with the A31, which joins the A331 Blackwater Valley Road. A high proportion of traffic in Guildford town comprises of through-traffic on these strategic roads. However, Guildford town is also a popular destination, being home to over 7000 businesses and 80,000 employees.
Guildford is a university town, with a strong educational and research base at the University of Surrey and Surrey Research Park which are identified as important transport destinations.
In Guildford, smoke control orders established five smoke control areas (SCAs) between 1972 and 1978, prohibiting smoke emissions from chimneys of properties within these areas. Given the rising popularity of wood burners and the expansion of residential developments beyond the SCAs, there is a growing need to consider creating additional SCAs.
Trends over last 10 years
Figure 26 shows a 10-year steady downward trend for NO2 in the background locations and Compton AQMA, despite lots of annual variations. The monitoring locations are available on the Guildford website. [81] The 2023 NO2 levels are now dropping back to levels seen during the pandemic and are below the UK target.
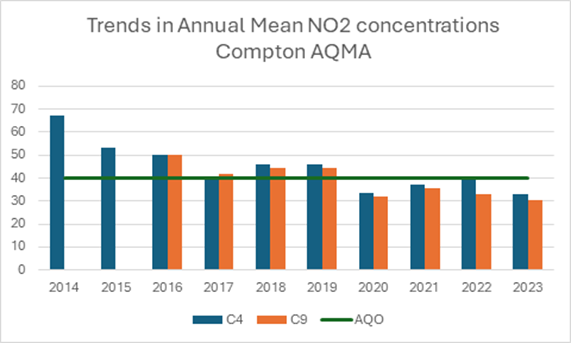
Fig 26 – An example of the trends in NO2 over the period of 2014-2023.
Annual Status Report (ASR) and Highlights
The Executive summary in the ASR report [81] highlights on all the important aspects:
- Air quality issues in Guildford.
- How to get involved.
- Actions taken in the past years to improve air quality.
- Priorities for next year.
A fully funded active travel initiative is available for businesses in Guildford whose employers are likely to use the A3 on a frequent basis. The scheme is funded by the National Highways, project managed by Guildford Borough Council and Surrey County Council and implemented by Velocity Transport Planning in conjunction with easitGUILDFORD A3. [82]
Air Quality Management Area (AQMA)
Guildford has the following AQMAs:
- The Street, Compton – NO2 annual mean.
- A281, The Street, Shalford – NO2 annual mean.
- Guildford Town Centre – NO2 annual mean.
For further information, please visit the Guildford website. [81]
Air Quality Action Plan (AQAP)
Guildford has AQAPs in place for each of its AQMAs detailed below:
- The Street, Compton AQAP identified a single measure which was feasible at the time and has been implemented. The NO2 levels at Compton have been compliant for 4 years (including the year impacted by the pandemic). There are further traffic calming measures proposed by Surrey County Council Highways. Therefore, air quality studies to assess the impact of these measures may be considered necessary, however a full review of the AQAP is not considered necessary at this stage. [83]
- The Shalford AQAP is now due for review and is combined with economic feasibility study of potential air quality actions in the Guildford Town Centre and the Shalford AQMA. [84]
- A feasibility study for Guildford Town Centre of potential air quality actions is currently underway and likely to be completed and submitted for DEFRA’s approval in late 2025. [85]
Air Quality Strategy (AQS)
The Guildford AQS 2017–2022 (currently under review) outlines the Council’s commitment to improving air quality through targeted actions, including reducing pollutant concentrations and public exposure. It emphasises partnership working across council departments, external agencies, and the community, aiming to support protecting the public’s health, sustainable development, and environmental protection [86].
Strategies to Improve AQ – Current and future
Guildford hosted its first Cleaner Air Day on Sunday 29th September 2024 [87]. Similar events have previously been organised such as Guildford’s car-free day. Funded by the UK Shared Prosperity Fund, people had the chance to trial e-bikes, hear from the experts at the University of Surrey about how to do more to tackle air pollution, find out about the North Street Guildford development plan, speak to the Guildford Environmental Health Officials about their air quality concerns, and various other initiatives.
Clean Air Night in January 2025 marked the second year of the Clean Air Night Campaign, with Guildford participating as a supporter for the second consecutive year as part of SAA. The campaign aimed to raise awareness about the effects of wood burning on indoor air quality and health as part of its commitment to supporting the event. A news release was sent to local media and published on the Guildford website. [88]
- The Lead Councillor for environment and climate change gave an interview to ‘That’s TV’.
- Posted a series of updates on Facebook as part of the campaign.
- Featured the event in the Guildford Council staff newsletters and Councillor updates.
The Guildford Borough Local Plan: Strategy and Sites 2015-2034 [89] outlines the framework for development and land use emphasising sustainable development, climate change mitigation, and enhancing the quality of life for residents. The plan integrates various policies aimed at balancing economic growth, social development, and environmental conservation. Key elements include sustainable design and construction, the promotion of renewable energy, and the development of sustainable transport systems.
The following proposed projects are being considered or are in progress:
- review of existing smoke control areas.
- A £256k DEFRA-funded Surrey EV taxi project is currently in procurement stage which will provide grants to promote EV taxis and private hire vehicles within 7 participating local authorities across Surrey, including Guildford.
- Subject to resources, it is proposing to put in anti-idling policy for the Council owned properties and staff.
- As part of the town centre feasibility study, it is informally looking at work-place car park levy.
- National Highways are undertaking several projects associated with A3 Guildford and several measures are proposed.
Climate Change Strategy
Guildford do not have a climate change strategy. However, a climate change action plan has been adopted following a review of the SCC climate change strategy and subsequent greener future delivery plan. Some of the key priorities and targets for the climate change action plan include focusing on:
- climate change funding
- organisational governance emissions reduction
- transport, active travel and air quality
- renewable energy generation
- built environment
- waste and resources
- land use and adaptation/green and blue infrastructure
- improving communications and digital connectivity
- supporting borough-wide initiatives
It is designed to link to and complement many other existing policies and strategies, including the Guildford AQAS and AQAPs.
Public Information on Local Air Quality
Guildford air pollution webpage provides a range of public information [90].
Mole Valley District Council
Introduction
The main sources of air pollution affecting Mole Valley are NO2 and PM, caused from vehicle emissions on busy roads in the district, such as the A24, A25 and the short section of the M25 across the northern boundary.
Furthermore, Gatwick airport lies just over the boundary to the south of the district and emissions from aircraft contribute to the background pollutant concentrations in the neighbouring wards.
Trends over last 10 years
The trend over the previous 10 years has seen a gradual decrease in the levels of NO2 across Mole Valley at all the diffusion tube monitoring sites.
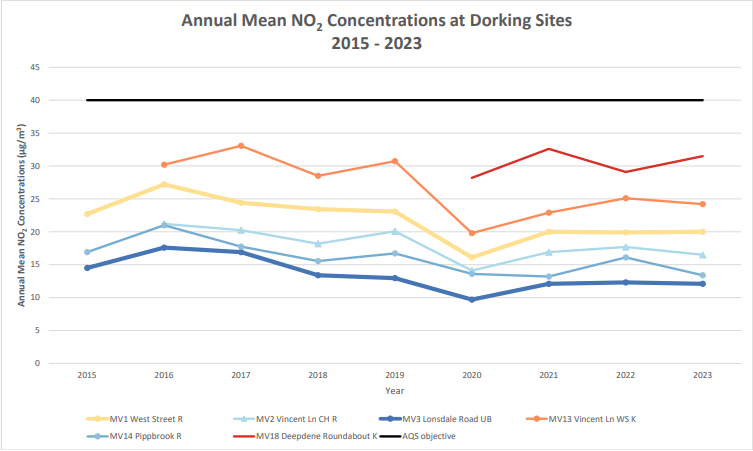
Fig 27 – The trends in NO2 over the period of 2015-2023.
Figure 27 shows there have been a steady decline in the levels of NO2 with notable decreases being during the pandemic and the lockdowns that reduced the traffic sources of air pollution during that period.
ASR (Annual Status Report) and Highlights
The 2024 Mole Valley Air Quality ASR highlights that air quality in the district is generally good, with road traffic, particularly from the M25, A25, and A24, being the main source of air pollution. The report emphasizes the health impacts of pollutants like NO₂, PM₁₀ and PM₂.₅, and outlines the Council’s ongoing monitoring efforts and commitment to protecting vulnerable populations [91].
AQMA (Air Quality Management Area)
Mole Valley does not currently have any areas requiring an AQMA.
AQAP (Air Quality Action Plan)
As Mole Valley does not currently have any AQMAs there is no requirement to have an AQAP.
AQS (Air Quality Strategy)
Mole Valley is committed to making the district a vibrant place to live, work and enjoy and appreciates that good air quality is an essential part of achieving this.
Its reporting provides an overview of air quality across the district and focuses on the elements of work specifically carried out by the Environmental Health service to improve air quality in the district. The Mole Valley Air Quality Strategy also sets out initiatives being implemented in the district, led by other departments in the Council as well as initiatives covering the whole of Surrey that are overseen by SCC [92].
Strategies to improve AQ – Current and Future
As well as the airTEXT service in partnership with CERC and some other local authorities in Surrey and clean air day/night campaigns, there has been a roll out of EV charging points across some of the Mole Valley owned car parks, including the one at the Council offices.
A survey was carried out amongst Mole Valley employees to gauge interest for an EV salary sacrifice, with 32 respondents (approx. 10% of employees) expressing a definite interest in the scheme.
It is proposed that a further roll out of EV charging points is to be provided throughout the district to add to the 90 already in Mole Valley owned car parks, although there are no details currently available as to when this is likely to happen or additional charging point numbers.
It is hoped that an uptake in EVs will see a continued reduction in NO2 throughout the District as a whole, and whilst not ward specific, will reduce NO2 levels across the district.
Climate Change Strategy
Mole Valley declared a climate emergency in 2019 and aims to become carbon neutral by 2030. The Mole Valley Climate Change Strategy and action plan focus on reducing emissions from council operations, promoting energy efficiency, supporting sustainable transport, and engaging the community through education, behaviour change, and adaptation initiatives. [93]
Public Information on local Air Quality
At the request of its members, Mole Valley provides monthly monitoring results for NO2 from the 19 sites it has across the district (although it must be noted that these results are provisional before adjustments are made). It also has a Frequently Asked Questions /information page on its webpage [92] providing information and advising what residents can do to improve air quality and providing tips about using wood burning stoves and having bonfires.
Mole Valley also subscribes to the airTEXT service.
Reigate and Banstead Borough Council
Introduction
The key regulated pollutant of concern in the Reigate and Banstead remains NO2 primarily from road traffic, but in the south of the Borough from a combination of road traffic and aircraft emissions. Over the longer term the growth in aircraft emissions has the potential to offset the fall in road traffic emissions.
Reigate and Banstead also fails to meet the UK standard for O3 and has done for several years. While measures to reduce O3 rest with central rather than local government, the Council has noted a possible uptick in O3 concentrations in the past couple of years following a decade in which they were largely unchanged.
The other major pollutant of concern in the south of the Borough is PM0.1 (ultrafine particles). While this pollutant is unregulated residents near to Gatwick airport experience average PM0.1 concentrations that are equivalent to living kerbside on Marylebone Road (a 6-lane road) in central London and experience more days / hours that are classed as ‘high’ by the World Health Organisation than recorded at the London site (based on 2019 data).
The high concentration of PM0.1 is driven largely by aircraft emissions and given the forecast growth at Gatwick airport with and without the use of the emergency runway, this is likely to be a significant issue for residents for the next 20+ years.
Trends over last 10 years
In terms of background and road traffic sites the overall trend in NO2 concentrations from 2012 onwards has been one of steady improvements. There was a significant improvement during the pandemic which has since been lost, but despite the increase in NO2 levels post the pandemic, the overall trend 2019 to 2023 has largely been a continuation of the overall downward trend.
Near Gatwick Airport the overall trend has also been downwards as can be seen in Figure 28.
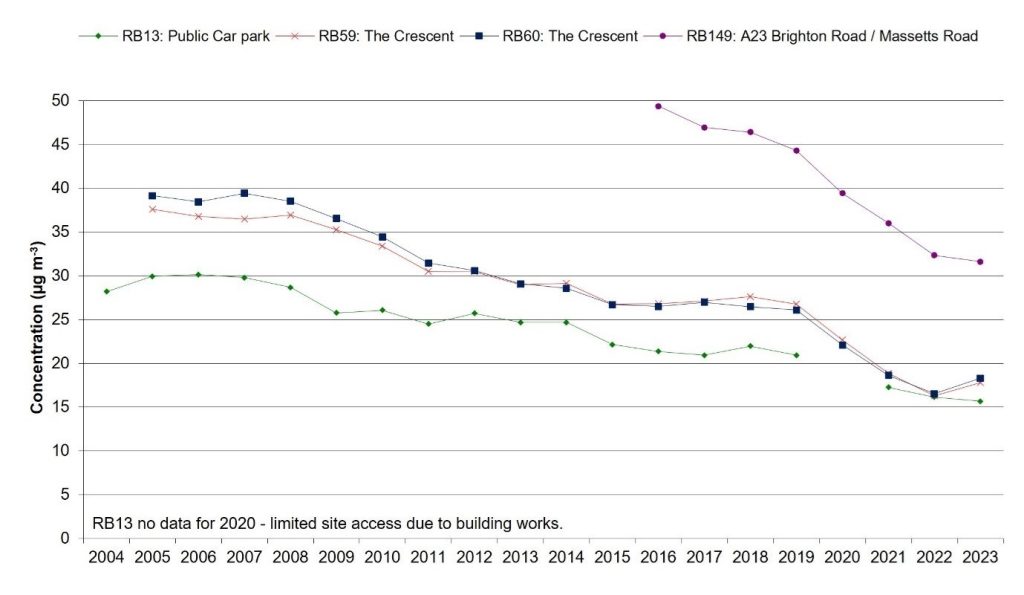
Figure 28: Three years rolling mean NO2 concentrations – Horley AQMA.
For more information, including data and graphs outlining PM2.5 and PM10 please refer to the ASR section mentioned below.
Annual Status Report (ASR) and Highlights
Reigate and Banstead ASR can be found on the Council website, [94] with the work on PM0.1 at page 24 onwards of the November 2024 report.
Air Quality Management Area (AQMA)
Reigate and Banstead had a total of 9 AQMAs at the start of 2025, but following a review in 2024 this numbers has reduced to two during 2025. All the AQMAs were declared due to breaches of the UK annual average standard for NO2 due to road traffic air pollution, and in the case of the Gatwick AQMA a combination of road traffic and aircraft air pollution. The two current AQMAs are:
- An area of south Horley near to Gatwick Airport (AQMA Order 3)
- A23 Hooley (AQMA Order 13)
The Gatwick AQMA is to remain as a precautionary measure as while the UK air quality standards were met in 2023, the airport is not yet back to its pre-pandemic capacity, and there was considerable uncertainty around the values, where the original breach of the standard was occurring up to 2019, in the modelling work undertaken by Gatwick airport as part of their Development Consent Order (DCO).
The Hooley AQMA is also to remain for now as while levels of NO2 are falling, they have not been low enough for long enough to be considered compliant.
The AQMAs that were revoked in 2025 were:
- Along the M25 (AQMA Order 1)
- An individual property on the A217 near Blackhorse Lane (AQMA Order 6)
- Junction of the A2022, A240, B291 (Drift Bridge) in Banstead (AQMA Order 8)
- Reigate High Street, including sections of Church Street, Bell Street, West Street, and London Road (AQMA Order 9).
- A23 Merstham High Street (AQMA Order 10)
- A217 Reigate Hill (AQMA Order 11)
- A23 / Redhill Town Centre (AQMA Order 12)
While the AQMAs were revoked because the UK standard of 40 µg m-3 is now being met it is important to note the EU and WHO standards (which 25 years ago were the same as the UK standard) are now 20 µg m-3 and 10 µ m-3 respectively, and while some of these former AQMAs are close to meeting the EU standard, none meet the WHO health based standard. As a result, monitoring and more general work to reduce air pollution from road traffic will continue in these areas and more broadly across the Borough.
Air Quality Action Plan (AQAP) and Air Quality Strategy (AQS
The draft AQAP and AQS were produced in 2024 and consulted on and adopted in 2025 with the next review due in 2030. [89]
Strategies to Improve Air Quality – Current and Future
The primary focus for reducing NO2 levels is to encourage the uptake of EVs, primarily through the provision of charge points so that the lack of charging facilities is not seen as a barrier to EV ownership. This is being done via a phased roll out to the Council car parks, in conjunction with SCC and connected kerb who are rolling out on street charging especially in areas where the houses have limited off road parking. The key neighbourhoods in Reigate and Banstead are Hooley, Netherne, and Merstham. The EV proposals have a direct benefit for all three areas, and some of the initial on street chargers are planned for Merstham.
Work is also underway as part of an ongoing programme to make homeowners aware of the issues around wood burning and that the Council’s preference is for people not to install wood burning stoves where mains gas is available, to prevent an increase in PM concentrations especially in residential areas.
In terms of PM0.1 air pollution, Reigate and Banstead is working with the Environment Agency, DEFRA, and the National Physical Laboratory on a long-term monitoring programme in the vicinity of Gatwick airport. This work is to quantify residents’ exposure, both in terms of particle number and the size distribution of those particles, to understand the extent to which aircraft and road traffic are responsible, how this balance changes with time and the impact of sustainable aviation fuel. This work is intended to help inform UK policy on PM0.1.
Reigate and Banstead operates the airTEXT service to warn people of elevated air pollution levels that might give rise to acute health impacts.
Any future projects will generally fall under the key areas listed above and will be implemented as and when funds are available. One area of interest at present is to understand the extent in practice of broken emissions abatement technology (which the vehicle owner may not be aware of) and the extent to which devices are being used. An outline project has been developed for the Hooley AQMA and the Council is now looking at funding sources.
Climate Change Strategy
Reigate and Banstead does not have a stand-alone climate change strategy as this forms part of the Council’s Environmental Sustainability Strategy 2024 [95]. Air quality is considered within the strategy and was discussed with environmental health before the strategy was produced. All the main measures in the strategy would have a direct benefit to local air quality, for example electrification of the Council’s vehicle fleet.
Public Information on Local Air Quality
For residents with respiratory problems Reigate and Banstead offers the airTEXT service.
For members of the public who want detailed information from the real time monitors this can be downloaded from the ‘Air Quality in England’ website [96] where you either select Reigate and Banstead from the drop-down box or zoom in on the map.
Gatwick Airport
While the majority of NO2 air pollution in Surrey where concentrations are elevated is normally associated with road traffic, there are some areas of the county i.e. near airports such as Gatwick, where NOx emissions from aircraft also make a significant contribution to residents’ NOx pollution exposure.
Over the next decade NOx air pollution from road traffic is forecast to fall significantly but with airport expansion and the use of larger aircraft not all the improvements, due to reduced road traffic and reduced regional background air pollution, will feed through to residents where there is a significant aviation component to the local air pollution.
The impact of this can be seen at some sites on the Horley Gardens Estate near Gatwick airport where the headline NO2 concentrations are falling, but this is driven primarily by falls in the non-airport background concentration and non-airport road traffic air pollution.
There are also falls in the airport related road traffic air pollution but many, and in several cases all, of the airport related road traffic improvements are used up by the airport’s forecast growth in the aircraft emissions as shown in Table 8.
| Location (RG1) | 2018 | 2024 | 2029 | 2032 | 2038 | 2038 (without development) |
| Airport | 8.0 | 9.2 | 9.1 | 10.3 | 9.9 | 8.7 |
| Airport Roads | 2.0 | 1.5 | 0.7 | 0.8 | 0.8 | 0.6 |
| Total | 10.0 | 10.7 | 9.8 | 11.1 | 10.7 | 9.3 |
Table 8 – Airport and Airport Roads Contribution to NOx concentrations (µg m-3) at RG1 residential monitoring site near Gatwick airport (2nd runway opens 2029).
Here it is clear that at the RG1 site the airport contribution of emissions in the development scenario is forecast to go from 10 µg m-3 of NOx in 2018, to 10.7 µg m-3 in 2038 having peaked at 11.1 µg m-3 of NOx in 2032.
In the ‘without development’ scenario (the airport’s forecast growth using just the single runway) residents would be exposed to less airport related air pollution in 2038 (9.3 µg m-3 ) than in 2018. Whereas with the northern runway development, residents forecasted exposure to airport related emissions will show no improvement in the 20 years at this site and will be higher in 2038 than 2018.
Runnymede Borough Council
Introduction
Modelling undertaken for the local development plan has clearly identified that road transport is the main source of high NO2 levels in the Runnymede.
Measures to improve air quality in Runnymede need to focus on a general reduction in background levels and light duty vehicles, especially cars.
Trends over last 10 years
The air quality objectives were achieved across Runnymede in 2023 including in the two AQMAs. The general trend is an improvement in air quality and the Council is working towards revoking the AQMAs in the coming years.
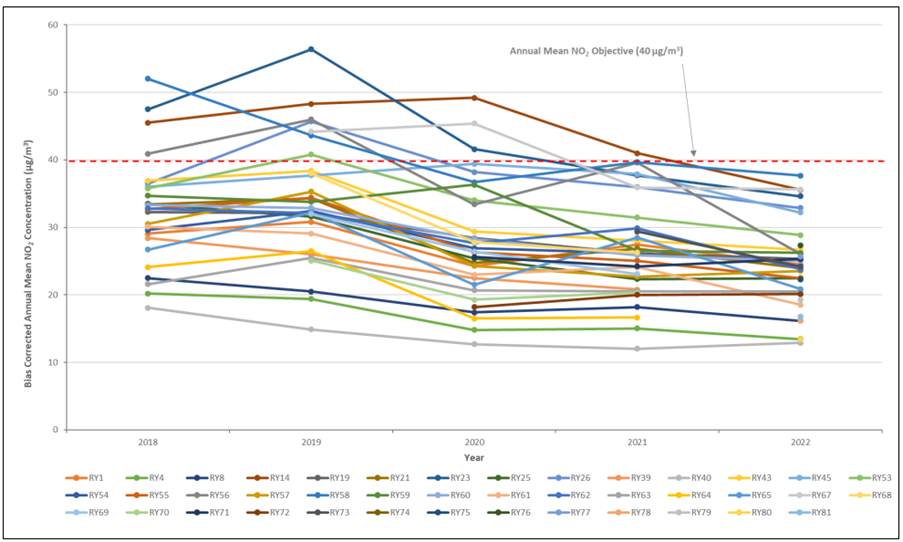
Figure 29 – Trends in Annual Mean NO2 Concentrations in Runnymede from 2018 – 2022.
Figure 29 shows a general drop in the levels of NO2 over the last 6 years, with a bigger drop during the pandemic, then the expectant rise, but then continuing the trend of gradually dropping.
Annual Status Report (ASR) and Highlights
The 2023 Runnymede ASR confirms that while air quality has generally improved certain areas, particularly near the M25 and Addlestone, still experience elevated NO₂ levels. Runnymede continues to monitor air pollution, implement targeted actions, and collaborate with partners to reduce emissions and protect public health. [97]
Air Quality Management Area (AQMA)
AQMAs have been declared at two locations in Runnymede for exceedances of the annual mean NO2 objective, namely land adjacent to the M25 including an extended area where the M25 crosses over Vicarage Road and High Street Egham near junction 13 and at a traffic light-controlled junction in Addlestone town centre.
Air Quality Action Plan (AQAP)
The Runnymede AQAP 2023 outlines targeted measures to improve air quality in two designated AQMAs, along the M25 and in Addlestone Town Centre, primarily addressing NO₂ and PM₁₀ from road traffic. The plan includes source apportionment, proposed interventions, and collaborative efforts with planning and transport policies to reduce emissions and meet national air quality objectives. The AQAP will next be reviewed in 2028. [98]
Air Quality Strategy (AQS)
The Runnymede air quality webpage outlines the Council’s responsibility to monitor and assess air quality annually, primarily using NO₂ diffusion tubes. The main air pollution source is road transport. Residents, especially those with health conditions, are encouraged to sign up for the airTEXT service for real-time pollution updates. [99]
Strategies to Improve Air Quality – Current and Future
Runnymede supports SAA clean air night public information campaign and provides the airTEXT service for residents.
Climate Change Strategy
The Runnymede climate change action plan, updated in April 2025, outlines over 200 actions aimed at reducing emissions both within the Council’s operations and across the wider Borough. It supports the Council’s goal of achieving net zero carbon emissions by 2030 for its own services and by 2050 Borough-wide including measures for mitigation, adaptation, and community engagement to address climate change impacts. [100]
Public Information on Local Air Quality
Runnymede air quality website has further information for the public. [99]
Spelthorne Borough Council
Introduction
Air quality in Spelthorne is predominantly influenced by transport emissions and background pollutant concentrations which include emissions from outside the Borough. The principal air pollutant of concern within Spelthorne is NO2 predominantly from road transport.
A Borough wide AQMA was declared in 2003 for NO2 air pollution, and an AQAP was published in 2005 to bring about improvements in concentrations of NO2 within the Spelthorne AQMA. In 2024 because of sustained improvements in local air quality, the coverage of the AQMA was reduced and an updated AQAP was published.
It is recognised that PM10 and PM2.5 has significant health impacts and that the WHO Global Air Quality Guideline levels are not met in Spelthorne in line with the wider region. In 2021, Spelthorne passed a motion to advocate for and work towards meeting the WHO Global Air Quality Guidelines.
Trends over last 10 years
Spelthorne have maintained a comprehensive monitoring network focussed on pollutants which are of greatest concern within the Borough, NO2, PM10 and PM2.5. There is currently one automatic monitoring site in Spelthorne located at Oaks Road, Stanwell. Spelthorne currently has 51 non-automatic diffusion tube NO2 monitoring locations across the Borough.
Whilst the requirements of national legislation are met, addressing local sources of particulate pollution remains an important component of air quality management given the health impacts.
Figure 30 shows that monitoring of NO2 at both roadside and urban background locations demonstrates there has been a decline in NO2 concentrations over the last 10 years, which is largely attributed to improved vehicle fleets, with the largest reductions observed in 2020 (when pandemic related travel restrictions led to a reduction in emissions). Monitored NO2 concentrations have been predominantly compliant with the annual mean objective for the monitoring years 2022 to 2024 since the pandemic related travel restrictions were lifted. This trend includes roadside monitoring locations. Post pandemic improvements may be a result of a combination of factors including behavioural change and fleet improvements. Spelthorne is adjacent to both the London Ultra Low Emission Zone (ULEZ) that was extended to outer London in 2023, it covers a wide range of vehicles and the Low Emission Zone for heavy diesel vehicles established in 2008.
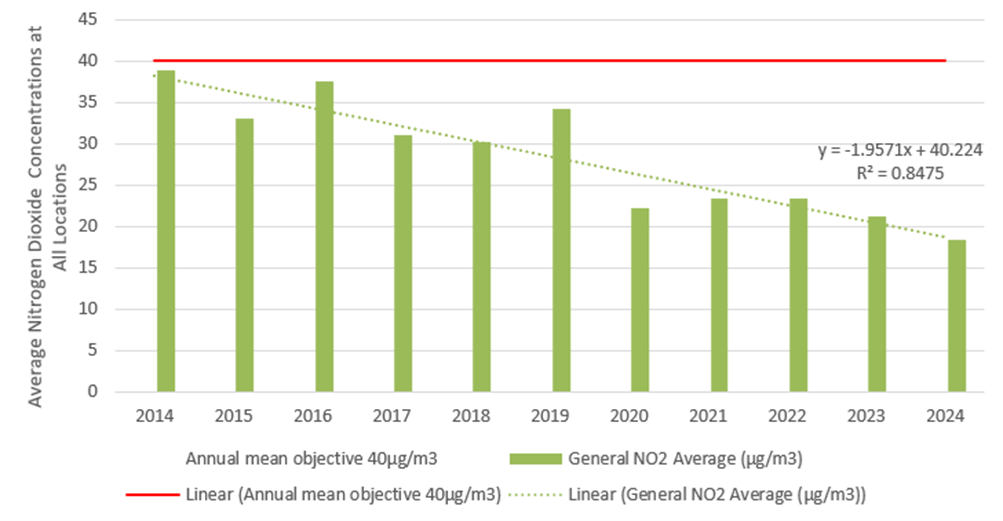
Figure 30 – Trends in non-automatic Spelthorne NO2 monitoring data, 2014 to 2024.
The air quality in Spelthorne in the most recently reported year 2023, and within the preliminary data for 2024 remained below the UK limit values set of 40 µg/m3, compared to 2022 where there was an exceedance of the annual objective for NO2 at Stanwell Moor Road as detailed in the 2023 ASR [96]. The location of this historic exceedance was adjacent to a heavily trafficked road leading to the Southern Perimeter Road, Heathrow Terminal 5 and the M25.
The areas of the Borough closer to London experience higher levels of background air pollution. Historically, areas such as Sunbury Cross where the A316 and M1 intersect with the A308, Staines upon Thames town centre and monitoring locations in the north of the Borough adjacent to heavily trafficked A roads have experienced poor air quality. Following the pandemic and the subsequent lifting of associated travel restrictions, air quality in these locations has improved.
Annual Status Report (ASR) and Highlights
The 2024 Spelthorne ASR highlighted continued improvements in air quality across the Borough, leading to a reduction in the size of the AQMA. It also emphasises the Borough’s focus on monitoring key pollutants like NO₂ and PM, while addressing local and regional pollution sources, including emissions from Heathrow airport and strategic transport routes [101].
Air Quality Management Area (AQMA)
A Borough wide AQMA was declared in 2003 for NO2 air pollution in relation to traffic and an AQAP was published in 2005, to bring about improvements in concentrations of NO2 within the Spelthorne AQMA. Most of the Borough is already compliant with national objectives therefore in line with the DEFRA TG22 Local Air Quality Management Guidance. The council has adjusted the coverage of the AQMA to better reflect the status of air quality within the Borough. The AQMA was reduced in size as shown in Figure 31, in 2024 because of these sustained improvements in local air quality [102].
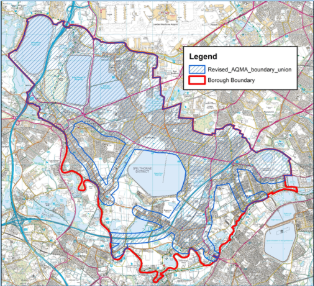
Figure 31 – Spelthorne AQMA
Air Quality Action Plan (AQAP)
Spelthorne published an updated AQAP that was adopted in December 2024 following approval by the Environment and Sustainability committee [103]. It is a core part of Spelthorne’s ambitious plans to be carbon neutral by 2030, as laid out in Spelthorne’s Climate Emergency Action Plan below. The plan outlines the steps Spelthorne will take to improve air quality between 2024 and 2029. This includes but is not limited to:
- Effective collaboration with all stakeholders including:
- SCC, as the transport authority aims to implement broader transport initiatives that promote active travel and public transport, reduce private vehicle use, and encourage low or zero emission vehicles where shifting travel modes isn’t possible.
- Heathrow Airport Ltd; to address emissions associated with the airport operations.
- Other stakeholders, including neighbouring London Boroughs, National Highways, and the Environment Agency, working to reduce particulate matter and NOx emissions from various sources both within and beyond the Borough.
- Maintain and expand its air quality monitoring network in accordance with guidance from DEFRA. its current location monitoring plan is presented in the 2024 ASR.
- Providing an alert service, currently airTEXT to help residents, especially those with health vulnerabilities, manage their exposure to poor air quality by notifying them when conditions are predicted to worsen.
- Education, behavioural change and awareness raising about the primary local air pollution source that is contributing to elevated NO2 concentrations at the roadside within the AQMA is traffic, including the significant proportion of vehicle trips being journeys to school in the morning peak. Reducing the use of private vehicles for journeys to school will be necessary to improve air quality and tackle climate change.
- It is recognized that the expense of public transport is a challenge for Spelthorne, so the corporate plan is committed to support the Spelthorne in the Zone campaign to lobby for inclusion of Spelthorne in Transport Zone 6.
- Spelthorne plans to expand its existing SCAs, which regulate solid fuel use and require DEFRA-compliant appliances, to cover the entire Borough, pending approval from the Council’s political committees.
- Issues raised by residents during the AQAP consultation process included dealing with air pollution from Heathrow airport, improving transport planning and infrastructure, facilitating active travel and addressing pollution where vulnerable members of the population are exposed e.g. nurseries, primary schools, hospitals, care homes etc. The need for clear, safe pedestrian and cycle routes, more frequent and reliable public transport and improvements to the charging infrastructure for EVs were all cited. The AQAP includes measures which help address these concerns such as bus priority measures to assist with reliability of buses, promotion of the use of cleaner technology and fuels, improvements to EV charging infrastructure and pedestrian/ cycle route by SCC.
- The new LCWIP [104] is a key transport planning document which aims to support recent uptakes in the active travel modes of walking and cycling, by delivering improved facilities for existing active users whilst also encouraging a mode shift for new users. The key outputs for an LCWIP are network plans for key walking and cycle corridors and a prioritised programme of infrastructure improvements at concept design stage, with the document used to assist in funding allocations for walking and cycling routes.
Air Quality Strategy (AQS)
Spelthorne has an Air Quality Action Plan as opposed to an Air Quality Strategy. It is likely that if air quality improvements are sustained and continue in subsequent reporting years that the AQMA would be revoked and at that time an Air Quality Strategy would be put in place.
Strategies to Improve Air Quality – Current and future
Spelthorne are part of SAA and, together with other local authorities in Surrey, promote Clean Air Day/Night. In 2024 SBC undertook a walking to school air quality monitoring survey for Clean Air Day in Stanwell to highlight that walking away from the main roads reduces exposure to air pollution. The survey was undertaken with support from Heathrow Airport Limited.
The SAA works closely with SCC as the transport authority to offer resources for schools regarding air quality and sustainable travel.
The recently published AQAP presents all the measures considered to improve air quality within Spelthorne from 2024-2029. Domestic burning as a source of particulate air pollution remains a challenge for Spelthorne and the Council are working on establishing an additional Smoke Control Area which will take the coverage of Smoke Control Areas Borough wide.
The level of development in Spelthorne presents a challenge to maintaining improvements in local air quality. Spelthorne has a policy within the Local Plan that sets out when detailed air quality assessment is needed for development in the Borough.
Spelthorne are taking action to reduce particulate emissions given the known health impacts. Actions have included public health campaigns concerning burning and bonfires, targeting resources to respond to construction dust complaints, and to incorporate signposting to best practice regarding construction dust into planning assessment scoping responses and at pre-application meetings regarding developments.
Climate Change Strategy
Spelthorne has declared a climate emergency, with an ambition of achieving net zero carbon status by 2030. This is supported by Spelthorne’s Climate Change Strategy 2022-2030. [105]
A Supplementary Planning Document (SPD) [106] sets out how new development in Spelthorne, that is controlled through the planning system, can play its part in reducing the effects of climate change and remain resilient to a changing climate. The SPD includes measures to reduce air pollutant emissions.
Public Information on Local Air Quality
Information about air quality in Spelthorne including links to air quality monitoring data, ASRs on local air quality, and information on how to sign up for the airTEXT service is presented on the SBC website [107] [108].
Heathrow Airport
Spelthorne borders London and local air quality is influenced by its location next to a capital city and strategic transport infrastructure, including the M25, M3, A30 and London Heathrow airport.
Although Heathrow airport is located within the London Borough of Hillingdon, emissions associated with the airports operations, associated industries and transport to and from the airport impact air quality in Spelthorne. While these emissions fall outside the direct remit of Spelthorne, the Council work with the airport and neighbouring authorities to improve airport related emissions monitoring and policy. Spelthorne is a statutory consultee for planning applications for expansion at Heathrow airport and is a key member of the Heathrow Strategic Planning Group which is a partnership of local authorities and local enterprise partnerships focused on land use, transport, environmental, and sustainable development planning in the Heathrow sub-region [109]. Additionally, Spelthorne participates in the Council for the Independent Scrutiny of Heathrow Airport (CISHA), including its air quality working group, to influence Heathrow’s future operations [110]. Heathrow Airport Ltd has developed dedicated air quality measures to help address emissions including a Sustainability Strategy to support net zero aviation through the promotion of Sustainable Aviation Fuels, a policy of upgrading airport vehicles to low emission vehicles, measures to encourage airlines to use newer aircraft and the introduction of charges for passenger drop off journeys.
Working with Heathrow Airport is one of the priorities in Spelthorne’s AQAP, reflecting local concern identified during public consultation.
Heathrow airport operates an air quality monitoring station at Oaks Road, Stanwell, where pollutants such as NOx, PM10, PM2.5, and Black Carbon are measured [111]. Data is shared with Spelthorne and data from the airports air quality monitoring network is made publicly available on the Heathrow Airwatch website. Heathrow has commissioned research to monitor PM0.1 at the LHR2 Air Quality Monitoring Station on the apron of the northern runway, offering insights into PM0.1 levels and aviation [112].
Long-term trends and sources of emissions in Spelthorne are further detailed in the 2024 ASR.
Surrey Heath Borough Council
Introduction
The main air quality concerns in Surrey Heath are associated with the emissions from road traffic, in particular trunk roads such as M3 motorway. The main pollutant of concern is NO2.
Trends over last 10 years
Over the past ten years, monitored air quality pollutants have decreased gradually. This is largely attributed to improved vehicle fleets, improved roads and reduced traffic flow. There was a small increase in 2021 and 2022 following the rebound in road traffic post-pandemic. They have since decreased in 2023 and 2024, and they do not affect the long-term downward trend.
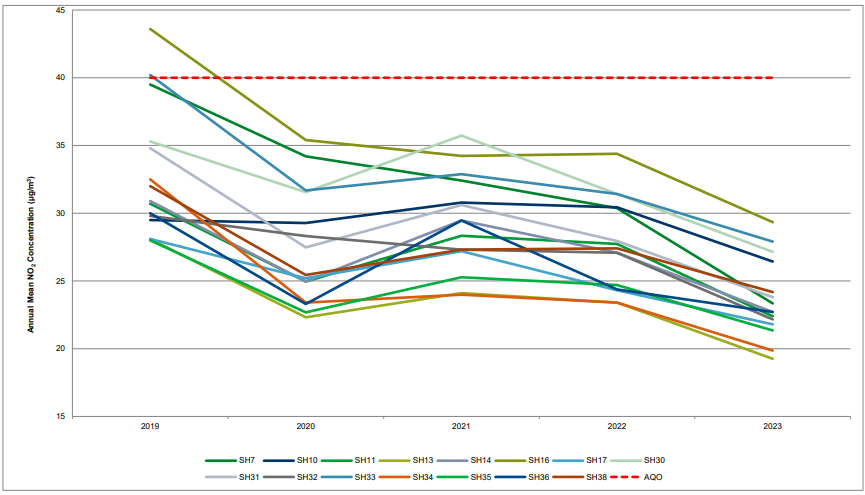
Figure 32 – Trends in annual mean NO2 concentrations from 2019 – 2023.
Figure 32 shows the positive impact of the 2020 pandemic on NO2 levels, the return to ‘normal’ levels in 2021, and since then the decreasing levels to below pandemic levels. For more information and further graphs outlining more sites, see the ASR.
Annual Status Report (ASR) and Highlights
The ASR shows the 2023 NO2 monitoring results indicate a decrease in annual mean NO2 concentrations at most monitoring sites across Surrey Heath in comparison to the previous year and have continued to remain compliant with the annual mean Air Quality Objective (AQO). [113]
Air Quality Management Area (AQMA)
In 2002, an area along the M3 corridor was declared as the AQMA due to exceedances of NO2 annual mean and PM10 24-hour mean. Following over five years of consecutive compliance, Surrey Heath received guidance from DEFRA to revoke this AQMA. An AQMA revocation order was issued in December 2024, following the approval by licensing committee.
Air Quality Action Plan (AQAP)
As Surrey Heath no longer has an AQMA in place, there is no requirement for an AQAP.
Air Quality Strategy (AQS)
Following the revocation of AQMA in December 2024, Surrey Heath is in the process of developing a local air quality strategy to ensure air quality remains a high-profile matter. It continues to monitor air quality at 53 locations across the borough to check compliance. It is scoping further improvements to air quality through collaborative work which may be part of the devolution and reorganisation plan. [114]
Strategies to Improve AQ – Current and future
Surrey Heath received a DEFRA’s local authority air quality grant in 2023 and procured a portable PM2.5 and PM10 monitor to check PM values at locations with higher concentration (near trunk roads for example) and / or increased exposure risk (near schools for example). Monitoring results have been used to indicate the likely PM2.5 levels in Surrey Heath.
Surrey Heath secured a UK Government grant to part fund the installation of EV charging bays in public car parks and upon council owned land. The project is on track to completion.
Under the direction of DEFRA and Department for Transport (DfT), Surrey Heath works with Rushmoor Borough Council, SCC and Hampshire County Council to complete the A331 Blackwater Valley Project. The project started in 2019 to deliver NO2 compliance in a section of the A331 by introducing a 50mph speed restriction. Based on monitoring results and modelling outcomes, the compliance has been achieved, and the success can be maintained even if the speed limit is to be lifted. The project is entering an exit phase.
Climate Change Strategy
Surrey Heath has produced a climate change action plan, which was reviewed in April 2024. It recognises the synergy between climate change and air quality and identifies action points that could benefit both. [113]
Public Information on Local Air Quality
Air quality information is available on the Surrey Heath website. It explains what air quality is, why it matters, how air quality is managed at Surrey Heath, how to get pollution forecasts, and what individuals can do to improve air quality. [113]
Tandridge District Council
Introduction
The main source of air pollution in Tandridge is NO2 from traffic using motorways and major roads, notably the M25, M23, A22 and A25. The M25 junction 6 is situated just north of Godstone, and the A22 and A25 join in Godstone. Gatwick airport lies just over the boundary to the south-west and airport emissions contribute to the background pollutant concentrations in Tandridge.
Trends over last 10 years
Nearly all the monitoring sites have shown a gradual improvement in NO2 levels over the last 10 years.
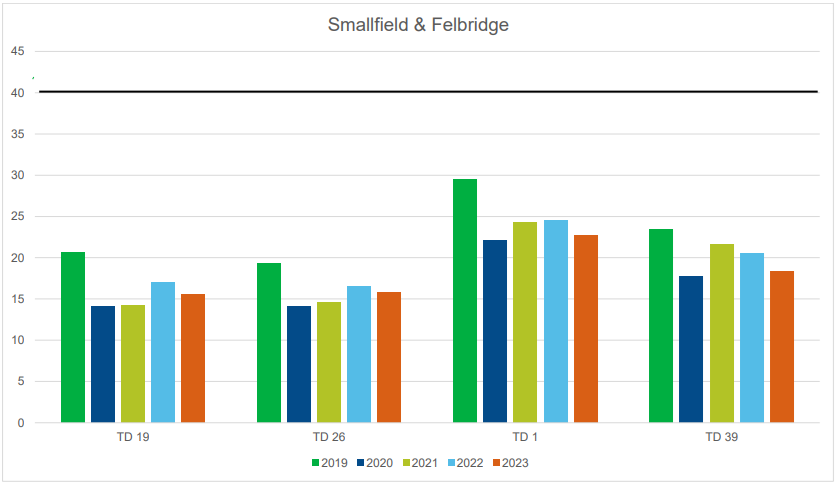
Fig 33 – An example of trends in NO2 from 2019 – 2023.
Figure 33 shows an example from Smallfield and Felbridge where the overall trend of NO2 has been decreasing since 2019. There was a significant decrease during the pandemic in 2020 when movement restrictions were in place, then rising NO2 levels as restrictions were lifted in 2021, and since then levels have fallen and remain below pre-pandemic levels in 2019.
Annual Status Report (ASR) and Highlights
The 2024 Tandridge ASR confirms that air quality across remains within national objectives, with NO₂ levels compliant at all but one site. The council continues to monitor air quality closely and is prepared to declare an AQMA and develop an action plan if future exceedances are confirmed. [115]
Air Quality Management Area (AQMA)
Tandridge does not currently have any AQMAs in place.
Air Quality Action Plan (AQAP)
Due to not having any AQMA’s, there is no requirement to have an AQAP.
Air Quality Strategy (AQS)
The Tandridge AQS outlines the council’s proactive approach to maintaining good air quality, despite not currently having any AQMAs. It focuses on preventative measures, local and county-level initiatives, and the work of the environmental health team to reduce air pollution and protect public health over the 2024–2025 period. [116]
Strategies to Improve Air Quality – Current and future
Tandridge currently participate in the airTEXT service and Clean Air Day/Night campaigns.
Climate Change Strategy
Tandridge declared a climate emergency in February 2020 and developed a climate change strategy and action plan to reduce carbon emissions from its operations and support community-wide sustainability. The strategy focuses on practical actions such as improving energy efficiency, promoting sustainable transport, enhancing biodiversity, and encouraging residents and businesses to reduce their environmental impact. [117]
Public Information on Local Air Quality
Tandridge air quality webpage provides the latest ASR, the AQS, details about airTEXT and the DEFRA guidance on open fires and wood burning stoves. [118]
Waverley Borough Council
Introduction
Air quality in Waverley is generally good. Two AQMAs have been declared for historic exceedances of the annual mean objective for NO2. Road traffic emissions are recognised as the major pollution source for NO2. PM2.5 is a pollutant of concern given the health impacts with domestic sources, such as wood burning, making the largest contribution to primary local emissions.
Trends over last 10 years
Figure 34 shows that the trend in annual mean NO2 remaining locations which are mostly rural, has been gradually declining since 2019, even with the pandemic in 2020, the numbers have continued to drop including the 2 AQMA areas.
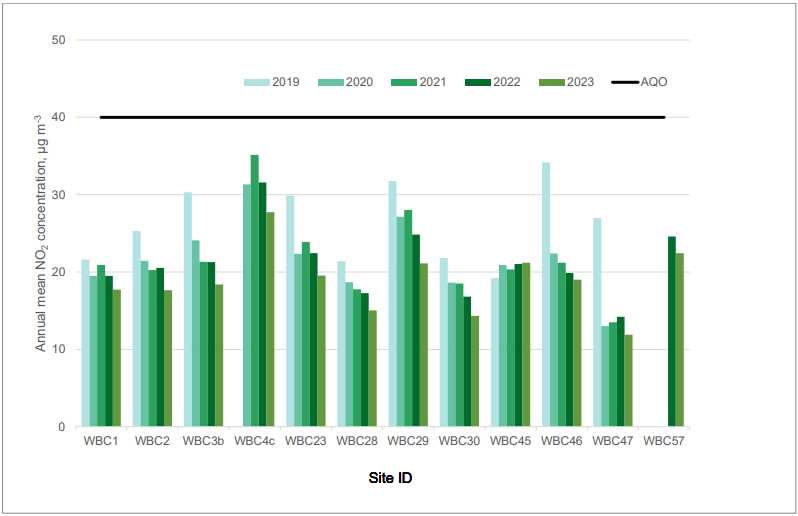
Fig 34 – An example of the trend in NO2 emissions from 2019 – 2023.
Annual Status Report (ASR) and Highlights
The 2024 ASR reports a continued improvement in air quality with 50 out of 51 diffusion tube monitoring locations in Waverley, measuring NO2 concentrations lower in 2023 than 2022. There are 2 automatic monitoring stations, one within the Farnham AQMA and one within the Godalming AQMA. Results are available near real time via the Air Quality in England website. [119] The annual mean concentrations measured in 2023 were 18 µg m-3 (Farnham South Street) and 19 µg m-3 (Godalming Ockford Road), against the annual mean AQO of 40 µg m-3. [120]
Air Quality Management Area (AQMA)
Waverley currently has two AQMAs, in Farnham Town Centre and along Ockford Road in Godalming, declared in 2005 for exceedances of the objectives due to traffic emissions causing elevated levels of NO2 [121]. Both AQMAs have been compliant with since 2020. Following submission of Waverley’s 2024 ASR, DEFRA have advised that if compliance continues, revocation of both AQMAs may be considered.
Air Quality Action Plan (AQAP)
The AQAP is specific to the Farnham and Godalming AQMAs to ensure air quality meets and stays below the annual objective for NO2.
It is working closely with Surrey County Council and others, and plan to:
- Support the Town Centre changes within the Farnham infrastructure programme.
- Implement the outcomes of the ‘quick wins’ project within the Farnham Infrastructure Programme. [122]
- Support and implement the Farnham Town Centre.
- Encourage EVs in Farnham and Godalming through EV infrastructure improvements, including the uptake of EV taxis and buses.
- Provide a consistent process for air quality assessments for developments likely to impact on air quality, including committed development within and outside Waverley.
- Work with others to implement the Waverley clean air strategy.
More information on the AQAP in Waverley is available on the website. [123]
Air Quality Strategy (AQS)
Waverley published their Clean Air Strategy (CAS) in 2023, which outlines Waverley’s desire to encourage actions to improve air quality in line with the strategic objective for improving the health and wellbeing of residents. Unlike the AQAP, which is focussed on the AQMAs, the CAS considers NO2 and PM2.5 across the Borough and will support ongoing action to improve air quality should the AQMAs be revoked. [124]
Strategies to Improve Air Quality – Current and future
Air quality monitoring is undertaken at 51 locations across Waverley, including 2 automatic monitoring stations, with results published on the website. [125]
The AQAP, CAS and local ASR has full details of identified actions and measures to improve air quality in Waverley. [126]
The Farnham Infrastructure Programme (FIP) details Farnham town centre improvement works to reduce air pollution and congestion, which is being led by SCC as the highways authority. Construction works were started in December 2024. [127]
Waverley, working with six other local authorities in Surrey and SCC, has secured funding from DEFRA and SCC Public Health for a project providing subsidised EVs to taxi and private hire operators. The taxi project aims to encourage the permanent uptake of EVs in the private hire fleet to reduce vehicle emissions from this sector and improve air quality, particularly in town centre locations. It is anticipated that the project will be implemented during 2025 and 2026.
Climate Change Strategy
Waverley has produced a climate change and sustainability strategy and carbon neutrality action plan for 2020 – 2030. The action plan focuses on 7 main themes, one of which is active travel and air quality. This section details the commitment to joint working with SCC as the highways authority and outlines measures to support cycling, walking and electric vehicles. [128]
Public Information on Local Air Quality
Guidance, information and practical advice including sources of alerts for vulnerable people is provided on the Waverley website. [129]
Woking Borough Council
Introduction
The key pollutant sources are NO2 from road traffic, which are monitored at 33 locations across the Borough.
The latest monitoring review of the 2023 data revealed there were no exceedances of the annual mean objective for NO2.
Trends Over last 5 years
Figure 35 shows that the trends over the last 5 years for Woking town centre monitoring locations is mixed. During the pandemic in 2020 generally NO2 levels were lower which can be attributed to the lockdowns in the UK, but as there is a mixed trend across the monitoring sites, there are factors such as traffic flow changes, major construction and many more that could have impacted these levels. A positive sign is that there the levels in 2023 are generally lower than 2019.
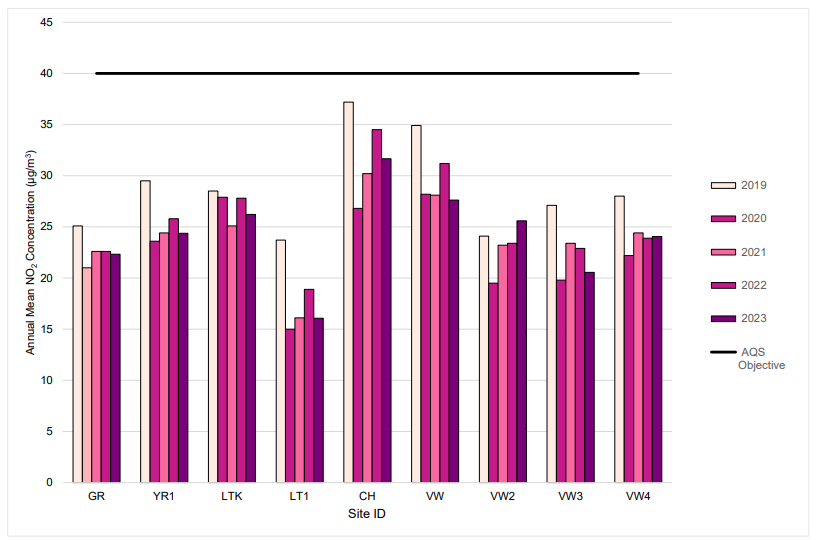
Figure 35 – Trends in annual mean NO2 concentrations – town centre from 2019 – 2023.
Annual Status Report (ASR) and Highlights
The 2024 Woking ASR highlights continued monthly monitoring of key pollutants, particularly NO₂, and collaborative efforts with partners like the SAA to improve local air quality. The report also assesses progress against national objectives and outlines actions taken to address air pollution, including targeted projects and public health initiatives. [130]
Air Quality Management Area (AQMA)
Woking has one AQMA on Guildford Road, which covers a section of Guildford Road and south of the Constitution Hill junction. It was declared in May 2017 because of exceedances of the annual mean objective for NO2. Monitored NO2 concentrations have been compliant with the relevant objectives since 2020 and the AQMA will be considered for revocation if the 2024 monitoring data is 10% below the objective. This approach was agreed with DEFRA in 2024.
Air Quality Action Plan (AQAP)
The Guildford Road AQAP is dated January 2018 and was due for renewal in 2024-25, however, the AQMA is under review for revocation in 2025, so long as the 2024 monitoring data remains 10% below the AQO.
Air Quality Strategy (AQS)
An AQS will be developed if the Guildford Road AQMA is revoked.
Strategies to Improve Air Quality – Current and future
Woking continues NOx monitoring at 33 sites and participates in the SAA. Key projects include EV taxi trials, clean air day/night campaigns, school air quality programs, domestic fuel regulation collaboration, and pollutant modelling. Woking supports active travel through infrastructure improvements, school travel plans (8 schools accredited), and promotion of the ‘Better Points’ app.
Other initiatives include secure cycle parking at Woking station, classroom air quality monitoring via the Schools Air quality Monitoring for Health and Education (SAMHE) project, and public education on domestic wood burning. Woking is also working with public health on an air quality awareness video, and with DEFRA on potentially revoking the Guildford Road AQMA in 2025. A Woking air quality strategy may follow. Plans include county-wide dispersion modelling in 2026 and continued efforts to reduce emissions, raise awareness, and address health inequalities through targeted projects.
Climate Change Strategy
A draft updated climate change strategy has been produced and went out for public consultation in June 2023, though it is now under review considering new legislation and Woking’s current financial situation. The strategy reaffirms Woking’s commitments and objectives to meeting its environmental goals and climate change commitments of a net zero Council estate by 2030 and a net zero Borough by 2050 (or 2045). It will be the follow up strategy to Woking 2050 which was adopted in 2015. Information about the review is available on the Council’s climate change webpages. Theme 4 of the strategy focuses on transport and looks at how Woking can make positive changes to the sustainability of the Borough by adopting sustainable modes of transport. The draft strategy also includes a section on air quality and its links to sustainable transport, energy production/consumption and waste management. [131]
Woking’s climate change Supplementary Planning Document (SPD) was adopted on 30 November 2023 and is a material consideration in the determination of planning applications. It provides detailed information regarding the implementation and delivery of policies within the core strategy relating to climate change, in particular policies CS22 ‘sustainable construction’ and CS23 ‘renewable and low carbon energy generation’. It explains what developers need to do to meet policy requirements and is considered an important document which will help deliver the spatial vision and objectives of the core strategy, particularly in terms of leading the way in high quality sustainable development.
Public Information on Local Air Quality (AQ)
Air quality information in available on the Woking website. [132]
National Highways
National Highways latest review has shown monitoring data for 2024 alongside the A3 has recorded a monitored annual mean NO2 concentration of 57µg/m3. Whilst above the limit value it is reduced by approximately 7µg/m³ from 2023, and this continues the ongoing improvements in air quality concentrations seen alongside the motorway and trunk road network.
Figure 36 shows the National Highways monitoring locations along the A3 in Surrey. The pins in red are the monitoring locations above the annual mean NO2 limit value and the pins in blue are those monitoring locations below the NO2 limit value in 2024.
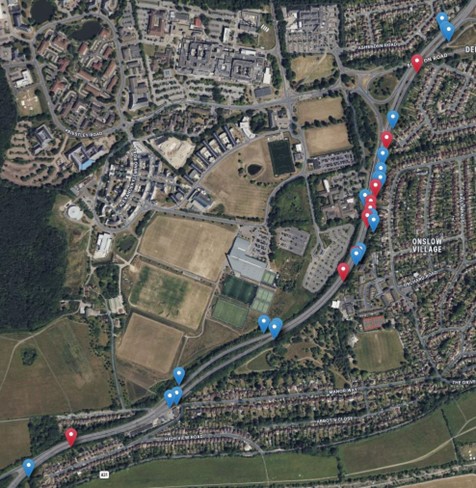
Figure 36 – National Highways NO2 monitoring locations along the A3, Surrey.
As the monitored concentrations for 2024 are much lower than previously predicted, a systematic review of the monitoring data for 2023 and 2024 has been undertaken. The review identified that monthly concentrations in 2023 were on average higher than for the same months in 2024. Part of the reason for this has been attributed to distinctly different meteorological conditions between 2023 and 2024 for the same months. For example, in June 2023 the monthly concentrations were approximately 30µg/m3 higher than the same month in 2024. The meteorological conditions showed a very different wind pattern in that month.
Work is still ongoing to deliver measures alongside the A3 to help protect pedestrians who use the footpaths alongside the A3. It showed there are no exceedances of the limit value in any of the adjoining gardens or properties alongside the A3. Over the years National Highways has investigated a range of different measures such as tall barriers, promoted the uptake of electric vans with partners at SCC and have previously worked with Guildford Borough Council to examine possible local transport measures to help reduce levels of NO2 alongside the A3. Unfortunately, none of these measures could either be constructed in the case of the barriers, or in the case of the electric van scheme had low uptake rates of the grants. However, it is committed to try and find a solution for the A3, to help protect public health.
Copies of all air quality reports, which includes the A3, and monitoring data can be found on the National Highways website. [133]
Surrey County Council
Surrey local transport plan
Transport is a critical wider determinant of public health and well-being. The fourth SCC Local Transport Plan (LTP4) sets out the plans for transforming the transport network from 2022 up to 2032 and beyond. LTP4 was adopted on 12 July 2022 and supersedes SCC’s third Local Transport Plan (LTP3), previously published in 2011. LTP4 aims to significantly reduce carbon emissions from transport to meet its commitment to net zero emissions by 2050, in line with the national target. LTP4 sets out the changes that SCC will all need to make to achieve this important goal. [134]
Road transport is a major source of NO2, PM and greenhouse gases. Typical highway and or street conditions that can give rise to air pollution problems in Surrey include:
- Narrow, highly trafficked streets with residential properties close to the kerbside.
- Busy streets where people may spend an hour or more close to slow moving traffic, such as around schools and local shopping parades.
- Roads with a high traffic movement of buses and/or heavy goods vehicles (HGVs) which in general tend to be more polluting per vehicle than cars or vans.
- Busy junctions with high daily traffic movements with queuing /idling vehicles.
- Roads with significantly changed traffic flows because of large new developments.
- Bus stations and other transport interchanges.
Changes in lifestyles, new technology and new vehicle ownership models are creating opportunities to act to reduce emissions from travel, against a backdrop of increased public concern over the impact of emissions on health and climate change. However, these effects are offset to some degree by an increasing demand for travel.
LTP4 will help reduce emissions of greenhouse gases, NOx and PM and reduce exposure to poor air quality, through four key opportunity areas:
- Transport networks and infrastructure for sustainable travel through the local streets improvements programme, the LCWIPs and the Bus Service Improvement Plan (BSIP), to provide improvement to bus services and infrastructure and supporting the growth of Surrey’s public EV charge point network.
- Travel behaviour changes such as initiatives and campaigns in schools and workplaces, road safety initiatives, expanding car clubs, encouraging lift sharing, raising awareness and public understanding of air quality and climate change.
- Partnership working such as working with district and borough councils on air quality matters, advising on transport impacts of new development, strategic planning input to local plans and partnerships with transport providers for modal shift and lower emissions vehicles, including bus companies and train operators.
- Reducing emissions from the Council’s own estate and operations such as influencing staff business travel, procuring EVs / ultra-low emissions fleet vehicles where viable and where value for money is shown, and opportunities in highways operations and maintenance supply chain.
More information on the linkages between transport and health will be included in a forthcoming JSNA chapter on transport and health later in 2025.
Greener Futures
Climate change and air quality are interlinked in a multitude of ways, and as a result the actions to reduce greenhouse gas emissions often lead to reductions in outdoor and indoor air pollution. Examples of such actions include reducing private car travel, encouraging walking & cycling, transitioning from fossil or wood fuel to electric heating and cooking, and enhancing energy efficiency and ventilation of buildings.
One of several shared challenges is the built environment which affects how people are exposed to outdoor air pollution and impacts people’s ability to choose low pollution, low carbon and healthy behaviours such as walking to work. It is also harder to retrofit a building with measures to improve indoor air quality, to be more energy efficient and adapted to climate impacts, than it is to design buildings with these measures from the start. Closer working between health, planning, air quality and climate change partners across Surrey could tackle such shared challenges in a more efficient and beneficial way.
Moreover, climate change itself can worsen air quality. Heatwaves can increase O3 and PM in the air and will occur increasingly frequently due to climate change. Wildfires are becoming increasingly common in Surrey creating large amounts of particulates and other pollutants which can travel long distances. Climate change will cause other meteorological changes which are expected to influence the production, dispersal and deposition of air pollutants. Surrey’s Climate Change Adaptation and Resilience Strategy provides a framework for the public sector, residents and businesses across Surrey to assess climate risks such as increased air pollution and take action to adapt and increase resilience. [135]
Overall, taking action to achieve net zero carbon emissions across Surrey by 2050 and delivering the Greener Futures Climate Change Delivery Plan 2021-2025 will not only mitigate climate change, but it will also lead to air quality improvements and other public health benefits. [136]
The following are some examples of how work to mitigate climate change can impact positively on-air quality.
Home Upgrade Grant 2: Tackling Fuel Poverty and Air Quality
Since July 2023, local authorities in Surrey have been improving indoor air quality in fuel-poor households through the Home Upgrade Grant phase 2 (HUG2) scheme. This initiative helps fuel poor households save energy and money by providing free energy efficiency upgrades and installing low carbon heating. In addition, the scheme has also installed ventilation measures in over 152 properties such as mechanical ventilation, window trickle vents, door undercuts, and Positive Input Ventilation (PIV) systems. These ventilation measures will enhance air circulation, reduce moisture levels, and improve overall indoor air quality in participating households, whilst still increasing energy efficiency.
Furthermore, this national grant funding scheme focussed on homes not connected to the gas grid, which may be more likely to experience poor indoor air quality due to using oil, coal or wood fuel for heating. The scheme replaced such forms of heating with an electric form of heating like an air source heat pump which will have had an instant improvement in indoor air quality.
Local authorities in Surrey managed to administer 15% of all the HUG2 grant funding offered across the UK and are continuing to progress the installations. The scheme is a great example of how air quality, health, poverty and carbon emissions can be tackled together.
Guildford Living Pillar – Combining urban greening and Air Quality mitigation
As part of SCC Urban Biodiversity Opportunity Areas (URBOA) project, a ‘living pillar’ was installed in Guildford High Street in February 2025.
A living pillar is a vertical garden, integrated into existing infrastructure such as lampposts. By incorporating a variety of plant species, living pillars provide a habitat for pollinators and urban wildlife, and contribute to a more visually appealing high street encouraging people to visit and shop. Further, living pillars can help improve air quality by trapping PM2.5 and absorbing pollution. It is hoped that the project will inspire further investment in urban greening initiatives in Surrey.
Sandfield Primary School’s ‘Living School Gate’
The UK’s first ‘living school gate’ was installed at Sandfield Primary School in Guildford. Consisting of 140 plants with a separate green screen made of ivy, the living gate project was designed to filter high pollution levels from the busy roads and provide urban habitat to help improve biodiversity.
The University of Surrey led project was a collaborative effort between the school, parents and residents’ groups, and researchers from Guildford Living Lab and Zero Carbon Guildford.
Results from project showed PM pollution levels dropped by nearly one-third compared to scenarios without the green infrastructure. Additionally, the living gate reduced traffic-related noise from the main road by 5 decibels.
Surrey Schools
Working with Surrey schools is crucial as air pollution poses a serious risk to children’s health and development. In the UK, most schools are in areas where air pollution levels exceed WHO limits for NO₂, PM10, and PM2.5. These pollutants can harm children’s physical health, cognitive function, and overall well-being. This vital work not only tackles the climate crisis but also ensures that environmental sustainability and public health are prioritised in education, paving a way for a greener, healthier future for all. By supporting schools to reduce emissions and promote active travel, the following provides two examples of programmes directly aligned with Surrey Joint Health and Wellbeing Strategy, by improving air quality and supporting healthier, more active lifestyles for children and families.
Eco-Schools
The Eco-Schools programme [137], the world’s largest environmental education initiative, offers a structured, seven-step framework to help schools embed sustainability across all aspects of learning and school operations. From reducing waste and conserving energy to increasing biodiversity and promoting active travel, pupils are empowered to lead change in their communities.
SCC continues to lead nationally in environmental education, with more schools than any other area in England achieving the internationally recognised Eco-Schools Green Flag Award for the second year running. To date, 98 schools across the county have earned this accolade, while over 170 schools are actively engaged in the programme. This success reflects the commitment of more than 52,000 pupils, including 2,200 young Eco-Committee members, who are making sustainability a central part of school life.
Surrey schools have already saved 1,096,638 kWh of energy and logged over 11,580 active journeys to school, including walking, cycling, and scooting directly supporting improvements in local air quality.
Let’s Go Zero
Surrey is also championing the ‘Let’s Go Zero’ campaign, the national movement uniting teachers, pupils, parents, and schools to become zero carbon by 2030. 110 schools are part of the ‘Let’s Go Zero’ campaign, committing to become net zero by 2030. [138]
Surrey Heartlands ICB asthma project
Air quality and children and young people (CYP)
Air quality plays a significant role in respiratory health, particularly among Children and Young People (CYP) with asthma. Poor air quality is associated with increased prevalence and severity of conditions, including:
- Asthma: Research indicates that approximately 4 million children globally develop asthma annually due to NO₂ exposure, primarily from traffic emissions.
- Respiratory Infections and Lung Function Decline: Long-term exposure to pollutants leads to increased respiratory infections and impaired lung development in children.
- Mental Health Impact: Studies have linked air pollution to higher rates of anxiety and depression in young people.
As part of the Surrey Heartlands CYP Asthma Project, understanding air quality impacts and integrating it into asthma management is essential. The National Bundle of Care for CYP with Asthma recognizes air quality as a critical environmental factor influencing asthma management. The framework includes specific capabilities to ensure healthcare professionals address air quality in asthma care:
- Understanding Air Pollution Effects: Healthcare professionals must be able to explain how both indoor and outdoor air quality affects respiratory morbidity and provide strategies for mitigation.
- Allergen & Environmental Awareness: Recognising and advising on asthma triggers, including pollution, allergens, and climate factors, is vital for comprehensive asthma care.
- Integrating Air Quality into Asthma Action Plans: CYP and their families should receive guidance on reducing exposure to air pollution and managing asthma in high-exposure environments.
The Surrey CYP Asthma Toolkit on the Healthy Surrey website highlights the importance of air pollution in asthma care and includes key recommendations:
- Cleaner Air for Schools Initiative: Encourages active travel, anti-idling campaigns, the walk to school campaign and air quality monitoring near schools to reduce exposure to pollutants.
- Health & Transport Policies: Promotes the adoption of ultra-low emission vehicles and better urban planning to reduce traffic-related air pollution.
- Asthma Management Resources: Provides asthma action plans, training for caregivers, and professional education on air quality-related asthma triggers.
Research indicates that children face a threefold increase in air pollution during morning drop-off periods compared to other times of the day. This spike is attributed to vehicles idling near school premises, leading to higher concentrations of PM2.5. [139]
Surrey Heartlands CYP asthma team
GP surgeries
The Surrey Heartlands CYP Asthma Team collaborated with General Practitioner (GP) surgeries in areas of deprivation and poor air quality. The team conducted specialist asthma reviews for children and young people at high risk of asthma attacks. They also raised awareness among CYP and families about the impact of poor air quality from nearby airports and motorways. Additionally, the team provided further education to clinical colleagues at GP practices, equipping them to share this knowledge with patients effectively.
The Surrey Heartlands CYP Asthma Team hold an annual conference for local clinicians to raise awareness on gaining the best outcomes for CYP with asthma. The theme in 2023 was CYP Asthma and Air Quality. Professor Prashant Kumar, Co-Director, Institute for Sustainability, Professor and Chair in Air Quality and Health, Founding Director, Global Centre for Clean Air Research, University of Surrey delivered a presentation on outdoor air quality in Surrey and the adverse effects for CYP, especially those with asthma.
Referral to Services and Lived Experience Surveys
To collect lived experiences from families affected by air quality-related health conditions, collaboration with various services is necessary:
- Healthcare Providers: GPs, respiratory specialists, and paediatricians treating CYP with asthma can help distribute surveys and share real-world data.
- Educational Institutions: Schools can engage families through asthma awareness programs and air quality improvement initiatives.
- Community Health Networks: Organisations supporting respiratory health can provide insights into the impact of air quality on daily life.
Asthma Friendly Schools
The Asthma Friendly School Standard to ensure that schools effectively support and manage students with asthma, has been implemented in Surrey with 26 schools currently accredited. This initiative focuses on increasing awareness, establishing comprehensive care plans, and fostering collaboration among schools, parents, carers, and healthcare professionals.
For schools aiming to achieve this accreditation, the process involves:
- Reviewing the supporting checklist available on the Healthy Surrey website or contacting the Children’s and Young People’s Asthma Team.
- Conducting a self-assessment to evaluate compliance with the asthma-friendly criteria.
- Upon meeting the criteria, arranging an online review with the Asthma Team.
- Receiving the asthma-friendly logo and certificate and being listed on the Healthy Surrey website.
- Performing an annual self-audit to maintain standards.
Achieving this standard not only enhances the health and well-being of students but also supports their educational attainment through improved attendance and engagement.
The Surrey Heartlands CYP Asthma Team worked in collaboration with the SAMHE project to promote the research regarding indoor air quality in classrooms which can be found on the SAMHE website. [140]
Damp and mould
Damp and mould in the home can significantly worsen asthma symptoms and increase the risk of severe attacks, particularly in children and those with pre-existing respiratory conditions. Prolonged exposure to mould and damp conditions can reduce lung function over time, increasing susceptibility to infections and making asthma more difficult to control. To minimise risk, homes should be well-ventilated, moisture levels controlled, and any signs of damp or mould addressed promptly. For those with asthma, maintaining a dry and clean-living space is essential to reducing triggers and improving overall respiratory health.
Working with SAA, SCC developed a self-help leaflet to support residents in reducing damp and mould in the home. The Surrey Heartlands CYP Asthma Team has actively promoted and disseminated this leaflet to clinical colleagues for distribution as appropriate.
In addition, the team has raised awareness among parents and carers of CYP with asthma, as well as clinical colleagues, through educational webinars. The CYP Asthma Network, hosted by NHS Surrey Heartlands ICB, includes representation from housing sector colleagues in some Boroughs, fostering collaboration to address housing-related asthma triggers.
Collaborative working with Surrey Air Alliance and other partners
By aligning with the SAA, the Surrey Heartlands CYP Asthma Project strengthens its approach to tackling air quality-related health inequalities through coordinated action and advocacy.
Addressing air quality is a vital component of asthma management in CYP. By integrating air quality considerations into clinical practice, community programs, and policy initiatives, asthma outcomes can be improved and health inequalities associated with pollution exposure reduced. Collaborative efforts between healthcare, education, and local government will ensure that children in Surrey breathe cleaner air and experience better health outcomes. [141] [142] [143]
The University of Surrey’s Global Centre for Clean Air Research provides resources to help schools mitigate children’s exposure to traffic pollution. [144]
These efforts underscore the importance of collaborative action to ensure healthier environments for children in Surrey.
Recommendations
- Surrey Air Alliance (SAA) to continue following Local Government Reorganisation in Surrey.
- All agencies to continue to work collaboratively through SAA to support behaviour change and practical measures to improve air quality, such as raising awareness of the health impacts of air pollution and emissions reduction both outdoor and indoor, through the SAA workplan.
- Develop a SAA communications plan for air quality.
- To explore development of a common website / dashboard for air quality following Local Government Reorganisation in Surrey.
- Develop a co-ordinated approach to use the DEFRA PM2.5 Targets: Interim Planning Guidance.
- To promote the rollout of EV charging points across Surrey using more social media platforms, coordinated to ensure collaborative coverage.
- To complete the air quality modelling planned for 2026/27.
- To explore the expansion of Ultra Fine Particulate (UFP) long-term monitoring to residential areas in the vicinity of Heathrow and across the motorway network in Surrey, to understand the impact of UFP and provide context for airport monitoring.
- Promote expansion and sign up of airTEXT service to cover all areas of Surrey.
- Raise awareness of the health impacts of domestic wood burning and explore a wood burning stove scrappage scheme with industry to replace old stoves with new eco design stoves to reduce particulate emissions.
- Use social media platforms to signpost residents to the ASRs when they are published to drive more engagement with air quality web pages and for more residents to see the ongoing work in reducing air pollution.
- Explore a Surrey wide ‘anti-idling’ campaign led by SAA in conjunction with Surrey Education Services (SES).
- Consider adding to the SAA workplan, an annual Surrey wide survey using both online tools and in person events, to collect residents’ views and awareness of local air quality.
Contributors
This JSNA has been developed in collaboration with a range of stakeholders through the Surrey Air Alliance, including:
Surrey County Council
- Public Health
- Transport
- Greener Futures
District and Borough Councils
- Elmbridge
- Epsom and Ewell
- Guildford
- Mole Valley
- Reigate and Banstead
- Runnymede
- Spelthorne
- Surrey Heath
- Tandridge
- Waverley
- Woking
Healthcare providers
- Surrey Heartlands ICB
- Frimley ICB
National Highways
By working together, partners can ensure that this JSNA provides a comprehensive and actionable assessment of air quality in Surrey.
Glossary of abbreviations
AQAP Air Quality Action Plan
AQG Air Quality Guidelines
AQIS Air Quality Information System
AQM Air Quality Management
AQMA Air Quality Management Area
AQO Air Quality Objective
ASR Annual Status Report
BC Black Carbon
BSIP Bus Service Improvement Plan
CAS Clean Air Strategy
CERC Cambridge Environmental Research Consultants
CHD Coronary Heart Disease
CMO Chief Medical Officer
CO Carbon Monoxide
COMEAP Committee on the Medical Effects of Air Pollutants
COPD Chronic Obstructive Pulmonary Disease
CPC Condensation Particle Counter
CYP Children and Young People
DAQI Daily Air Quality Index
DCO Development Consent Order
DEFRA Department for Food and Rural Affairs
DfT Department for Transport
ETS Environmental Tobacco Smoke
EU European Union
EV Electric Vehicle
FAQ Frequently Asked Questions
FIP Farnham Infrastructure Programme
GLA Greater London Authority
GP General Practitioner
HGV Heavy Goods Vehicle
HUG2 Home Upgrade Grant phase 2
ICB Integrated Care Board
JSNA Joint Strategic Needs Assessment
LCWIP Local Cycling and Walking Infrastructure Plan
LTP3 Local Transport Plan 3
LTP4 Local Transport Plan 4
NH3 Ammonia
NHS National Health Service
NICE National Institute for Health and Care Excellence
NMVOCs Non-Methane Volatile Organic Compounds
NO Nitric Oxide
NO2 Nitrogen Dioxide
NOx Nitrogen Oxides
O3 Ozone
PCN Primary Care Network
PHE Public Health England
PIV Positive Input Ventilation
PM Particulate Matter
SAA Surrey Air Alliance
SAMHE Schools Air quality Monitoring for Health and Education
SBC Spelthorne Borough Council
SCA Smoke Control Area
SCC Surrey County Council
SES Surrey Education Services
SO2 Sulphur Dioxide
SPD Supplementary Planning Document
UFP Ultra Fine Particulates
UK United Kingdom
UKHSA UK Health Security Agency
ULEZ Ultra Low Emissions Zone
URBOA Urban Biodiversity Opportunity Areas
VOCs Volatile Organic Compounds
WBC Woking Borough Council
WHO World Health Organisation
References
[1] The Surrey Context: People and Place | Surrey-i
[2] WHO – Air quality, energy and health
[3] How have the Covid pandemic and lockdown affected air quality in cities.pdf
[4] Nitrogen dioxide (NO2) – GOV.UK
[6] Nitrogen Dioxide in the UK – Summary (DEFRA)
[7] Nitrogen dioxide: health effects of exposure – GOV.UK
[8] Emissions of air pollutants in the UK – Particulate matter (PM10 and PM2.5) – GOV.UK
[9] Particulate matter (PM10/PM2.5) – GOV.UK
[10] Monitoring ambient air: particulate matter – GOV.UK
[11] Causes of air pollution – DEFRA UK Air – GOV.UK
[14] 2112200932 Ozone in the UK Recent Trends and Future Projections.pdf
[15] Emissions of air pollutants in the UK – Sulphur dioxide (SO2) – GOV.UK
[16] Sulphur dioxide: general information – GOV.UK
[17] Emissions of air pollutants in the UK – Ammonia (NH3) – GOV.UK
[18] Ammonia | National Atmospheric Emissions Inventory
[19] Ammonia: health effects, incident management and toxicology – GOV.UK
[20] Carbon monoxide: general information – GOV.UK
[21] Carbon monoxide poisoning – NHS
[22] Emissions of air pollutants in the UK – Non-methane volatile organic compounds (NMVOCs) – GOV.UK
[23] NON-METHANE VOLATILE ORGANIC COMPOUNDS
[24] Non methane VOC | National Atmospheric Emissions Inventory
[25] UK Parliament Post – Indoor Air Quality.pdf
[26] Carbon monoxide (CO) – GOV.UK
[27] Carbon monoxide poisoning – NHS
[28] Air quality: UK guidelines for volatile organic compounds in indoor spaces – GOV.UK
[29] JSNA Smoking, Vaping and Tobacco Control | Surrey-i
[30] UK Parliament Post – Indoor Air Quality.pdf
[31] Chief Medical Officer’s Annual Report 2024 – Health in Cities
[33] What are the WHO Air quality guidelines?
[34] Directive on ambient air quality and cleaner air- EU – 2024/2881 – EN – EUR-Lex
[35] The Air Quality Standards Regulations 2010
[36] The Environmental Targets (Fine Particulate Matter) (England) Regulations 2023
[37] The air quality strategy for England – GOV.UK
[38] Environmental Improvement Plan 2023
[39] Ηow air pollution affects our health | European Environment Agency’s home page
[40] Air pollution: applying All Our Health – GOV.UK
[41] New tool calculates NHS and social care costs of air pollution – GOV.UK
[42] Health matters: air pollution – GOV.UK
[43] Daily Air Quality Index – DEFRA UK Air – GOV.UK
[45] The Air Quality (England) Regulations 2000
[46] The Air Quality Standards Regulations 2010
[48] The Environmental Targets (Fine Particulate Matter) (England) Regulations 2023
[49] Air quality plan for nitrogen dioxide (NO2) in UK (2017) – GOV.UK
[50] Clean Air Strategy 2019 – GOV.UK
[51] Environmental Improvement Plan 2023 – GOV.UK
[52] Air quality strategy: framework for local authority delivery – GOV.UK
[55] NICE Improving Indoor Air Quality
[56] Committee on the Medical Effects of Air Pollutants – GOV.UK
[57] National Planning Policy Framework – Guidance – GOV.UK
[58] Chief Medical Officer’s Annual Report 2024 – Health in Cities
[59] Report: Air Quality Information System Review: Final Report and Recommendations – DEFRA UK Air – GOV.UK
[60] Inquest into the Death of Ella Adoo-Kissi-Debrah
[61] Global Centre for Clean Air Research | University of Surrey
[62] IAQM Land-Use Planning and Development Control: Planning for Air Quality
[63] Clean Air Night | Global Action Plan
[64] Clean Air Day | Action for Clean Air
[65] Surrey Air Quality for Schools Programme
[66] airText – Air pollution forecasts for Greater London, Chelmsford and Colchester
[67] Air Quality – Surrey Deliverables
[68] Air Quality in the United Kingdom
[69] Local air quality measurements and actions | Elmbridge Borough Council
[71] EBC Final AQAP 2021 to 2026 – Copy
[72] Clean air | Elmbridge Borough Council
[73] Air quality | Elmbridge Borough Council
[74] Sustainable Elmbridge | Elmbridge Borough Council
[75] Epsom & Ewell Air Quality ASR 2024.pdf
[76] Ewell High St AQMA Revocation Order
[78] Climate Change | Epsom and Ewell Borough Council
[79] Air quality | Epsom and Ewell Borough Council
[80] UK Ambient Air Quality Interactive Map
[81] Find out how we monitor air quality and pollution – Guildford Borough Council
[82] Network – easitGUILDFORD A3
[83] AQMA ORDER (The Street Compton) 1 February 2018.pdf
[84] Guildford Shalford AQAP Revision 15 July 2020 approved.pdf
[85] Guildford Town Centre AQMA Boundary 22-10-2021.pdf
[87] Cleaner Air Day comes to Guildford Sunday – Guildford Borough Council
[88] Guildford Borough Council supports Clean Air Night – Guildford Borough Council
[89] Guildford Borough Local Plan Strategy and Sites 2015-2034
[90] Air pollution – Guildford Borough Council
[91] 2024 Mole Valley Air Quality Annual Status Report
[93] Climate Change Strategy |
[94] Air quality reports | Air quality reviews and reports | Reigate and Banstead
[95] Environmental Sustainability Strategy 2024 | Reigate and Banstead
[97] Air Quality Annual Status Report 2013
[99] Air quality – Runnymede Borough Council
[100] Climate Change Action Plan – Runnymede Borough Council
[101] Air quality – reports – Spelthorne Borough Council
[102] Agenda for Environment and Sustainability Committee on Tuesday, 23 January 2024, 7.00 pm – Spelthorne Borough Council
[103] Air quality – reports – Spelthorne Borough Council
[104] Spelthorne Local Cycling and Walking Infrastructure Plan (LCWIP) – Surrey County Council
[105] Climate Change Strategy – Spelthorne Borough Council
[106] Supplementary Planning Documents – Spelthorne Borough Council
[107] Air quality – Spelthorne Borough Council
[108] Air quality alerts – Spelthorne Borough Council
[109] Heathrow Strategic Planning Group – Working together to drive sustainable growth for the sub-region
[110] Council for the Independent Scrutiny of Heathrow Airport CISHA
[111] Heathrow Airwatch | Home
[112] Heathrow UFP Summary Report
[113] Air quality management in Surrey Heath | Surrey Heath Borough Council
[114] Climate change action plan | Surrey Heath Borough Council
[115] Air Quality Annual Status Report 2024
[117] Climate Change | Your council | Tandridge District Council
[118] Air quality | Environmental concerns | Tandridge District Council
[119] Waverley Borough Council – Air Quality monitoring service
[120] 2024 air quality status report.pdf
[121] Air Quality Management Areas (AQMAs) | Waverley Borough Council
[122] Farnham Infrastructure Programme – Farnham Town Council
[123] final aqap app 221130 Waverley aqap 2023 final with appendices 2may23.pdf
[125] How We Monitor Air Quality | Waverley Borough Council
[126] 2024 air quality status report.pdf
[127] Farnham Infrastructure Programme – Surrey County Council
[128] Climate Change Strategy & Action Plan | Waverley Borough Council
[129] Air Quality | Waverley Borough Council
[130] Woking Air Status Report 2024.pdf
[131] Climate change | Woking Borough Council
[132] Air quality | Woking Borough Council
[133] Air quality reports – National Highways
[134] Local Transport Plan (LTP4) – Surrey County Council
[135] Surrey’s climate change adaptation and resilience strategy – Surrey County Council
[136] Greener futures climate change delivery plan 2021 to 2025 – Surrey County Council
[137] Our Programme — Eco Schools
[138] UK Climate Change • Let’s Go Zero
[139] Children face three times more air pollution during the school drop-off | University of Surrey
[140] Schools Air Quality Monitoring for Health and Education SAMHE
[141] Surrey research on mitigating air pollution around schools is shared in China | University of Surrey
[142] Healthy Surrey – Surrey School Air Quality Programme Report
[143] Asthma friendly school | Healthy Surrey
[144] Pollution guidance for schools | University of Surrey
Acknowledgements
Project team
| Name | Role | Job Title / Organisation |
| Katie Owens-Guraya | Project Manager | Advanced Public Health Analyst SCC |
| Lisa Harvey-Vince | Project Supervisor | Health Protection Team Manager SCC |
| John Cole | Lead Author | Health Protection Programme Lead SCC |
JSNA chapter working group
| Name | Department | Job Title / Organisation |
| Steve Howard | Environment & Planning | Transport Strategy Manager SCC |
| Edward Cowley | Greener Futures | Climate Change Officer SCC |
| Isabelle Baverstock | Greener Futures | Senior Climate Change Officer SCC |
| Nicola Bassani | NHS ICB Surrey Heartlands | Senior Programme Manager |
| Cyane Sullivan | NHS ICB Frimley | Prevention and Health Inequalities PM |
| Leon Hibbs | Reigate & Banstead BC | Environmental Health Officer |
| Paul Leadbeater | Elmbridge BC | Principal Environmental Health Officer |
| Claire Lucas | Spelthorne BC | Principal Pollution Control Officer |
| Eliane Foteu | Spelthorne BC | Pollution Control Officer |
| Gary Durrant | Guildford BC | Environmental Protection Lead |
| Anjani Papai | Guildford BC | Compliance Officer Environmental Protection |
Surrey Air Alliance contributors
| Name | Organisation | Job Title |
| Ann Zhang | Surrey Heath BC | Scientific Officer |
| Lucy Hawkings | Runnymede BC | Contaminated Land and Air Quality Officer |
| Oliver Nelson | Epsom & Ewell BC | Public Protection Manager |
| Tara Hellaby | Woking BC | Environment Officer |
| Jeanette Guy | Waverley BC | Environmental Health Manager |
| David Bryant | Tandridge DC | Environmental Health Officer |
| Del Smith | Mole Valley DC | Environmental Health Team Lead |
| Suzanne Bailey | NHS ICB Surrey Heartlands | CYP Clinical Respiratory Lead |
| Andrew Bean | National Highways | Principal Air Quality Advisor |