Theme 1: Financial security and employment
Understanding Inequality in Surrey
Theme 1: Financial Security and Employment
Skip to:
What does the data tell us about Surrey?
What does this mean for Surrey?
What does the data tell us about Surrey?
Financial security is one of the most important foundations of living a good life, and being in work is one of the strongest factors predicting good outcomes across a range of other areas including physical and mental health.
Surrey has a strong economy and low levels of unemployment. However, beneath these figures there are significant differences in outcome for some groups in the county.
Data from the annual population survey showed that in 2024, 80.1% of the working age population of Surrey are in work, with a further 17.6% economically inactive, meaning they are not actively looking for work. This includes groups such as students and those who are not working due to childcare or caring responsibilities. This means only 2.8% of Surrey’s working age population is classed as unemployed, or 1 in every 36 people.
Among working age people from ethnically diverse backgrounds (excluding white ethnic minorities), 71.8% are in work, with 23% economically inactive. This means that 6.7% of people from ethnic minority backgrounds are unemployed, or 1 in 15 people, more than double the rate of the general population (2.8%)[1].
Employment rate of 16-64 year olds in Surrey by ethnic group
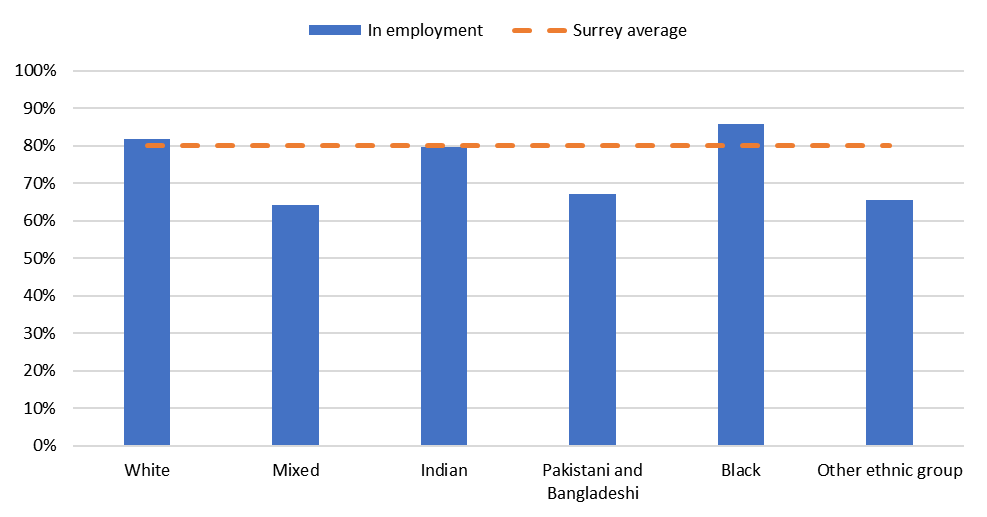
Among working age disabled residents, the employment rate drops to 68%, compared to the non-disabled employment rate of 82%.
Theme 2 of this evidence base looks at educational attainment and highlights that some ethnic communities are less likely to hold higher level qualifications, notably Gypsy and Irish Traveller, Roma and Bangladeshi communities. However, even when looking at people in Surrey who do hold level 4 qualifications (degree or other equivalent qualifications), there are still significant differences in the types of work they do.
One in 4 White British people who have a level 4 qualification are in managerial roles, a figure which drops to 1 in 8 for those from Irish Traveller and Gypsy backgrounds.
Percentage of level 4 qualification holders in managerial roles
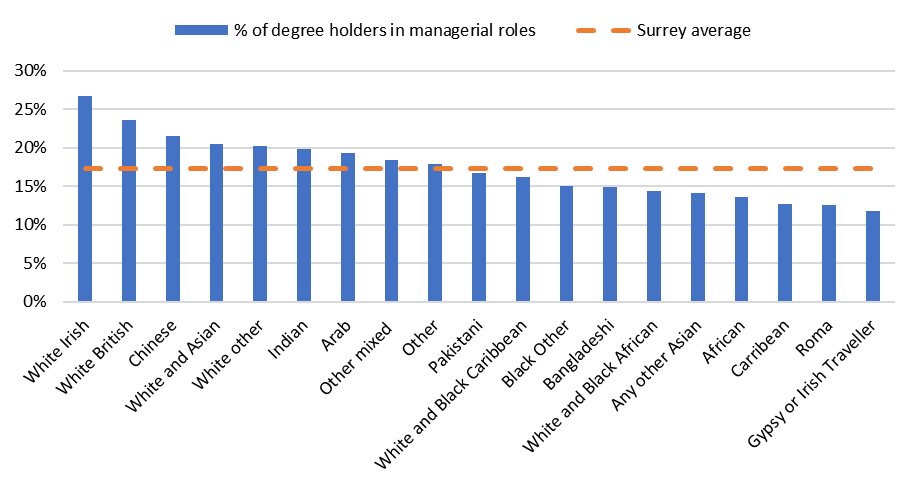
Gypsy/Irish Traveller, Roma, Black Caribbean, Black African, Black other, other Asian, mixed White and Black African, and Bangladeshi level 4 qualification holders in Surrey are the least likely to be in managerial roles. People from White British and White Irish backgrounds by contrast are much more likely than average to be. This could indicate that achieving degree-level qualifications is not having the same positive outcome on job prospects for some in our communities.
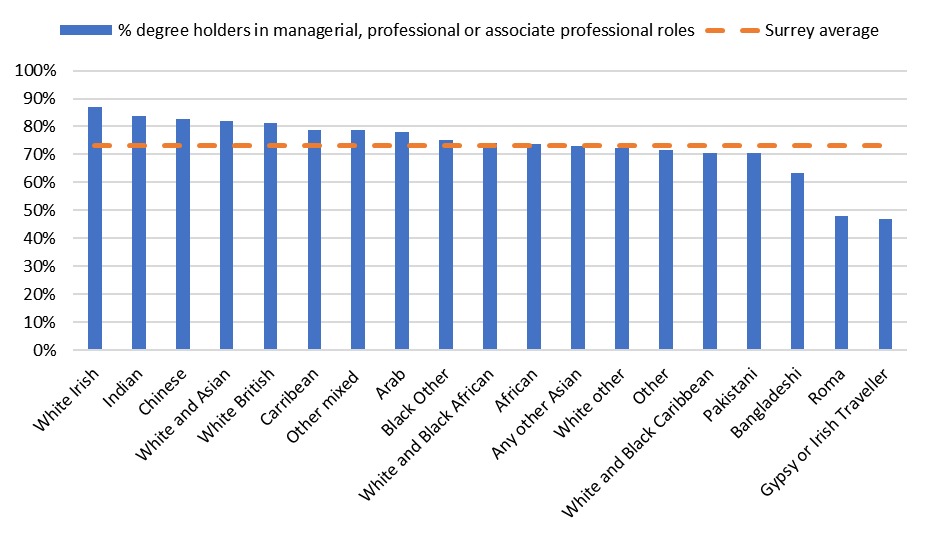
If we widen the scope of jobs looked at, and include other professional and associated professional roles, disparities persist. Over 80% of White British degree holders are in one of these types of roles, while under 50% of degree holders from Gypsy/Irish Traveller and Roma backgrounds are, and just over 60% of degree holders from Bangladeshi backgrounds:
Percentage of level 4 qualification holders in managerial, professional or associated professional roles
Data on Universal Credit recipients in Surrey from May 2024 show consistent growth in the number of people receiving Universal Credit since 2022. The age group most likely to be receiving the benefit are 30-34 year olds, with 13% of this age group on Universal Credit. More than half of households in Surrey on Universal Credit include children. In Surrey, women who receive Universal Credit are more likely to be in work than men who receive the benefit. This indicates that women are more likely to be in low-paid employment and require benefits to help them meet their needs.
The Office for National Statistics provides estimates of the gender pay gap (the difference in average earnings for men and women) by geographical area. The 2024 figures for Surrey show a significantly wider than average median pay gap between men and women in the county. In Surrey, women earn on average nearly 21% less than men, compared to a national average pay gap of just over 13%.
Research undertaken into the ‘cost of living crisis’ in Surrey shows the impacts of poverty and financial insecurity in the county. Ethnographic research carried out by Surrey County Council has also shown how this particularly affects women and people who are carers. Women are more likely to be missing out activities, skipping meals and not able to afford a full grocery shop and both women and carers report their mental health as more impacted by the crisis. The research also shows the significant impact of poverty on people’s health and wellbeing, with people in the worst affected areas having rates of anxiety and depression 5 times the national average, as well as having significantly raised rates of chronic illness.
Nearly 20,000 children in Surrey live in absolute low-income households[2], which equates to 1 in 12 of all children in the County. Over two-thirds of children living in poverty have at least one adult in the household in employment. More children in poverty live in lone parent families in Surrey, and this number has gone up by over 1,500 since 2021. The majority of lone parents are women.
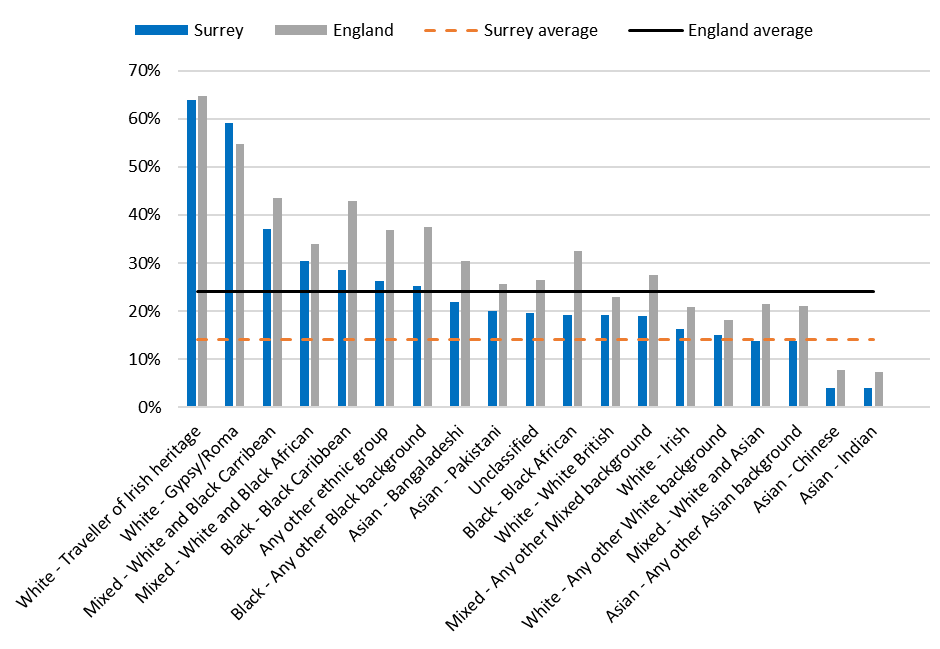
Overall, 14% of children in Surrey are eligible for Free School Meals (FSM), significantly lower than the England average of 24%. However, children from Gypsy/Roma backgrounds in Surrey are more likely to be on FSM (62%) than the average for this group across England (55%). The other ethnic groups in Surrey most likely to be eligible for FSM are White – Traveller of Irish heritage (59%), Mixed – White and Black Caribbean (30%), Black – Black Caribbean (28%) and any other Black background (24%). The ethnic groups least likely to be eligible for FSM are Asian – Chinese (2%), Asian – Indian (3%), White Irish (7%), Mixed – White and Asian (9%), and Other White backgrounds (11%).
Eligibility for means-tested Free School Meals
What does this mean for Surrey?
Poverty is the key driver of inequality in Surrey, with access to good, secure and well-paid employment being a key protective factor against poverty. The data here shows how some groups in our society, most notably people from non-White ethnic backgrounds, women and disabled people, are faring less well in terms of employment and pay in Surrey.
While we focus on the impacts of the cost-of-living crisis in the county we need to recognise how residents from these groups are more affected by financial exclusion and to try to identify and tackle the factors causing this inequity. We must also recognise that being financially excluded can exacerbate the exclusion that people from these groups may already face. For example, being disabled may bring with it challenges for any person, but if a disabled person is experiencing poverty, the impacts of the additional costs that being disabled can bring will be much harder to absorb.
Any anti-poverty activity in Surrey needs to be aware of this complex interplay of drivers and effects of poverty on our most excluded populations and ensure that interventions are tailored to meet their needs.
Where can you find out more?
Information sources quoted in the text:
Datasets on the gender pay gap (Office for National Statistics)
Report on the Cost of Living Crisis (Surrey-i)
Dashboard on low income and unemployment data (Surrey-i)
Report from the Cost of Living survey (Surrey Coalition of Disabled People)
Signposting to further reading:
Reports on insecure Work (Lancaster University)
Cost of Living crisis webpage and reports (Surrey Coalition of Disabled People)
Data on the Surrey workforce, jobs and employees (Surrey-i, 2025)
[1] This data is not provided broken down by the more detailed ethnic categories used in the Census
[2] Households which have less than 60% of the median income in 2010/11 held constant in real terms