Theme 4: Independent and secure living conditions
Understanding Inequality in Surrey
Theme 4: Independent and Secure Living Conditions
Skip to:
What does the data tell us about Surrey?
What does this mean for Surrey?
What does the data tell us about Surrey?
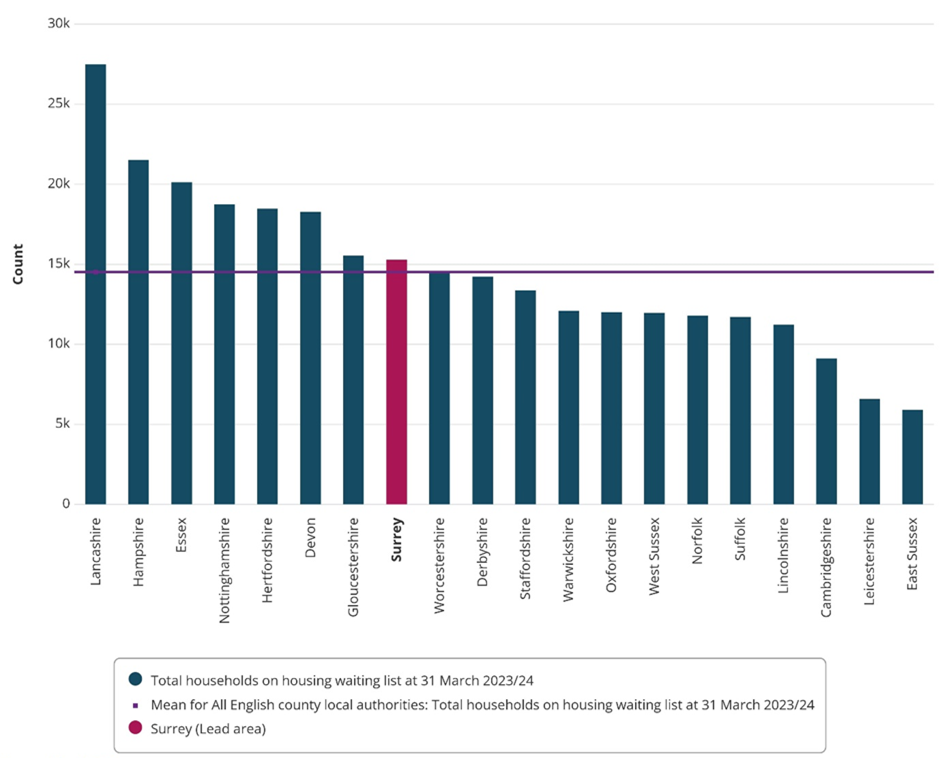
Having secure, independent housing is key to ensuring a person’s wellbeing, their employment, health, and relationships. The Housing Strategy for Surrey (2023) recognises that there is a housing crisis in Surrey, with affordability a significant issue. The average house price in the county is over 13 times the average salary, among the highest rates in the South East. There is a shortage of social housing, with Surrey having an above average number of households on the social housing waiting list among English county areas:
Total households on the housing waiting list at 31st March (2023/24) for All English county local authorities
Research on issues facing rural populations in Surrey highlights the very low level of affordable rented accommodation in our rural areas. These areas already have an older than average age profile and the lack of housing to rent in rural areas is further pushing young people out of these areas, exacerbating the demographic imbalance.
The Housing Strategy recognises the link between lack of affordable housing and poverty, health inequalities, community and the ability to recruit staff for businesses and the public sector. The Housing and Related Support JSNA chapter provides a detailed analysis of housing-related issues in Surrey and is an invaluable resource, which demonstrates the links between housing and mental and physical wellbeing. It notes the connection between housing tenure and wellbeing, noting that those in private rented sector are at most risk of housing related harm and that owner-occupiers report better health outcomes. This section of the evidence base attempts to complement that resource by looking at housing outcomes for some of our communities and populations.
By looking at the Census 2021 data relating to households[1], we can see that there are groups who are disproportionately impacted by inadequate housing. The Census defines a household as all the people who occupy a housing unit (such as a house or apartment) as their usual place of residence. A household includes the related family members and all the unrelated people, if any, such as lodgers, foster children, wards, or employees who share the housing unit.
A household is classified as deprived if the household’s accommodation is either overcrowded, in a shared dwelling, or has no central heating. The graph below shows the percentage of households from each ethnic group in Surrey that are considered deprived according to the 2021 Census:
Percentage of households* from each ethnic group in Surrey that are classed as deprived
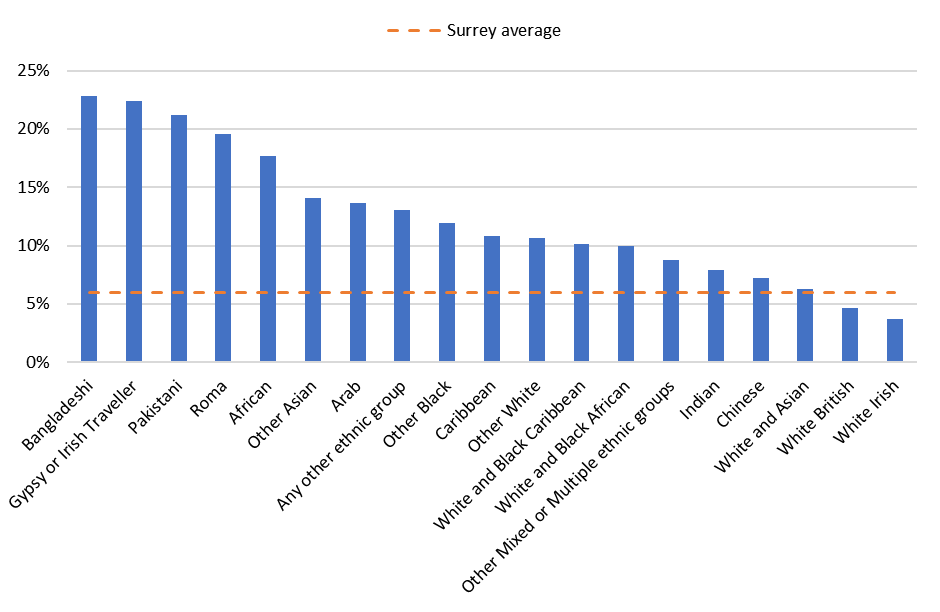
*Ethnicity taken as that of the “Household Reference Person” (HRP) – namely the individual used as a reference point for characterizing a household. This is typically the owner or renter of the accommodation, or the person legally responsible for it.
The below graph shows the percentage of households in Surrey that are overcrowded, split by ethnicity from the 2021 census. Households are judged to be overcrowded if they lack 1 or more bedrooms for the number of residents (according to the bedroom standard).
Percentage of households* from each ethnic group in Surrey that are overcrowded
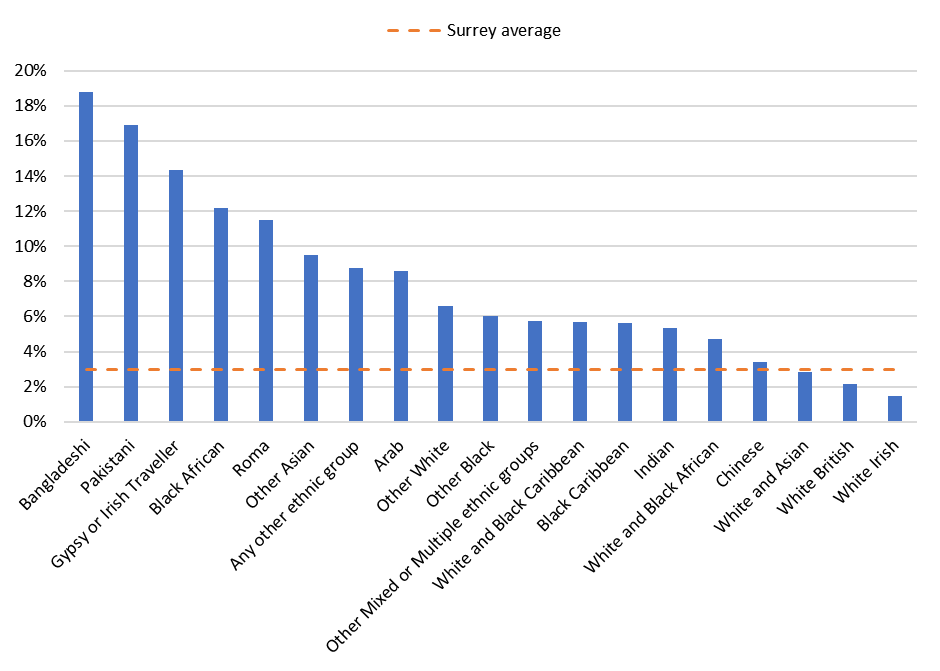
*Ethnicity taken as that of the “Household Reference Person” (HRP) – namely the individual used as a reference point for characterizing a household. This is typically the owner or renter of the accommodation, or the person legally responsible for it.
Census data also shows some significant variations in housing tenure between different ethnic groups in Surrey. Nearly 4 in 10 White British and White Irish residents own their home outright, over 4 times higher than the rates for Black African, Bangladeshi, Black Caribbean, and Roma residents.
Percentage of households* from each ethnic group in Surrey owning house outright
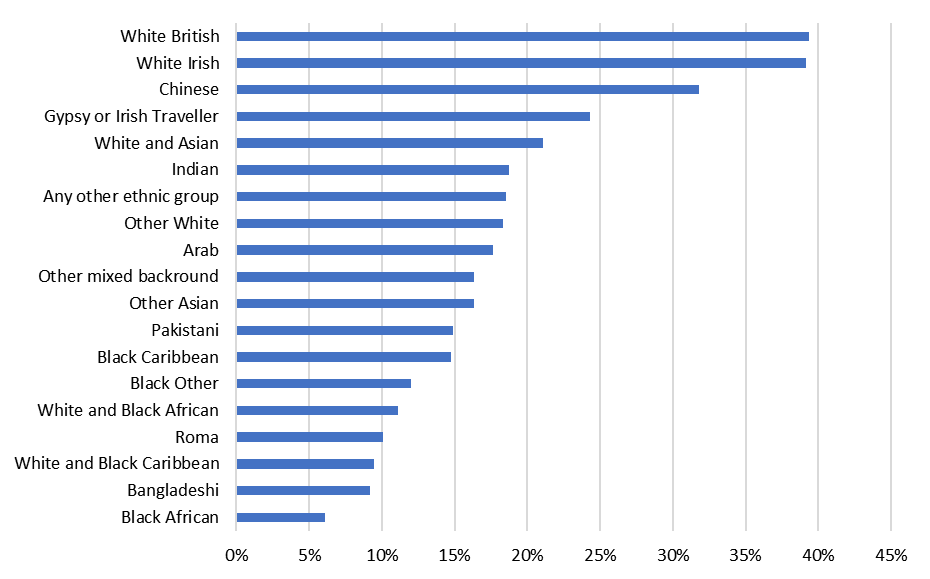
*Ethnicity taken as that of the “Household Reference Person” (HRP) – namely the individual used as a reference point for characterizing a household. This is typically the owner or renter of the accommodation, or the person legally responsible for it.
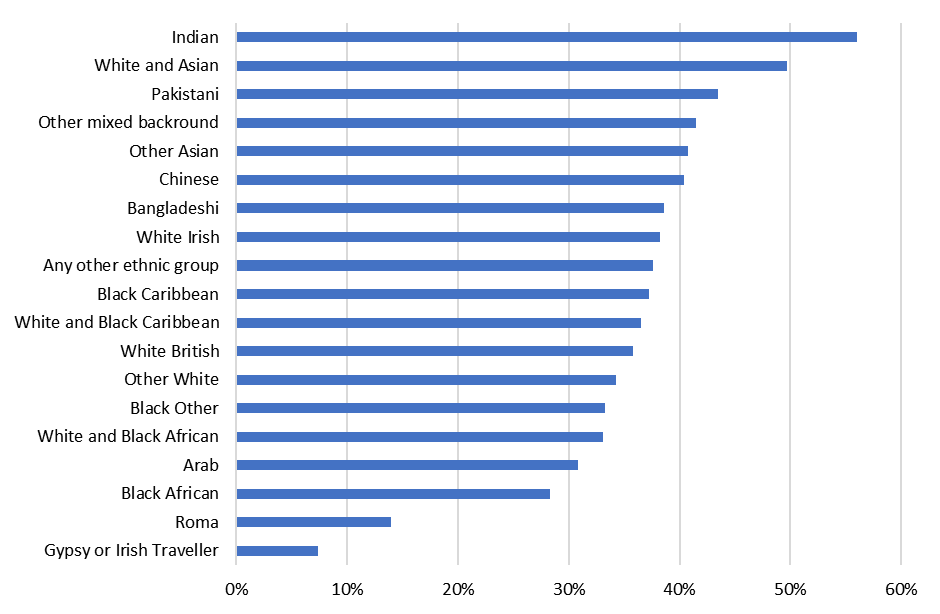
Residents of Indian heritage are the most likely to own a house with a mortgage, with over half of this group doing so (56%), compared to 7% of people from Gypsy or Irish Traveller and 14% from Roma backgrounds.
Percentage of households* from each ethnic group in Surrey owning house with mortgage
*Ethnicity taken as that of the “Household Reference Person” (HRP) – namely the individual used as a reference point for characterizing a household. This is typically the owner or renter of the accommodation, or the person legally responsible for it.
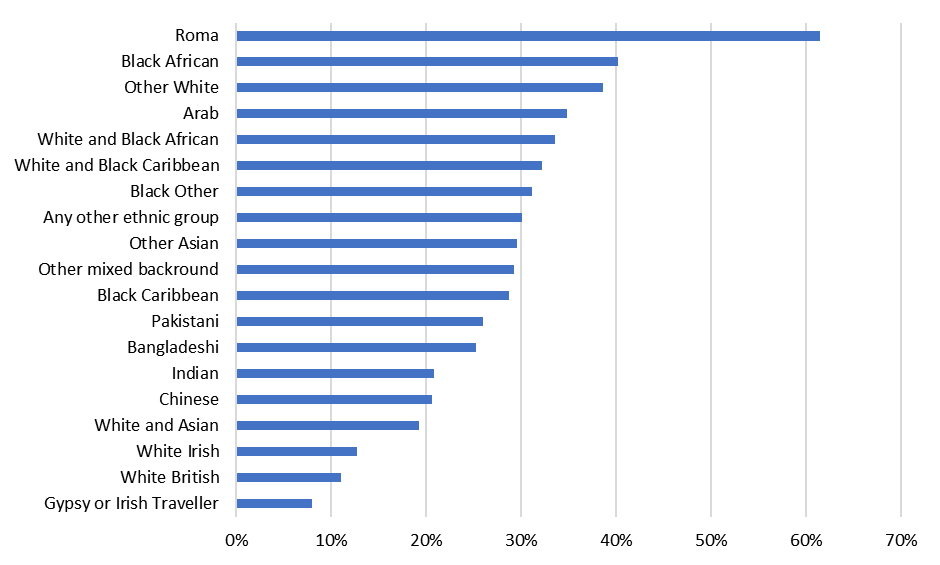
People from Roma backgrounds are the most likely to be in private rented accommodation by a considerable margin (around 62%), while those from Gypsy and Traveller (around 8%), White British (around 11%), and White Irish (around 13%) backgrounds are the least likely:
Percentage of households* in private rented accommodation
*Ethnicity taken as that of the “Household Reference Person” (HRP) – namely the individual used as a reference point for characterizing a household. This is typically the owner or renter of the accommodation, or the person legally responsible for it.
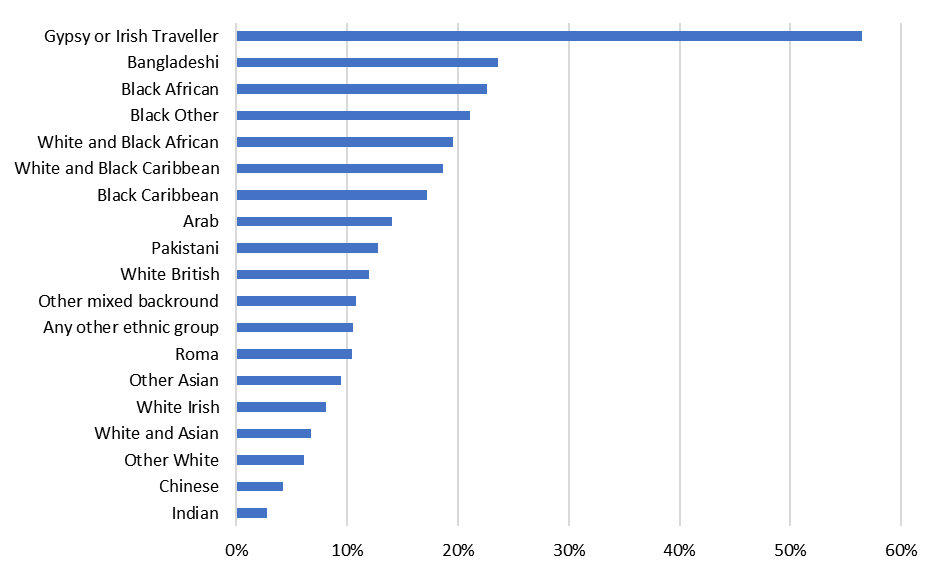
Gypsy and Irish Traveller residents are most likely to be in social rented accommodation, with over 50% of this group being in socially rented accommodation. People from Indian and Chinese backgrounds are the least likely – at 3% and 4% respectively.
Percentage of households* in social rented accommodation
*Ethnicity taken as that of the “Household Reference Person” (HRP) – namely the individual used as a reference point for characterizing a household. This is typically the owner or renter of the accommodation, or the person legally responsible for it.
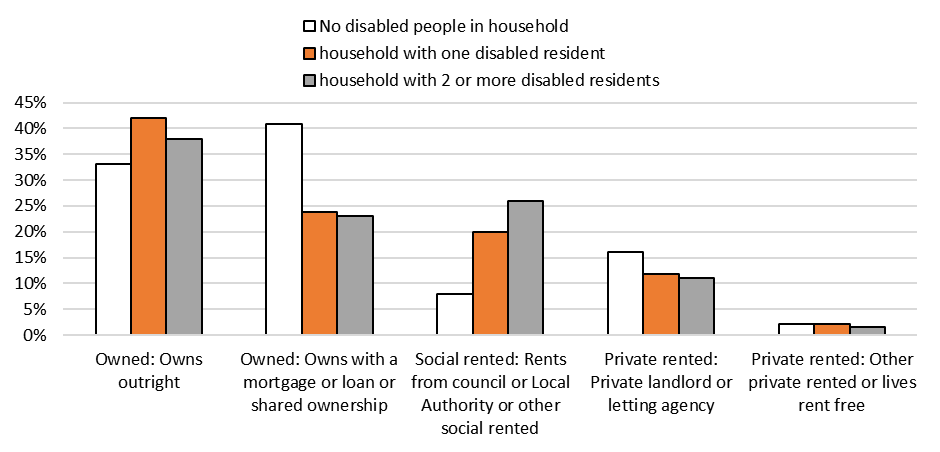
Households where there are one or more disabled residents are more likely to own their house outright than those without disabled residents (below). Rates of outright house ownership go up with age, however, as do rates of disability so this may simply reflect the age profile of disabled residents. Disabled households are also more likely to be in social rented housing than the non-disabled population, and less likely to be in private rented accommodation.
Housing tenure in Surrey of households with disabled residents
Census data does not provide figures on homelessness, but the link between homelessness and mental ill health is set out in the Emotional and Mental Wellbeing Strategy for Surrey. This strategy recognises that poor mental health is both a cause and consequence of homelessness. Those who are homeless are known to be at an increased risk of poor mental health outcomes, when compared to the general population, with 45% of people experiencing homelessness in the UK having been diagnosed with a mental health issue. Compared with the general population, homeless people are twice as likely to have a common mental health condition, and psychosis is up to 15 times more prevalent. They are also over 9 times more likely to complete suicide.
The Emotional and Mental Wellbeing in Surrey Adults Chapter of the JSNA also gives details on the proportion of adults in contact with secondary mental health services who are in stable and appropriate accommodation. It shows that in Surrey (2020/21), less than half (48%) of adults who are in contact with secondary mental health services live in stable and appropriate accommodation compared to over 60% nationally. Over half of mental health service users lack housing security which could negatively impact their recovery journey. Stable accommodation in 2020/21 had declined significantly since 2017/18.
Data from the JSNA Housing and related support chapter shows that households where the lead applicant is Black are significantly overrepresented among homeless households in Surrey. The age groups most affected by homelessness are the 25 to 34 and 35 to 44 year olds, although this will mask the number of children affected as they will not appear as the main applicant.
A Gypsy, Roma and Traveller Rapid Needs Assessment was undertaken as part of the Surrey Covid-19 Community Impact Assessment. This highlighted that there is insufficient accommodation to meet local need, and overcrowding and poor conditions on some sites. It also highlighted that there is widespread distrust of services, meaning people often do not disclose health and wellbeing issues. There are ongoing and established systemic issues that impact the way in which the Surrey system is able to identify and respond to the needs of the GRT communities effectively.
As seen in the chapter on Surrey’s population, we have significant numbers of people of working age who were born abroad and we know that migrant communities in general are younger and more economically active than those born in the UK. For those who arrive seeking sanctuary in Surrey, though, routes to work are currently not open to them and significant backlog of processing of asylum claims has led to increased pressures on asylum accommodation across the country, with people often housed in overcrowded and unsuitable asylum dispersal accommodation. Once a person’s asylum claim has been accepted they then become ineligible for asylum accommodation and are required within a matter of weeks to find housing within the private rented sector, which is often insecure, scarce, expensive and related to worse health and wellbeing outcomes. A recent report from the Director of Public Health into the health needs of vulnerable migrant communities highlighted the issues with housing that sanctuary seeking populations face including poor quality accommodation, overcrowding, fuel poverty and sanitation. This includes people fleeing recent conflicts in Ukraine, Afghanistan and Syria. Where people have no recourse to public funds as part of their immigration status, this can also make it extremely difficult for them to access support when experiencing issues such as exploitation and domestic abuse.
What does this mean for Surrey?
The data shows that there are significant differences in housing tenure for different communities in Surrey and we need to be aware of these disparities when we talk about the housing crisis in the County. Each area of our housing stock has its own issues, from rising rents in the private sector, to lack of availability of social housing and increasing house price unaffordability and mortgage costs. It is likely from looking at the data that each of these issues will have disproportionate impacts on those groups who are more likely to be in that tenure of housing.
It is clear as well that there is a significant issue around housing (availability and suitability) for asylum-seeking populations. National policy decisions and backlogs from the pandemic mean there is significant strain on this area of housing and some of our most vulnerable communities are facing intense insecurity and frequent moves. This then impacts on the ability of newly arrived populations to engage meaningfully with the community and play a positive part in our County.
Given our ageing population and increasingly unaffordable housing, we are at risk of pricing younger populations out of the County who will be needed to do the jobs and provide the support an older population requires. This may be particularly acute in some of our more rural areas where populations are ageing more quickly and housing can be particularly unaffordable. Given this, we need to be aware of the potential for exploitation within the care system, such as that set out in a recent report on modern slavery by the Unseen organisation.
Where can you find out more?
Information sources quoted in the text:
Housing Strategy for Surrey (Surrey County Council, 2023)
Research report on A Snapshot of Rural Surrey (Cirican Consulting and Surrey County Council, 2023)
JSNA chapter on Housing and Related Support (Surrey-i, 2024)
JSNA chapter on Emotional and Mental Wellbeing in Surrey, homelessness section (Surrey-i, 2023)
Rapid Needs Assessments for the impact of Covid-19 on Surrey residents (Surrey-i, 2020)
Report on the health needs of vulnerable migrant communities (Surrey County Council, 2024)
Report on modern slavery in the care sector (Unseen, 2023)
Signposting to further reading:
[1] NB all figures in this section refer to the % of each ethnic group that fall into each housing category, not the % of the overall population in that category who are from each ethnic group. For example, the following graph shows that 23% of people of Bangladeshi origin live in households that are deprived and NOT that 23% of deprived households are people from Bangladeshi origin.