Understanding Inequality: Who lives in Surrey?
Understanding Inequality in Surrey
Who lives in Surrey? Demographics of the Surrey Population
Skip to:
Sexual orientation and gender identity
Age and Sex
The largest age groups in Surrey are 45-49 and 50-54 year olds. Compared to England averages, we have more people in all age groups between 40 and 59 and fewer people aged 20-39 years. We also have more people aged over 70 than the England average.
Proportion of residents by 5 year age and sex: Surrey compared to England proportions
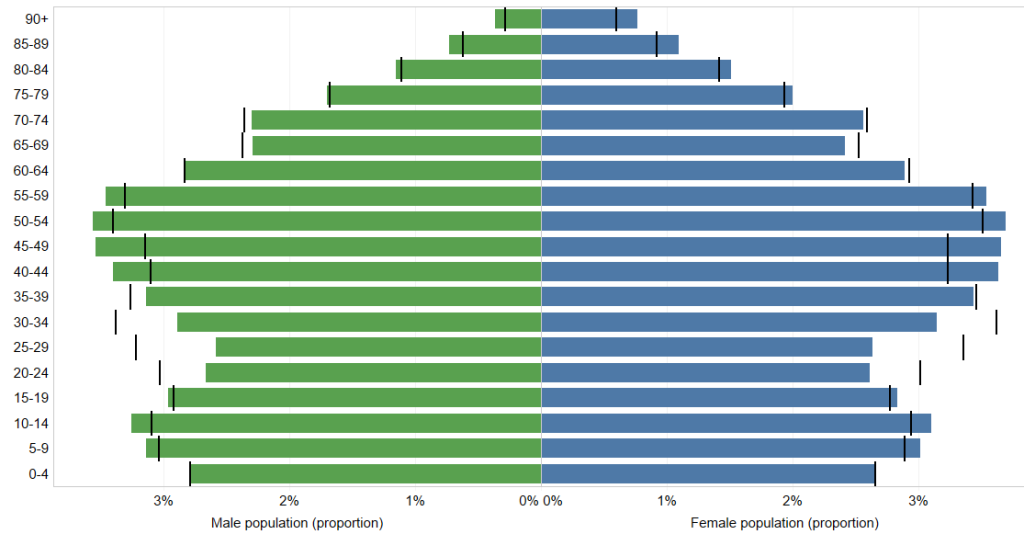
The fastest growing cohort of people in Surrey are those aged 70-74, with this group growing by 34% since the last census. Our population is predicted to age further by 2030, with more people in all age groups aged 55 and over and fewer people in most age groups below 55.
Birth rates in Surrey are dropping, from 13,500 in 2013 to under 12,000 in 2020. Our population aged under 4 has declined by 8% since 2011, reflecting a drop in birth rate similar to that seen across England.
Across England, over a third of births are to at least one parent who was born abroad and the picture is similar in Surrey. 36% of births in the County in 2023 were where one or both parents were born outside the UK. This varies greatly by area, however, with over 50% in Woking compared to 23% in Tandridge.
Overall, 51.3% of Surrey’s population is female. This is slightly above the national position for England of 51.0%, reflecting our older population structure. The proportion of residents who are female generally increases with age: 48.7% of those aged 4 or under are female, compared to two thirds (67.6%) of those aged 90 or older.
The data shows a number of demographic shifts in Surrey. Our population is getting older, and our falling birth rate puts us below a replacement rate required for a stable population. Data from the Council’s Economy and Growth Strategy[1] looks at the ratio of dependents to the working age population (the number of people aged 16-64 compared to those under 16 or over 65). Surrey has a dependency higher than the England average (0.62 versus 0.59) meaning we have more people in the County who are not of working age compared to our working age population.
Where we see population growth, particularly among people of working age, this will likely come through inward migration. Our younger population is already much more ethnically diverse than our older population and this trend is likely to continue.
Health and Disability
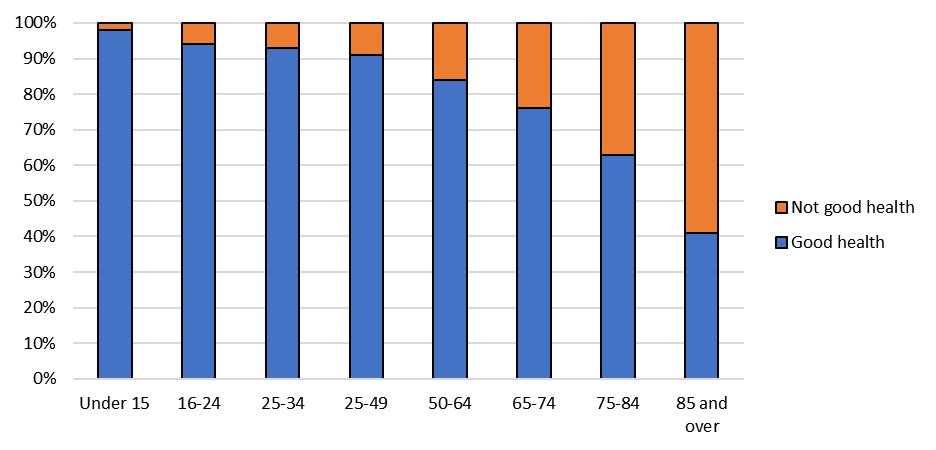
Overall, the health of Surrey residents is better than the England average, and as in all areas, the number of people reporting they are in good health declines with age (Census 2021):
Percentage of Surrey residents reporting as having good health or not good health by age in Surrey
There are significant variations in healthy life expectancy between our most and least deprived areas with differences of over 24 years for women and 17 years for men. A man in Maybury and Sheerwater can expect to live in general good health until 59, compared to 76.5 years for a man in Godalming Holloway, and a woman in Maybury and Sheerwater can expect to live in good health to 58.4 years compared to 83 years in Blackheath and Wonersh. More detail can be found in the population chapter of the Joint Strategic Needs Assessment.
Census 2021 asked people if they have a long-term illness or condition that limits their everyday life. Nearly 1 out of every 7 people (14%) in Surrey answered yes to this question, meaning they meet the definition of being disabled as set out in the Equality Act 2010. Of these, over 100,000 people reported that they are limited a little by their illness or condition and around 62,000 people reported that they are limited a lot.
Number of people in Surrey who are disabled
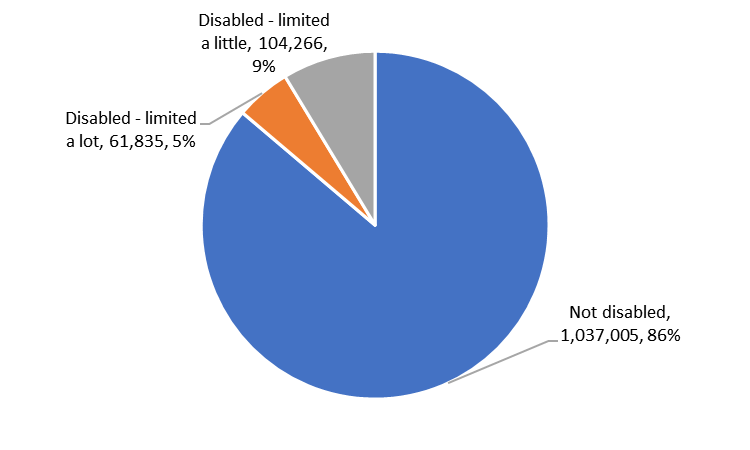
Over a quarter of households (26%) in Surrey have at least one disabled resident, and 5% of households have 2 or more disabled people living in them.
You can read more and find figures for each District and Borough in the disability in Surrey in the Census pages on Surrey-i.
Ethnicity[2]
Surrey’s population is becoming increasingly ethnically diverse, with nearly 1 in 4 residents from an ethnic background other than White British. You can see more detail including a breakdown of figures for District and Borough areas on the ethnicity pages on Surrey-i.
Surrey population by ethnic group
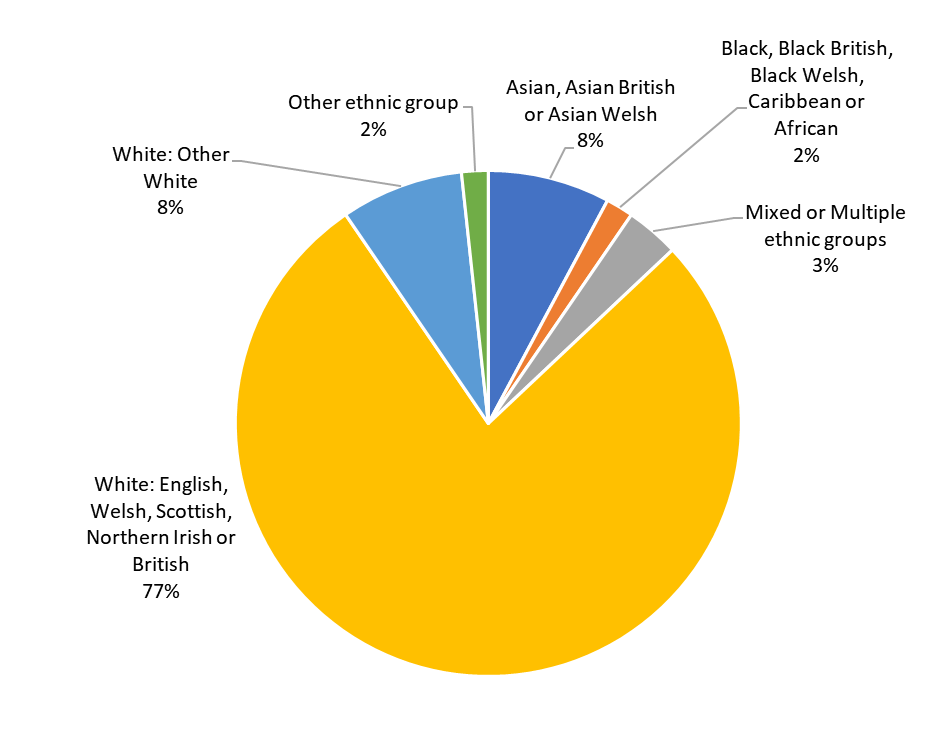
Surrey’s older populations are less ethnically diverse than its younger populations. 91% of Surrey’s over 75s are White British compared to 74% of its under 25-year-olds. At the time of the 2011 Census, 16% of the Surrey population were from ethnic groups other than White British, and by 2021 this had risen significantly to 23%.
After White British, he next largest segment of our community is from ‘Other White’ ethnic backgrounds, making up nearly 1 in 10 residents.
Within the ‘Other White’ group, around a third are from eastern European backgrounds, with the largest cohorts being of Polish, Romanian, Hungarian and Bulgarian origin. Around a quarter are from western European backgrounds, and there are also sizeable groups identifying as Mixed European, North American, Australian, South African, South American, and Turkish.
2,600 people listed their ethnicity as Gypsy or Irish Traveller, with a further nearly 1,700 identifying as Roma.
One in 7 people in Surrey (15%), are from a non-White ethnic background. Nearly 8% are from Asian/Asian British backgrounds, 2% from Black/Black British backgrounds, 3% from mixed or multiple ethnic backgrounds and 2% from other ethnic backgrounds.
In the Asian/Asian British group, the largest reported identities in Surrey are Indian (35,000), Other Asian (24,000), Pakistani (18,000), Chinese (11,000) and Bangladeshi (5,000).
Within the ‘Other Asian’ category, 35 separate ethnicities are reported, with the largest being Filipino (5,400), Sri Lankan (3,600), Nepali (3,200), Korean (1,400) and Thai (1,300).
In the Black/Black British group, the most frequently reported identities in Surrey are African (13,600), Caribbean or African Caribbean (4,800) and Other Black (2,500).
Within the ‘African’ group, the largest identities reported are Nigerian (3,000), Ghanaian (1,200) and Zimbabwean (900).
In the Mixed or Multiple Ethnic groups category, 55 identities are reported with the largest being White and Asian (16,000), White and Black Caribbean (7,600) and White and Black African (5,000).
In the ‘Other Ethnic group’ category, 68 identities were recorded. The largest were Arab (5,300), Iranian (1,400), Hispanic or Latin American (1,400) and ‘any other ethnic group’ (1,800).
Place of birth and migration
18% of Surrey residents (more than 1 in 6 people) were born outside the UK, compared to 14% in 2011. This figure is higher than the South East average of 16%. Woking has the highest proportion of its population born outside the UK at 24%, with 5 other districts (Epsom and Ewell, Elmbridge, Spelthorne, Runneymede and Guildford) having rates above the Surrey average. Tandridge has the lowest proportion (11%), with Mole Valley, Waverly, Reigate and Banstead, and Surrey Heath all being below 18%.
The most common places of birth for those born outside the UK are the EU (6%), Middle East and Asia (5%) and Africa (3%) with India, South Africa and Poland being the most common countries of birth. Most people born outside the UK who are currently living in Surrey arrived in the UK between the ages of 20 and 44. You can find out more including figures for District and Borough areas on the migration pages on Surrey-i.
It can be harder to get a clear picture of more recently arrived sanctuary-seeking populations in Surrey, particularly those who arrived after the 2021 Census. However, we do know that the County has provided sanctuary to a number of groups fleeing persecution, war and unrest in their home countries since 2020. This includes through official refugee resettlement programmes for people from Ukraine, Hong Kong and Afghanistan, as well as others who arrive through informal routes, with Surrey County Council providing support to over 8,700 vulnerable migrants up to March 2024.
Language
The majority of Surrey’s population (93%) reported English as their main language, and 96.5% of households have at least one adult or child who speaks English as their main language. Of the 7% who reported other languages as their main language, the top 4 languages are Polish, Romanian, Portuguese and Spanish.
The majority (nearly 9 in 10) of those who have a main language other than English say they can speak English very well or well. However, this still leaves around 10,000 residents who speak no or little English. Of these, nearly half have EU European languages as their main language, including Portuguese (1,100) and Polish (900). The single largest group are classed as ‘other EU languages[3]’ (2,100). Around 2,100 have South Asian languages as their first language, spread fairly equally between Panjabi, Urdu, Bengali with smaller numbers of Gujarati and Tamil. 1,400 people had East Asian languages as their first language, with the majority of these speaking Mandarin, Cantonese and other Chinese languages.
432 people in Surrey use sign language as their first language. Of these, 332 people in Surrey listed their first language as British Sign Language (BSL), with a further 100 people listing other sign languages or sign communication systems. Around two thirds (278) of people whose first language is a sign language don’t speak English well or at all.
Religion
Half of Surrey residents identify as Christian, a reduction since 2011. This is largely driven by an increase in people reporting they do not have a religion, which rose from 25% in 2011 to 36% in 2021. Religious adherence varies significantly by age; 77% of over 75s identify as Christian while only 14% identified with ‘no religion’, whereas only 34% of 16- to 24-year-olds identify as Christian and half identify with ‘no religion’.
Religious adherence (%) of Surrey population by age
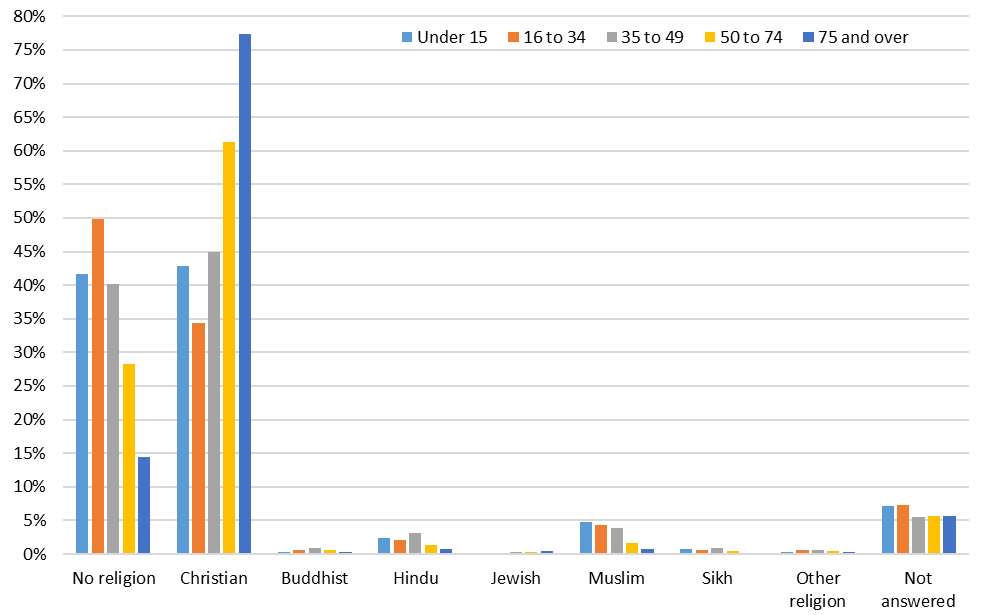
7% of residents in Surrey identify with religions other than Christianity. Of these, the largest minority religious groupings are Muslim (3.2%), followed by Hindu (2%), Sikh (0.6%), Buddhist (0.6%), other religions (0.5%), and Jewish (0.3%). 6.3% of residents did not answer the question. Among religions other than Christianity, there is a more varied picture when looking at adherence by age. More people who identify as Jewish are in the 50+ age range, while the majority of people who identify as Buddhist, Hindu and Sikh are in the 35-49 age group. Muslims are the only religion with highest rates of adherents in the under 15, and 16 to 34 age ranges.
Geographically, the prevalence of Christianity in Surrey ranges from 52% in Mole Valley to 48% in Woking. Christianity is the most common religion in every Surrey district and borough, with Islam the second most commonly reported religion after Christianity (and ‘no religion’) for every Surrey district and borough, other than Spelthorne where this was Hinduism. Woking had the highest proportion of Muslims, making up nearly 1 in every 10 residents (9%). Residents identifying as Muslim represented 5% of the Epsom and Ewell population, 4% of those in Spelthorne, and 3% of those in Reigate and Banstead.
Looking at populations who follow a religion other than Christianity within Surrey, Muslims are the most ethnically diverse. While 2 out of 3 Muslims are from Asian/Asian British backgrounds (42% Pakistani, 12% Bangladeshi, 6% other Asian backgrounds and 5% Indian), 10% stated their ethnicity as Arab, 9% stated White British and other White ethnicities, 7% other ethnic groups, 5% mixed or multiple ethnicities, and 2% Black/Black British.
You can read more on this topic including viewing breakdowns for District and Borough areas on the Religion Census pages on Surrey-i.
Sexual orientation and gender identity
For the first time, the 2021 Census contained a voluntary question on sexual orientation for people over 16 years old. In Surrey, just over 93% of people answered this question, which is slightly above the England average (92.5%).
91% of Surrey’s population identified as straight or heterosexual, and 2.5% identified with LGBTQ+ sexual identities – 1.2% identified as gay or lesbian, 1% as bisexual and 0.3% as ‘other sexual orientation’.
Slightly more women identify as LGBTQ+ than men (2.3% of men and 2.6% of women) even though more women (7%) did not answer the question than men (6.3%).
For the first time, the 2021 Census included a question about gender identity. People over the age of 16 were asked the voluntary question ‘is the gender you identify with the same as your sex registered at birth?’. People were invited to write in their gender identity if they answered ‘no’ to this question.
Just under 95% of the Surrey population answered the question, with 0.4% answering ‘no’, meaning their gender identity was different to sex recorded at birth. 5% of respondents did not answer.
Of the 3,628 people who stated their gender identity is different to their sex recorded at birth, 1,361 people did not specify a gender identity, 731 identified as trans men, 756 identified as trans women, 495 identified as non-binary, and 287 wrote in a different gender identity.
Younger people were more likely to have a gender identity different from their sex recorded at birth. More than twice as many 16–24-year-olds (0.9%) did not identify with their sex recorded at birth than the Surrey average, and 92% stated that they did identify with their sex recorded at birth compared to the Surrey average of 95%. A higher proportion of this age group did not answer the question (7%).
Young people are more likely to report a trans identity than older people, and this appears to be particularly the case among those young people whose sex recorded at birth was female. The proportion of people identifying as trans men is 3 times higher in younger than in older age groups (0.2% for 16–24-year-olds compared to 0.06% for over 25s). This means that 1 in every 500 16-24-year-olds is a trans man compared to 1 in every 1,800 over 25s
Where can you find out more?
Signposting to further reading:
Overview of the UK’s migrant population (The Migration Observatory)
The Surrey Index data platform (Surrey-i)
Census profile overview for Surrey (2021)
Joint Strategic Needs Assessment (Surrey-i)
Briefing on how to understand the 2021 Census for GRT communities
[1] To be published in 2025
[2] See Appendix 1 for a note on how we use terminology around ethnicity in this document
[3] This includes all national languages of countries in the European Union other than French, Polish, Portuguese and Spanish.